As of 6 Jul 2026, IOC share price is ₹141.56. The stock opened at ₹142.32, compared to its previous close of ₹141.62. During today's trading session, IOC share price moved in the range of ₹141.01 to ₹142.32, with an average price of ₹141.66 for the day. Looking at its last 52-week, the stock has touched a low of ₹130.22 and a high of ₹188.96. On the performance front, IOC share price has declined by 15.13% over the last six months and is down 4.27% on a year-on-year basis.
| Name | Mkt Cap Cr | P/E | P/B | ROE | D/E | ROCE | Book Value | Div. Yield | Turnover | EPS(TTM) |
|---|---|---|---|---|---|---|---|---|---|---|
| Reliance | 17,64,370.00 | 22.52 | 2.01 | 10.94% | 0.39 | 10.58% | 3.21 | 0.45% | 0.65 | 32.40 |
| Bharat Petroleum Corp | 1,34,689.00 | 5.21 | 1.34 | 25.80% | 0.22 | 24.02% | 219.66 | 2.38% | 4.56 | 54.54 |
| Hindustan Petroleum Corp | 85,038.40 | 4.71 | 1.30 | 27.53% | 0.88 | 22.06% | 281.26 | 6.07% | 4.49 | 80.72 |
| MRPL | 26,306.50 | 13.67 | 1.85 | 13.56% | 1.08 | 16.43% | 80.83 | 2.66% | 4.13 | 11.02 |
| Chennai Petroleum Corp | 16,875.40 | 5.44 | 1.52 | 27.93% | 0.18 | 31.74% | 725.26 | 5.47% | 6.27 | 205.62 |
| GANDHAR OIL REFINE IND L | 1,830.35 | 13.34 | 1.35 | 10.01% | 0.07 | 13.08% | 132.85 | 0.40% | 2.45 | 14.14 |
| Particulars | Mar 2025 | Mar 2024 | Mar 2023 | Mar 2022 |
|---|---|---|---|---|
| Revenue | ₹758,105.81 | ₹776,351.85 | ₹841,755.91 | ₹589,335.74 |
| Other Income | ₹3,513.73 | ₹3,838.56 | ₹4,261.70 | ₹3,082.22 |
| Total Revenue | ₹761,619.54 | ₹780,190.41 | ₹846,017.61 | ₹592,417.96 |
| Total Expenses | ₹748,154.54 | ₹724,448.55 | ₹831,842.11 | ₹559,364.90 |
| Profit Before Tax | ₹17,063.45 | ₹57,287.79 | ₹15,037.69 | ₹34,288.62 |
| Tax | ₹3,274.62 | ₹14,126.64 | ₹3,333.43 | ₹8,562.02 |
| Profit After Tax | ₹13,788.83 | ₹43,161.15 | ₹11,704.26 | ₹25,726.60 |
| EPS - Basic | ₹9.87 | ₹30.30 | ₹7.11 | ₹27.34 |
| EPS - Diluted | ₹9.87 | ₹30.30 | ₹7.11 | ₹27.34 |
| Particulars | Mar 2025 | Mar 2024 | Mar 2023 | Mar 2022 |
|---|---|---|---|---|
| Profit before tax | ₹17,063.45 | ₹57,287.79 | ₹15,037.69 | ₹34,288.62 |
| Income before WC changes | ₹38,526.63 | ₹76,795.16 | ₹36,802.56 | ₹46,067.27 |
| Change in Assets | -₹246.50 | -₹309.46 | -₹9,398.23 | -₹30,895.14 |
| Change in Liabilities | -₹486.80 | ₹6,565.69 | ₹3,708.89 | ₹16,930.06 |
| Change in WC | -₹733.30 | ₹6,256.23 | -₹5,689.34 | -₹13,965.08 |
| Cash flow from Operations | ₹34,699.28 | ₹71,146.41 | ₹29,643.72 | ₹24,570.33 |
| Cash flow from Investing | -₹31,848.19 | -₹31,511.53 | -₹28,029.56 | -₹21,177.64 |
| Cash flow from Financing | -₹3,424.51 | -₹39,384.64 | -₹1,794.40 | -₹2,997.29 |
| Total Cash Flow | -₹573.42 | ₹250.24 | -₹180.24 | ₹395.40 |
| Cash (Start of the year) | ₹1,246.59 | ₹996.35 | ₹1,176.59 | ₹781.19 |
| Cash (End of the year) | ₹673.17 | ₹1,246.59 | ₹996.35 | ₹1,176.59 |
| Particulars | Mar 2025 | Mar 2024 | Mar 2023 | Mar 2022 |
|---|---|---|---|---|
| Non-Current Assets | ₹349,223.90 | ₹323,919.38 | ₹283,865.03 | ₹263,764.16 |
| Current Assets | ₹157,643.15 | ₹158,442.62 | ₹157,853.45 | ₹146,860.69 |
| Total Assets | ₹506,867.05 | ₹482,362.00 | ₹441,718.48 | ₹410,624.85 |
| Current Liabilities | ₹230,614.41 | ₹216,403.93 | ₹206,637.68 | ₹192,129.64 |
| Net Current Asset | -₹72,971.26 | -₹57,961.31 | -₹48,784.23 | -₹45,268.95 |
| Non-Current Liabilities | ₹85,227.98 | ₹77,795.09 | ₹91,866.46 | ₹83,368.56 |
| Equity Capital | ₹191,024.66 | ₹188,162.98 | ₹143,214.34 | ₹135,126.65 |
| Total Equity & Liabilities | ₹506,867.05 | ₹482,362.00 | ₹441,718.48 | ₹410,624.85 |
| Particulars | Mar 2025 | Mar 2024 | Mar 2023 | Mar 2022 |
|---|---|---|---|---|
| Revenue | ₹755,949.62 | ₹774,348.59 | ₹839,472.20 | ₹598,149.21 |
| Other Income | ₹4,963.84 | ₹4,780.82 | ₹6,235.22 | ₹4,338.80 |
| Total Revenue | ₹760,913.46 | ₹779,129.41 | ₹845,707.42 | ₹602,488.01 |
| Total Expenses | ₹746,869.14 | ₹726,785.20 | ₹836,009.28 | ₹570,754.94 |
| Profit Before Tax | ₹15,882.34 | ₹52,344.21 | ₹9,698.14 | ₹31,733.07 |
| Tax | ₹2,920.77 | ₹12,725.37 | ₹1,456.32 | ₹7,548.97 |
| Profit After Tax | ₹12,961.57 | ₹39,618.84 | ₹8,241.82 | ₹24,184.10 |
| EPS - Basic | ₹9.41 | ₹28.77 | ₹5.98 | ₹17.56 |
| EPS - Diluted | ₹9.41 | ₹28.77 | ₹5.98 | ₹17.56 |
| Particulars | Mar 2025 | Mar 2024 | Mar 2023 | Mar 2022 |
|---|---|---|---|---|
| Profit before tax | ₹15,882.34 | ₹52,344.21 | ₹9,698.14 | ₹31,733.07 |
| Income before WC changes | ₹35,686.52 | ₹70,626.51 | ₹28,457.58 | ₹43,655.97 |
| Change in Assets | ₹5.83 | ₹2,518.75 | -₹10,637.68 | -₹28,735.23 |
| Change in Liabilities | ₹275.43 | ₹5,589.87 | ₹3,305.21 | ₹15,101.07 |
| Change in WC | ₹281.26 | ₹8,108.62 | -₹7,332.47 | -₹13,634.16 |
| Cash flow from Operations | ₹33,170.46 | ₹68,096.60 | ₹20,985.35 | ₹22,791.27 |
| Cash flow from Investing | -₹29,261.29 | -₹29,701.62 | -₹25,285.63 | -₹20,799.99 |
| Cash flow from Financing | -₹4,110.28 | -₹38,294.02 | ₹3,953.69 | -₹1,595.11 |
| Total Cash Flow | -₹201.11 | ₹100.96 | -₹346.59 | ₹396.17 |
| Cash (Start of the year) | ₹464.28 | ₹363.32 | ₹709.91 | ₹313.74 |
| Cash (End of the year) | ₹263.17 | ₹464.28 | ₹363.32 | ₹709.91 |
| Particulars | Mar 2025 | Mar 2024 | Mar 2023 | Mar 2022 |
|---|---|---|---|---|
| Non-Current Assets | ₹333,907.25 | ₹311,148.36 | ₹270,267.97 | ₹251,017.28 |
| Current Assets | ₹146,093.09 | ₹146,092.26 | ₹149,633.36 | ₹137,321.82 |
| Total Assets | ₹480,000.34 | ₹457,240.62 | ₹419,901.33 | ₹388,339.10 |
| Current Liabilities | ₹219,267.66 | ₹210,793.21 | ₹200,939.85 | ₹182,007.71 |
| Net Current Asset | -₹73,174.57 | -₹64,700.95 | -₹51,306.49 | -₹44,685.89 |
| Non-Current Liabilities | ₹82,055.82 | ₹69,732.43 | ₹84,203.94 | ₹75,045.03 |
| Equity Capital | ₹178,676.86 | ₹176,714.98 | ₹134,757.54 | ₹131,286.36 |
| Total Equity & Liabilities | ₹480,000.34 | ₹457,240.62 | ₹419,901.33 | ₹388,339.10 |
Established in: 1959 Managing Director: Arvinder Singh Sahney
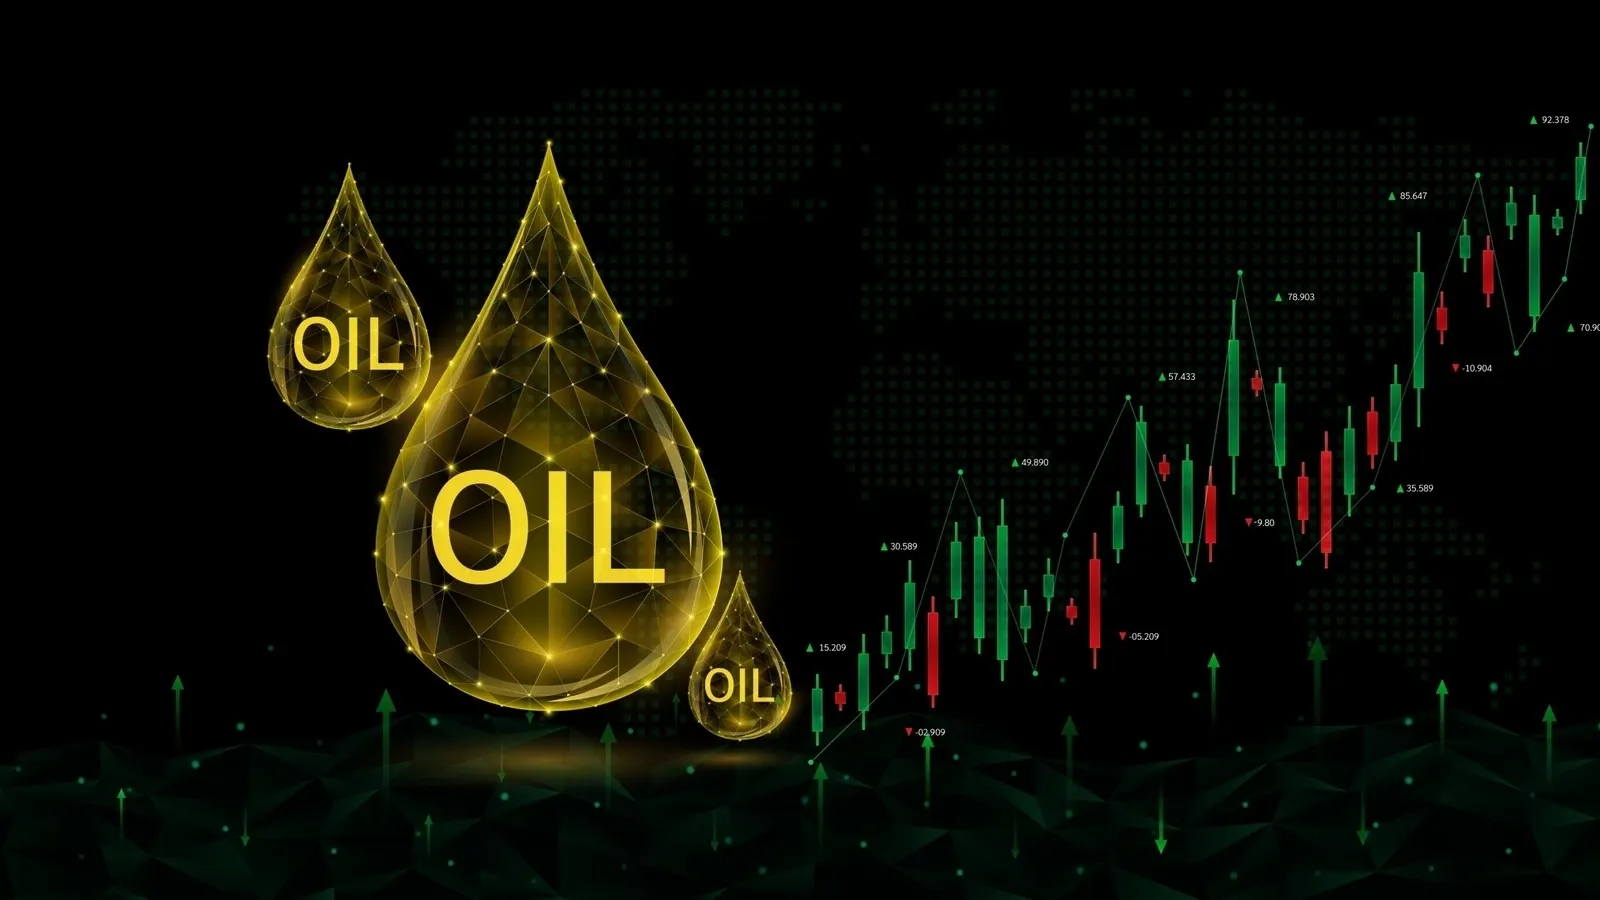
Indian Oil Corporation (IOC) is India’s largest government-owned Maharatna company in the oil and gas industry. From refining crude oil to marketing fuels, lubricants, gas and petrochemicals. IOC touches almost every aspect of daily energy needs.
With a vast network of refineries, pipelines, fuel stations and LPG distributors, IOC ensures reliable energy access across urban and rural India.
Indian Oil Corporation comprises seven main business divisions, which include refineries, pipelines, marketing, petrochemicals, R&D, exploration, explosives and cryogenics.
At present, IOC is steadily expanding its footprint in cleaner fuels and sustainable energy solutions.
IOC’s journey began in 1959, when it was set up to strengthen India’s self-reliance in petroleum products. On September 1, 1964, Indian Refineries Limited merged with Indian Oil Company Limited and the new entity was named Indian Oil Corporation Limited.
Over the years, the IOC built world-class refineries, an extensive pipeline network and one of the largest retail fuel chains in India.
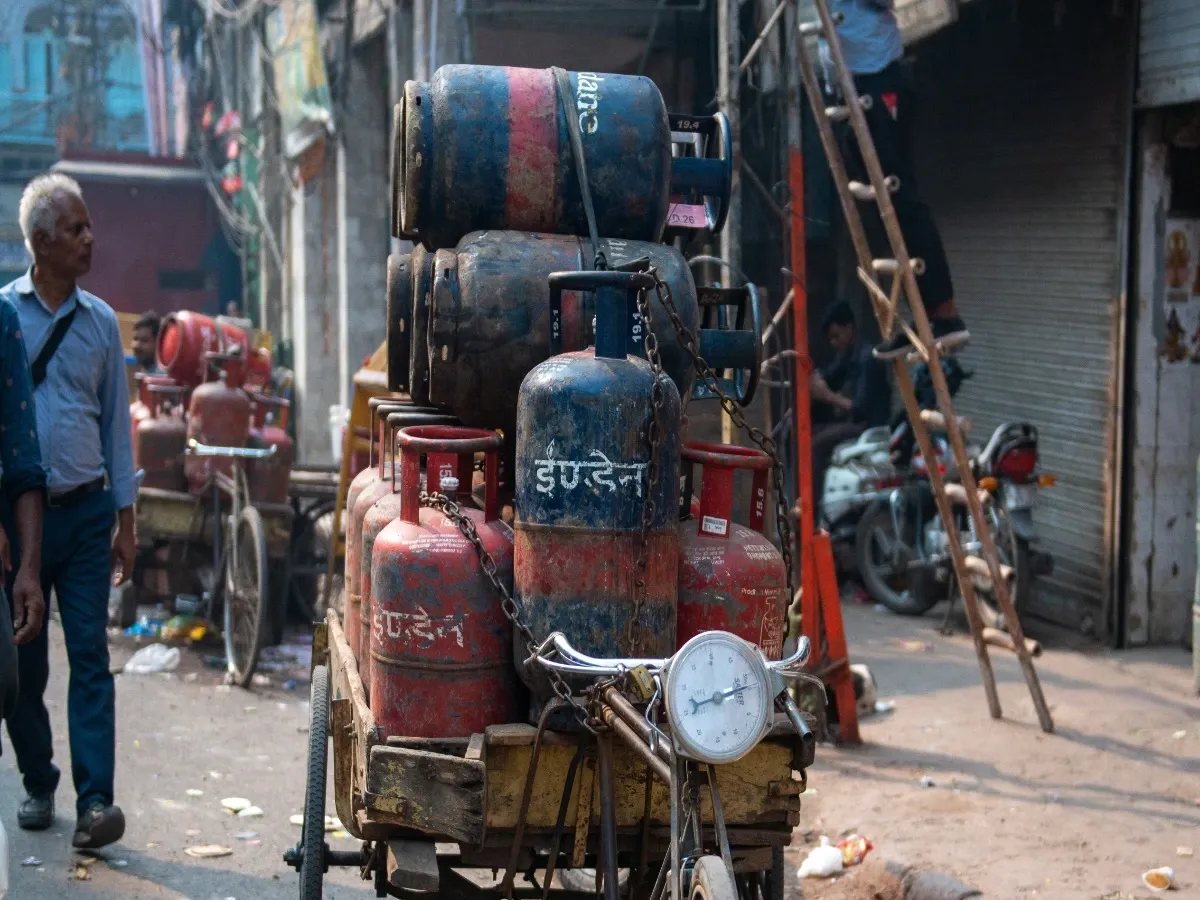
IOC played a key role in popularising LPG in Indian households and supporting industrial growth. Today, IOC continues to adapt, investing in petrochemicals, natural gas, biofuels and hydrogen.
The business segments of IOC are as follows:
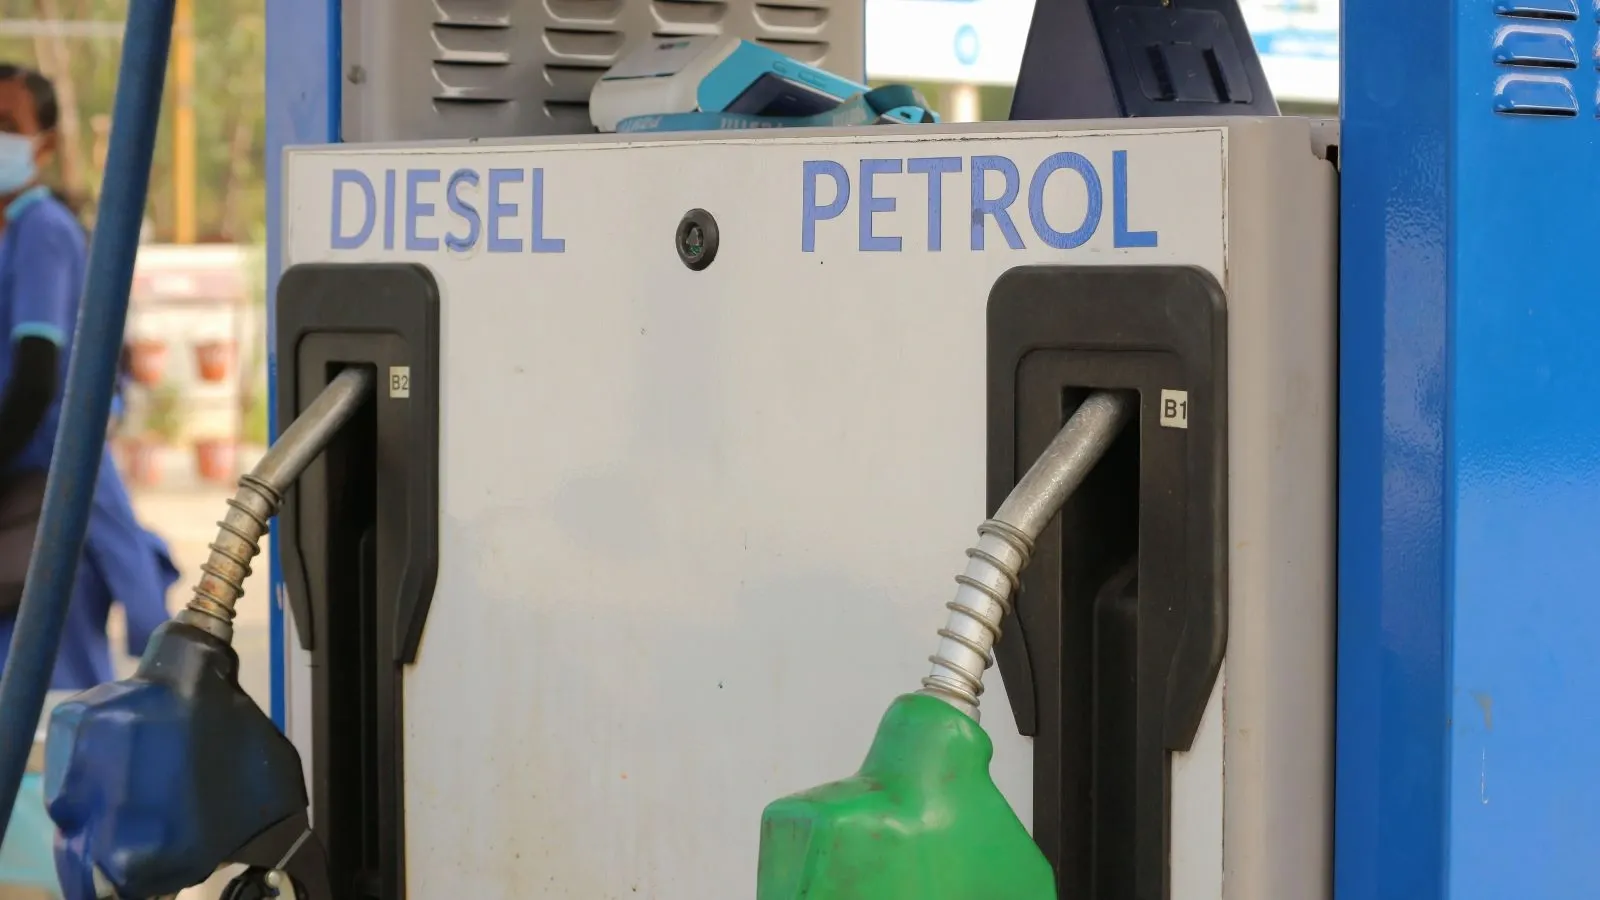
Refining: IOC operates some of India’s largest refineries, where crude oil is turned into petrol, diesel, LPG, aviation fuel and other products.
Pipelines: The company has an extensive pipeline infrastructure that efficiently transports crude oil, petroleum products and gas across long distances.
Petrochemicals: IOC produces key petrochemical products used in plastics, packaging, textiles and everyday consumer goods.
Natural Gas: IOC is expanding in natural gas sourcing, trading and city gas distribution to support cleaner energy consumption.
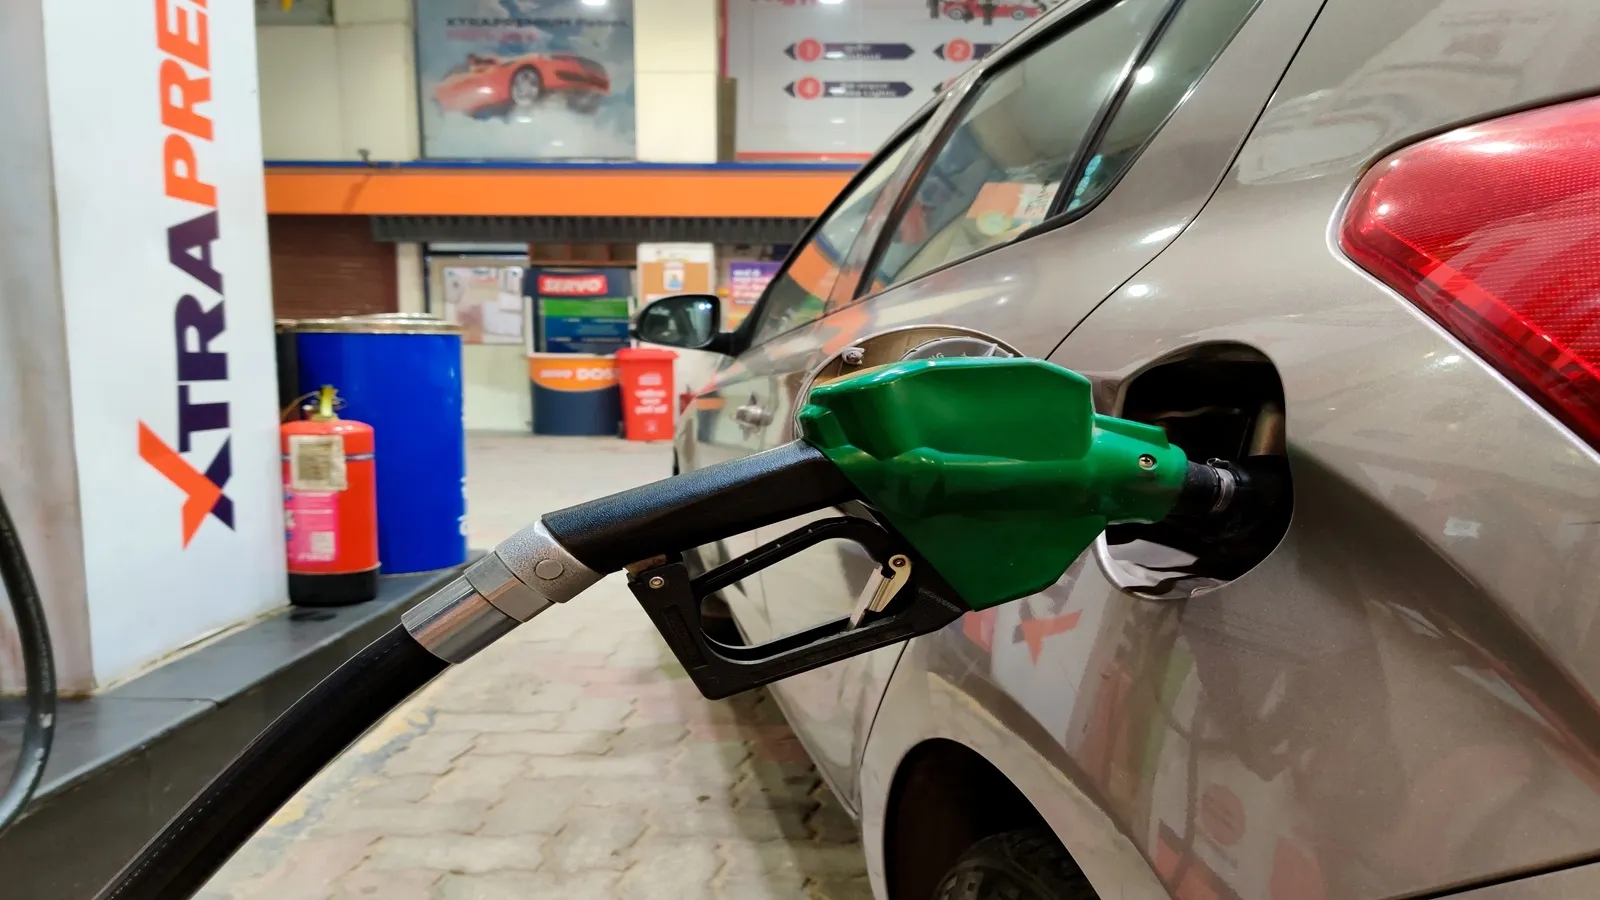
Marketing and Distribution: Through IOC's vast network of fuel stations, LPG distributors and aviation fuel outlets, IOC ensures energy reaches households, vehicles and industries across India.
Clean Energy: From biofuels and ethanol blending to hydrogen and renewable energy projects. The company is actively preparing for a clean energy transition.
The company has committed to achieving net-zero operational emissions by 2046, aligning with India’s goal of 2070.
Management predicts that India’s oil demand will continue to grow, with a peak demand unlikely before 2035.
IOC plans capex of ₹2.4 to ₹2.7 lakh crore between FY24 and FY30 with a focus on refining, petrochemicals, pipelines and clean energy. IOC Financial Performance (FY25 vs FY24)
Revenue: IOC reported a consolidated revenue of ₹7,61,619.54 crore in FY25 vs ₹7,80,190.41 crore in FY24. It showed a decrease of -2.38% on a yearly basis, reflecting mild negative performance.
Operating Profit: The company reported an operating profit of ₹17,063.45 crore in FY25 vs ₹57,287.79 crore in FY24. It showed a decrease of -70.21% on a year-on-year basis.
Net Profit: IOC reported a net profit of ₹13,788.83 crore in FY25 compared to ₹43,161.15 crore in FY24. It showed a decrease of -68.05% on a yearly basis.
IOC share price is ₹141.56 as on 03 Jul, 2026, 15:59 IST.
In the last 1 year, IOC delivered a return of -4.27%. The IOC share price hit a high of ₹188.96 and low of ₹130.22.
The Mutual Fund Shareholding in IOC was 2.52% at the end of Mar 2026.
The 52-week high and low of IOC share is ₹188.96 and ₹130.22 as of 03 Jul, 2026.
The market capitalisation of IOC is ₹2,00,098.00 Crores as on 03 Jul, 2026.
The stock symbol of IOC is IOC on the NSE, 530965 on the BSE, and the ISIN is INE242A01010.
IOC shares closed yesterday at ₹141.62 on NSE & ₹141.70 on BSE
To buy IOC shares, open a demat account with Upstox and complete the KYC process. Once your account is set up, search for the stock and place your order.
No, shares of IOC or any other publicly traded company cannot be bought or sold on holidays when the stock exchanges are closed. You can only buy or sell IOC shares on days when the stock exchanges are open for trading. It's important to check the NSE & BSE holidays calendar, before placing any trades to avoid any inconvenience.
The PE and PB ratio of IOC is 4.58 and 0.91 respectively, as on 03 Jul, 2026, 15:59 IST.