Avenue Supermarts Share Price
Avenue Supermarts Share Price Today
As of 25 Jul 2026, Avenue Supermarts share price is ₹4,018.80. The stock opened at ₹4,010.00, compared to its previous close of ₹4,035.00. During today's trading session, Avenue Supermarts share price moved in the range of ₹3,990.00 to ₹4,074.80, with an average price of ₹4,032.40 for the day. Looking at its last 52-week, the stock has touched a low of ₹3,529.00 and a high of ₹4,949.50. On the performance front, Avenue Supermarts share price has increased by 9.64% over the last six months and is down 0.05% on a year-on-year basis.
Avenue Supermarts Returns Calculator
Avenue Supermarts Shareholder Returns
Avenue Supermarts Share Price History
| Name | Mkt Cap Cr | P/E | P/B | ROE | D/E | ROCE | Book Value | Div. Yield | Turnover | EPS(TTM) |
|---|---|---|---|---|---|---|---|---|---|---|
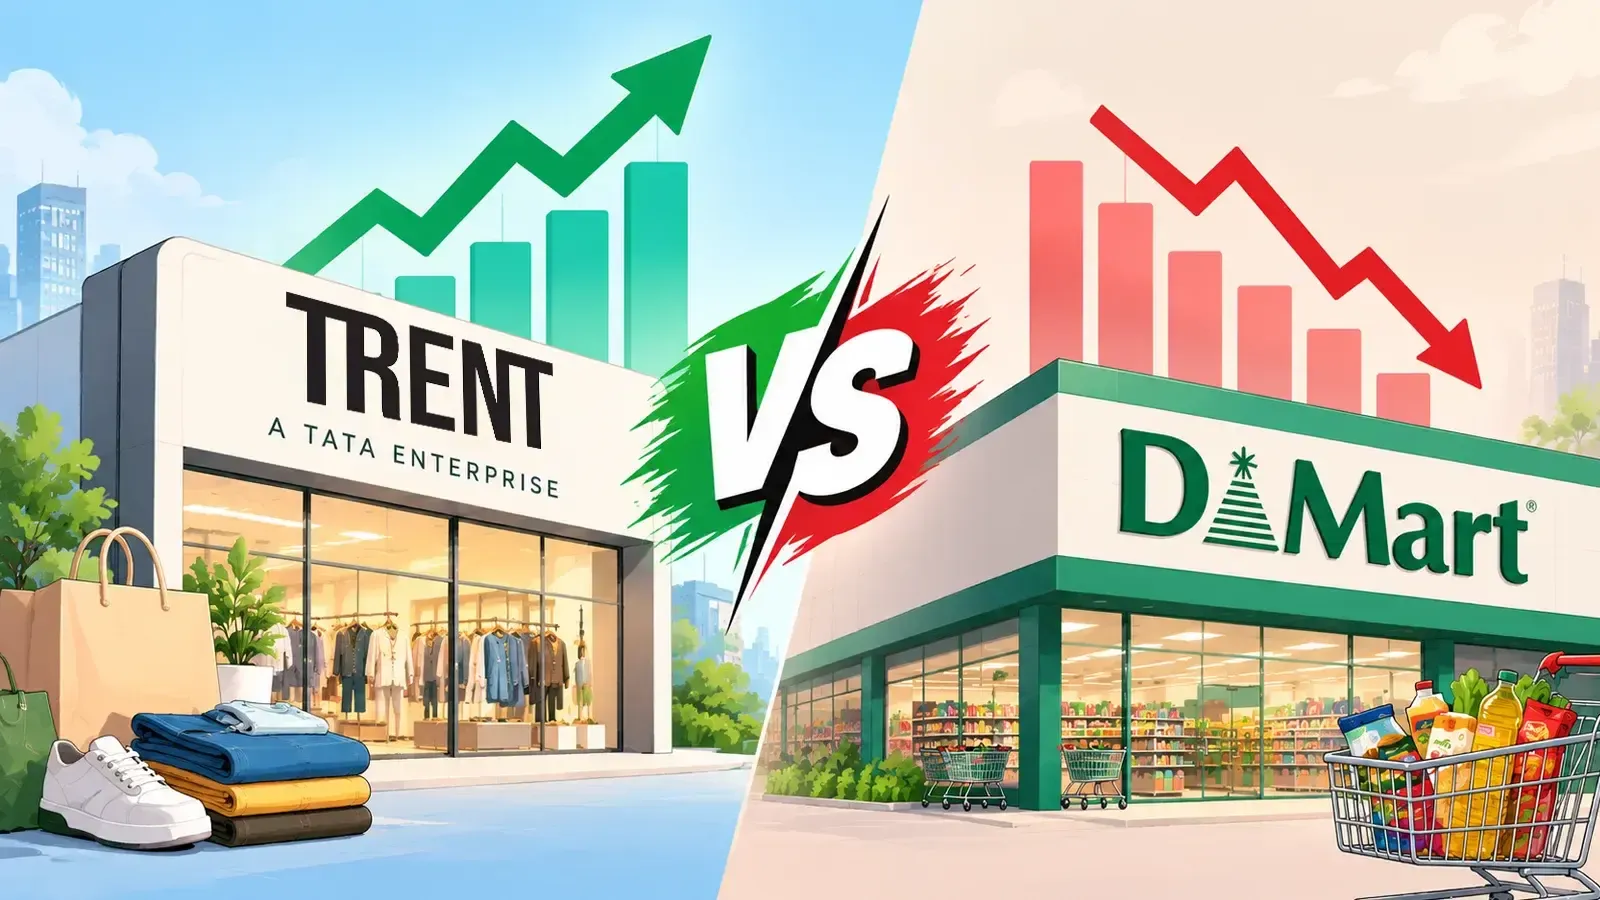
| Trent | 1,53,256.00 | 68.11 | 16.77 | 27.66% | 0.35 | 27.94% | 15.21 | 0.12% | 2.17 | 55.36 |
| Vishal Mega Mart | 51,457.10 | 57.82 | 6.93 | 11.32% | 0.02 | 13.79% | 15.03 | 0.00% | 0.79 | 1.41 |
| Cartrade Tech | 12,749.90 | 52.36 | 5.13 | 8.98% | 0.01 | 11.42% | 480.25 | 0.00% | 0.13 | 24.23 |
| ADITYA BIRLA LIFES BRAN L | 11,320.30 | 66.25 | 8.02 | 14.81% | 2.08 | 12.01% | 11.41 | 0.54% | 1.94 | 1.11 |
| BRAINBEES SOLUTIONS LTD | 10,937.80 | -53.72 | 2.26 | -2.10% | 0.07 | 0.59% | 121.58 | 0.00% | 0.40 | 2.09 |
| Medplus Health | 8,587.40 | 41.15 | 4.38 | 11.12% | 0.07 | 11.64% | 109.55 | 0.00% | 0.61 | 5.21 |
| V2 RETAIL LIMITED | 7,987.39 | 42.47 | 7.62 | 14.16% | 1.49 | 15.09% | 7.62 | 0.00% | 2.03 | 4.62 |
| ADITYA VISION LIMITED | 7,994.94 | 68.41 | 11.61 | 16.98% | 0.83 | 15.52% | 53.31 | 0.20% | 2.96 | 9.07 |
| Redtape | 7,059.35 | 29.36 | 6.91 | 23.55% | 0.70 | 22.53% | 18.53 | 1.76% | 1.80 | 4.42 |
| Ethos | 6,843.95 | 71.81 | 4.64 | 6.37% | 0.21 | 8.71% | 553.66 | 0.00% | 0.93 | 36.27 |
Avenue Supermarts Financials
Income Statement · Consolidated
| Particulars | Mar 2026 | Mar 2025 | Mar 2024 | Mar 2023 |
|---|---|---|---|---|
| Revenue | ₹68,820.74 | ₹59,358.05 | ₹50,788.83 | ₹42,839.56 |
| Other Income | ₹74.10 | ₹124.31 | ₹146.45 | ₹129.34 |
| Total Revenue | ₹68,894.84 | ₹59,482.36 | ₹50,935.28 | ₹42,968.90 |
| Total Expenses | ₹64,813.22 | ₹55,809.69 | ₹47,473.95 | ₹39,908.81 |
| Profit Before Tax | ₹4,081.62 | ₹3,672.67 | ₹3,461.33 | ₹3,060.09 |
| Tax | ₹1,111.76 | ₹965.22 | ₹925.72 | ₹681.75 |
| Profit After Tax | ₹2,969.86 | ₹2,707.45 | ₹2,535.61 | ₹2,378.34 |
| EPS - Basic | ₹45.65 | ₹41.61 | ₹38.99 | ₹36.72 |
| EPS - Diluted | ₹45.63 | ₹41.50 | ₹38.93 | ₹36.49 |
Cash Flow · Consolidated
| Particulars | Mar 2025 | Mar 2024 | Mar 2023 | Mar 2022 |
|---|---|---|---|---|
| Profit before tax | ₹3,672.67 | ₹3,461.33 | ₹3,060.09 | ₹2,064.12 |
| Income before WC changes | ₹4,534.91 | ₹4,131.38 | ₹3,659.04 | ₹2,515.09 |
| Change in Assets | -₹1,265.14 | -₹890.70 | -₹549.76 | -₹613.21 |
| Change in Liabilities | ₹152.43 | ₹246.93 | ₹229.88 | ₹30.72 |
| Change in WC | -₹1,112.71 | -₹643.77 | -₹319.88 | -₹582.49 |
| Cash flow from Operations | ₹2,462.97 | ₹2,745.84 | ₹2,630.27 | ₹1,372.35 |
| Cash flow from Investing | -₹2,185.31 | -₹2,468.23 | -₹2,313.10 | -₹1,289.49 |
| Cash flow from Financing | -₹259.30 | -₹147.64 | -₹205.14 | -₹179.24 |
| Total Cash Flow | ₹18.36 | ₹129.97 | ₹112.03 | -₹96.38 |
| Cash (Start of the year) | ₹337.12 | ₹207.15 | ₹95.12 | ₹191.50 |
| Cash (End of the year) | ₹355.48 | ₹337.12 | ₹207.15 | ₹95.12 |
Balance Sheet · Consolidated
| Particulars | Mar 2025 | Mar 2024 | Mar 2023 | Mar 2022 |
|---|---|---|---|---|
| Non-Current Assets | ₹17,928.09 | ₹14,975.17 | ₹12,657.90 | ₹12,029.79 |
| Current Assets | ₹6,392.20 | ₹6,202.03 | ₹5,448.39 | ₹3,442.85 |
| Total Assets | ₹24,320.29 | ₹21,177.20 | ₹18,106.29 | ₹15,472.64 |
| Current Liabilities | ₹2,212.16 | ₹1,979.14 | ₹1,467.01 | ₹1,218.29 |
| Net Current Asset | ₹4,180.04 | ₹4,222.89 | ₹3,981.38 | ₹2,224.56 |
| Non-Current Liabilities | ₹681.43 | ₹500.72 | ₹560.50 | ₹576.46 |
| Equity Capital | ₹21,426.70 | ₹18,697.34 | ₹16,078.78 | ₹13,677.89 |
| Total Equity & Liabilities | ₹24,320.29 | ₹21,177.20 | ₹18,106.29 | ₹15,472.64 |
Income Statement · Standalone
| Particulars | Mar 2025 | Mar 2024 | Mar 2023 | Mar 2022 |
|---|---|---|---|---|
| Revenue | ₹57,789.81 | ₹49,532.95 | ₹41,833.25 | ₹30,352.50 |
| Other Income | ₹174.02 | ₹189.05 | ₹163.09 | ₹140.87 |
| Total Revenue | ₹57,963.83 | ₹49,722.00 | ₹41,996.34 | ₹30,493.37 |
| Total Expenses | ₹54,080.66 | ₹46,110.62 | ₹38,765.18 | ₹28,311.64 |
| Profit Before Tax | ₹3,883.17 | ₹3,611.38 | ₹3,231.16 | ₹2,181.73 |
| Tax | ₹955.99 | ₹916.46 | ₹674.76 | ₹565.56 |
| Profit After Tax | ₹2,927.18 | ₹2,694.92 | ₹2,556.40 | ₹1,616.17 |
| EPS - Basic | ₹44.98 | ₹41.43 | ₹39.46 | ₹24.95 |
| EPS - Diluted | ₹44.87 | ₹41.36 | ₹39.22 | ₹24.75 |
Cash Flow · Standalone
| Particulars | Mar 2026 | Mar 2025 | Mar 2024 | Mar 2023 |
|---|---|---|---|---|
| Profit before tax | ₹4,318.50 | ₹3,883.17 | ₹3,611.38 | ₹3,231.16 |
| Income before WC changes | ₹5,293.70 | ₹4,578.06 | ₹4,122.35 | ₹3,679.49 |
| Change in Assets | -₹983.51 | -₹1,149.61 | -₹909.29 | -₹533.90 |
| Change in Liabilities | ₹355.53 | ₹114.50 | ₹260.34 | ₹232.45 |
| Change in WC | -₹627.98 | -₹1,035.11 | -₹648.95 | -₹301.45 |
| Cash flow from Operations | ₹3,612.30 | ₹2,597.31 | ₹2,743.02 | ₹2,677.97 |
| Cash flow from Investing | -₹4,425.08 | -₹2,322.19 | -₹2,584.24 | -₹2,442.18 |
| Cash flow from Financing | ₹350.35 | -₹203.82 | -₹86.69 | -₹132.41 |
| Total Cash Flow | -₹462.43 | ₹71.30 | ₹72.09 | ₹103.38 |
| Cash (Start of the year) | ₹330.22 | ₹258.92 | ₹186.83 | ₹83.45 |
| Cash (End of the year) | -₹132.21 | ₹330.22 | ₹258.92 | ₹186.83 |
Balance Sheet · Standalone
| Particulars | Mar 2025 | Mar 2024 | Mar 2023 | Mar 2022 |
|---|---|---|---|---|
| Non-Current Assets | ₹18,718.78 | ₹15,505.84 | ₹12,906.19 | ₹12,052.82 |
| Current Assets | ₹6,172.69 | ₹6,060.28 | ₹5,337.41 | ₹3,351.14 |
| Total Assets | ₹24,891.47 | ₹21,566.12 | ₹18,243.60 | ₹15,403.96 |
| Current Liabilities | ₹2,044.40 | ₹1,876.35 | ₹1,332.87 | ₹1,094.29 |
| Net Current Asset | ₹4,128.29 | ₹4,183.93 | ₹4,004.54 | ₹2,256.85 |
| Non-Current Liabilities | ₹616.90 | ₹409.16 | ₹408.20 | ₹385.56 |
| Equity Capital | ₹22,230.17 | ₹19,280.61 | ₹16,502.53 | ₹13,924.11 |
| Total Equity & Liabilities | ₹24,891.47 | ₹21,566.12 | ₹18,243.60 | ₹15,403.96 |
About Avenue Supermarts
Established in: 2000
Chairman: Radhakishan Damani
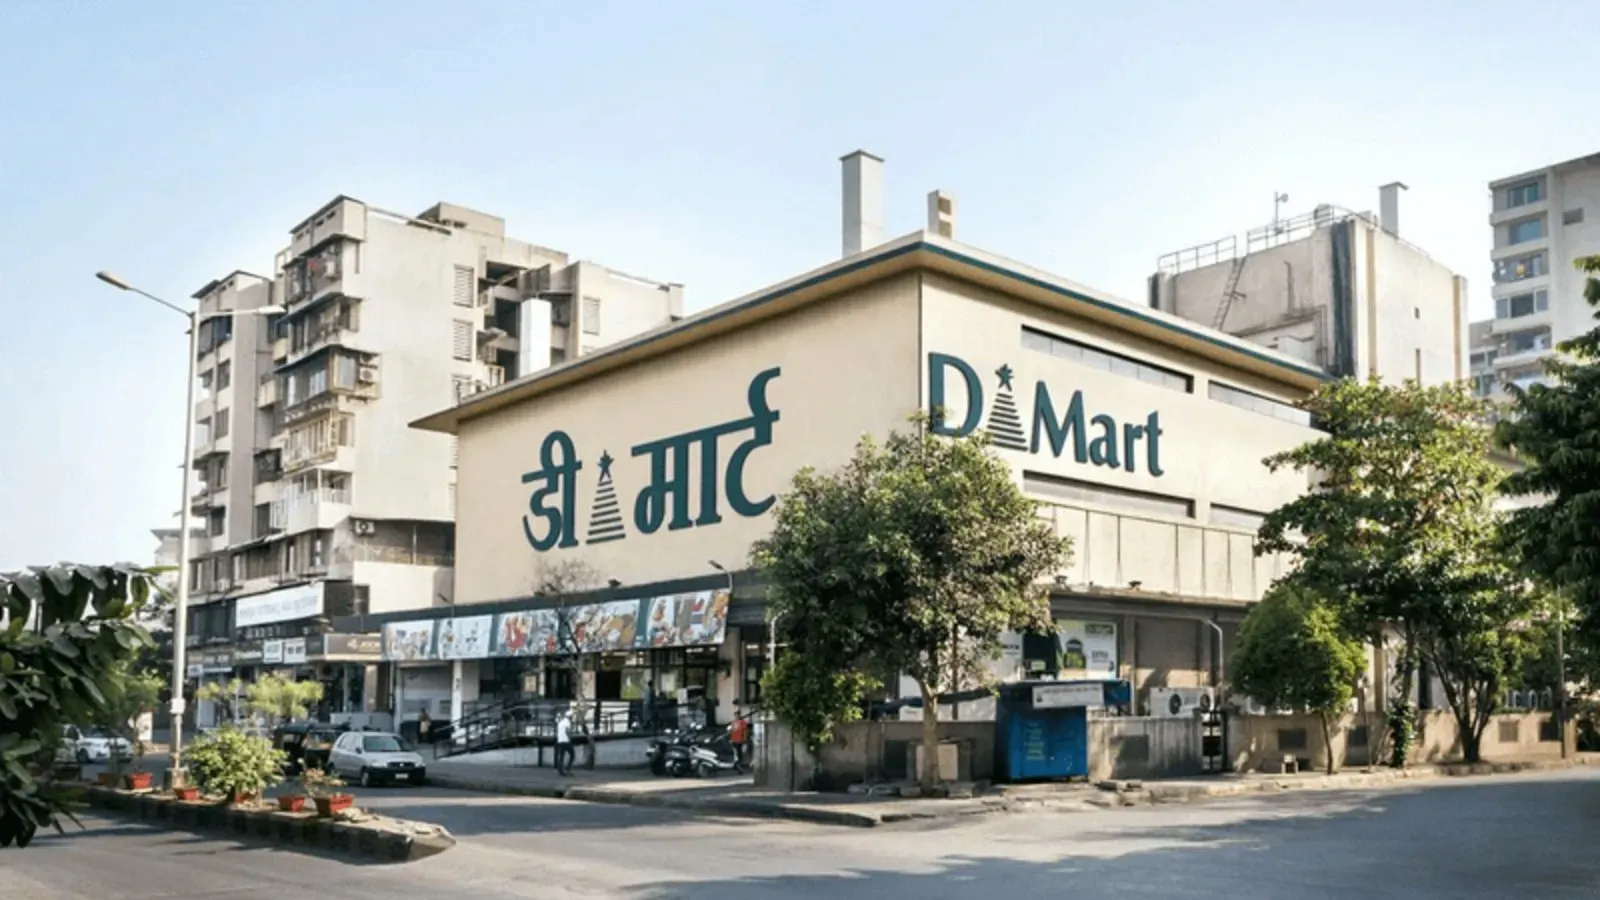
Avenue Supermarts Limited, famously known as DMart, is a domestic retail company that operates multiple supermarkets and hypermarkets. Avenue Supermarts was founded by Radhdakishan Damani in 2000 and is headquartered in Mumbai.
Avenue Supermarts Limited (DMart) operates around 479 stores in 12 states and union territories in India and has over 13,971 permanent employees and 59,961 employees hired on a contract basis.

The company launched its Initial Public Offering (IPO) in March 2017 with an issue price of ₹299 per share and raised ₹1,870 crore. The company decided to go public to repay its debt of around ₹1,080 crore and to construct new stores. Avenue Supermarts Limited was listed on both the stock exchanges, NSE & BSE.

History of Avenue Supermarts Limited
Avuenue Supermarts Limited (DMart) was established in 2000 by Chairman Radhakishan Damani and opened its first store in 2002 in Powai, Mumbai. To attract customers, the company adopted the “Everyday Low Price” strategy and slowly expanded its stores, opening up 29 stores in Maharashtra and Gujarat by 2010.
By 2013, Avenue Supermarts Limited was operating 65 stores across Maharashtra and Gujarat and expanded to other states, opening in Hyderabad and Bangalore. During this period. DMart had become a household name in Maharashtra and Gujarat, becoming the third-largest retail company by revenue, after Reliance Retail and Future Group.
DMart entered Telangana, Andhra Pradesh, Karnataka, Madhya Pradesh and Chhattisgarh, having a network of 112 stores by October 2016. By the end of the year, DMart started its e-commerce venture called ‘DMart Ready’, which allowed users to order groceries and other household products online and delivered to their doorstep.
Revenue Segments of Avenue Supermarts Limited
Avenue Supermarts Limited, which is the parent company and the official name of the DMart retail chain, has its business categories into three primary revenue segments, such as Foods, Non-Foods (FMCG) and General Merchandise and Apparel. The following is a breakdown of the company’s core segments.
-
Foods Groceries and other foods are the largest revenue-driving segment of the company, with 50% of the total revenue coming from it. At a regular DMart store, you will find groceries, staples, dairy products, frozen foods, fruits, vegetables, processed foods and other snacks at prices usually lower than their MRP.
-
Non-Foods The non-food segment is the company's second-largest revenue generator, accounting for around 20% of revenue. Non-food items include FMCG such as home care, cleaning products, skin care, personal care, hygiene products, cosmetics, and over-the-counter essential products.
-
General Merchandise & Apparel The general merchandise and Apparel segments account for the remainder of the company’s retail revenue and offer a wide variety of household utility and lifestyle products, such as clothes, bed and bath products, toys, games, crockery, plastic goods, kitchenware, electrical appliances, and footwear.
-
Other Business Channels Avenue SuperMarts Limited also operates through other complementary channels along with its physical hypermarket segments. The company launched its e-commerce venture, DMart Ready, dedicated to online retail of groceries and other products in a few metropolitan cities. The company also established Avenue Food Plaza Private Ltd., which operates small fast-food and beverage stalls outside DMart stores.
Future Plans of Avenue SuperMarts (DMart)
Avenue SuperMarts Limited is currently planning to open around 40 to 45 new stores annually, scale up the "DMart Ready" e-commerce presence, and advertise and scale up its private-label margins in smaller cities. The company plans to expand and open up stores in northern and eastern India.
Avenue Supermarts Financial Highlights
- Revenue: Avenue Supermarts reported revenue of ₹68,894.84 crore in FY26 vs ₹59,482.36 crore in FY25. It showed an increase of 15.82% on a yearly basis.
- Operating Profit: Avenue Supermarts reported an operating profit of ₹4,081.62 crore in FY26 vs ₹3,672.67 crore in FY25. It showed an increase of 11.13% on a year-on-year basis.
- Net Profit: Avenue Supermarts reported a net profit of ₹2,969.86 crore in FY26 vs ₹2,707.45 crore in FY25. It showed an increase of 9.69% on a yearly basis.
Avenue Supermarts Quarterly Result Highlights
- Avenue Supermarts reported revenue of ₹18,820.31 crore in Jun 2026, compared with ₹17,702.03 crore in Mar 2026, representing an increase of 6.32% on a quarter-on-quarter (QoQ) basis.
- Avenue Supermarts reported an operating profit of ₹1,183.14 crore in Jun 2026, compared with ₹904.17 crore in Mar 2026, representing an increase of 30.85% on a quarter-on-quarter (QoQ) basis.
- Avenue Supermarts reported a profit of ₹860.44 crore in Jun 2026, compared with ₹656.42 crore in Mar 2026, reflecting an increase of 31.08% on a QoQ basis.
- The earnings per share (EPS) of Avenue Supermarts stood at ₹45.65 during Jun 2026.
Similar Stocks
FAQs on Avenue Supermarts Share Price
What is Avenue Supermarts share price today?
Avenue Supermarts share price is ₹4,018.80 as on 24 Jul, 2026, 15:40 IST.
How has the Avenue Supermarts share price performed in the past?
In the last 1 year, Avenue Supermarts delivered a return of -0.05%. The Avenue Supermarts share price hit a high of ₹4,949.50 and low of ₹3,529.00.
How much is the Mutual Fund shareholding in Avenue Supermarts shares?
The Mutual Fund Shareholding in Avenue Supermarts was 6.64% at the end of Jun 2026.
What is the the 52-week high and low of Avenue Supermarts shares ?
The 52-week high and low of Avenue Supermarts share is ₹4,949.50 and ₹3,529.00 as of 24 Jul, 2026.
What is the market cap of Avenue Supermarts?
The market capitalisation of Avenue Supermarts is ₹2,63,348.00 Crores as on 24 Jul, 2026.
What are the stock symbols of Avenue Supermarts?
The stock symbol of Avenue Supermarts is DMART on the NSE, 540376 on the BSE, and the ISIN is INE192R01011.
What was yesterday's closing price of Avenue Supermarts shares ?
Avenue Supermarts shares closed yesterday at ₹4,035.00 on NSE & ₹4,037.55 on BSE
How to buy Avenue Supermarts shares?
To buy Avenue Supermarts shares, open a demat account with Upstox and complete the KYC process. Once your account is set up, search for the stock and place your order.
Can I buy Avenue Supermarts shares on Holidays?
No, shares of Avenue Supermarts or any other publicly traded company cannot be bought or sold on holidays when the stock exchanges are closed. You can only buy or sell Avenue Supermarts shares on days when the stock exchanges are open for trading. It's important to check the NSE & BSE holidays calendar, before placing any trades to avoid any inconvenience.
What is the PE and PB ratio of Avenue Supermarts?
The PE and PB ratio of Avenue Supermarts is 86.13 and 10.76 respectively, as on 24 Jul, 2026, 15:40 IST.