Logo

Polycab India Share Price

NSE: POLYCAB
|
Cable
₹ 9,548.50
-₹86.50 (-0.9%)
1D
Last updated 03 Jul, 2026, 15:54 IST

Polycab India Share Price Today

As of 4 Jul 2026, Polycab India share price is ₹9,548.50. The stock opened at ₹9,688.00, compared to its previous close of ₹9,635.00. During today's trading session, Polycab India share price moved in the range of ₹9,531.00 to ₹9,698.50, with an average price of ₹9,614.75 for the day. Looking at its last 52-week, the stock has touched a low of ₹6,605.00 and a high of ₹10,126.00. On the performance front, Polycab India share price has increased by 22.45% over the last six months and is up 40.26% on a year-on-year basis.


₹9,531.00
0.90% down today
₹9,698.50
1D LOW
1D HIGH

Polycab India Returns Calculator

Open
₹9,688.00
High
₹9,698.50
Low
₹9,531.00
Prev. close
₹9,635.00

Circuit
L
H
₹8,594.00
₹10,503.00
52-week
L
H
₹6,605.00
₹10,126.00

Polycab India Shareholder Returns

Polycab India Share Price History

Mkt Cap Cr
1,45,107.00

P/E
38.55

P/B
8.58

ROE
24.81%

D/E
0.01

ROCE
34.08%

Div. Yield
0.69%

EPS(TTM)
172.81
Turnover
2.32

EV/EBITDA
24.13

Net Margin
9.23%

Op. Margin
14.46%

ROA
21.25%

Quick Ratio
1.15

Curr. Ratio
1.62
Based on fundamentals, this stock's
Step 2 of 5
Performance
Poor
Polycab India has underperformed the market
Step 3 of 5
Valuation
Fairly Valued
Polycab India appears to be fairly valued compared to its peers
Step 5 of 5
Earnings
Excellent
Polycab India revenue, operating profit and net profit are growing
Peer Comparison
Peer comparison — key ratios
NameMkt Cap CrP/EP/BROED/EROCEBook ValueDiv. YieldTurnoverEPS(TTM)
KEI Industries50,434.1054.917.5713.78%0.0418.46%697.170.09%1.7196.09
Sterlite Technologies28,893.80515.837.672.10%0.807.39%58.880.00%0.990.04
R R Kabel27,069.0029.805.7020.83%0.1327.25%5.720.73%3.5743.06
Finolex Cables17,300.5024.242.8411.73%0.0015.24%333.370.80%1.2140.73
DIAMOND POWER INFRA LTD11,069.0070.020.00-26.18%-4.0010.40%-11.660.00%1.062.80
Universal Cables4,247.5826.042.258.63%1.2810.83%264.190.37%2.1027.82
V MARC INDIA LIMITED3,810.360.000.000.00%4.4340.98
ADVAIT ENRGY TRANSITION L2,474.7144.948.9018.60%0.3624.32%238.740.09%1.4842.41
PARAMOUNT COMMUNICATIONS2,350.3339.252.707.68%0.1611.32%26.600.00%2.411.97
DYNAMIC CABLES LIMITED1,770.6813.832.5520.32%0.1226.52%2.550.21%2.5717.42

Polycab India Financials

Full statement

Income Statement · Consolidated

Income Statement · Consolidated — all values in INR Crore
ParticularsMar 2026Mar 2025Mar 2024Mar 2023
Revenue₹28,883.79₹22,408.31₹18,039.44₹14,107.78
Other Income₹236.25₹207.64₹220.88₹133.33
Total Revenue₹29,120.04₹22,615.95₹18,260.32₹14,241.10
Total Expenses₹25,506.97₹19,915.10₹15,901.02₹12,524.59
Profit Before Tax₹3,613.08₹2,700.85₹2,359.30₹1,707.26
Tax₹904.65₹655.31₹556.38₹424.17
Profit After Tax₹2,708.43₹2,045.54₹1,802.92₹1,283.09
EPS - Basic₹177.53₹134.34₹118.93₹84.93
EPS - Diluted₹176.95₹133.80₹118.49₹84.66

Cash Flow · Consolidated

Cash Flow · Consolidated — all values in INR Crore
ParticularsMar 2026Mar 2025Mar 2024Mar 2023
Profit before tax₹3,613.08₹2,700.85₹2,359.30₹1,707.26
Income before WC changes₹4,088.64₹3,051.63₹2,679.55₹1,889.68
Change in Assets-₹824.91-₹1,048.69-₹1,127.28-₹288.39
Change in Liabilities₹1,429.90₹438.75₹318.29₹196.66
Change in WC₹604.99-₹609.95-₹808.99-₹91.73
Cash flow from Operations₹3,810.67₹1,808.53₹1,296.24₹1,427.52
Cash flow from Investing-₹2,849.71-₹1,239.31-₹751.88-₹1,202.65
Cash flow from Financing-₹799.04-₹628.28-₹387.41-₹227.07
Total Cash Flow₹161.92-₹59.06₹156.95-₹2.20
Cash (Start of the year)₹217.39₹276.44₹119.49₹121.69
Cash (End of the year)₹379.31₹217.39₹276.44₹119.49

Balance Sheet · Consolidated

Balance Sheet · Consolidated — all values in INR Crore
ParticularsMar 2026Mar 2025Mar 2024Mar 2023
Non-Current Assets₹5,818.30₹4,456.77₹3,364.92₹2,516.73
Current Assets₹14,657.89₹9,319.00₹8,713.96₹6,908.75
Total Assets₹20,476.19₹13,775.77₹12,078.88₹9,425.48
Current Liabilities₹7,965.24₹3,510.15₹3,594.14₹2,620.49
Net Current Asset₹6,692.64₹5,808.85₹5,119.82₹4,288.26
Non-Current Liabilities₹384.18₹355.80₹241.40₹130.40
Equity Capital₹12,126.77₹9,909.82₹8,243.34₹6,674.58
Total Equity & Liabilities₹20,476.19₹13,775.77₹12,078.88₹9,425.48

Income Statement · Standalone

Income Statement · Standalone — all values in INR Crore
ParticularsMar 2026Mar 2025Mar 2024Mar 2023
Revenue₹28,185.18₹22,051.55₹18,050.85₹13,913.52
Other Income₹227.29₹207.40₹219.83₹135.79
Total Revenue₹28,412.47₹22,258.94₹18,270.68₹14,049.31
Total Expenses₹24,944.05₹19,638.97₹15,951.97₹12,364.27
Profit Before Tax₹3,468.42₹2,619.97₹2,318.71₹1,685.04
Tax₹867.47₹633.40₹549.04₹416.03
Profit After Tax₹2,600.95₹1,986.57₹1,769.67₹1,269.01
EPS - Basic₹172.81₹132.12₹117.97₹84.81
EPS - Diluted₹172.25₹131.58₹117.53₹84.54

Cash Flow · Standalone

Cash Flow · Standalone — all values in INR Crore
ParticularsMar 2026Mar 2025Mar 2024Mar 2023
Profit before tax₹3,468.42₹2,619.97₹2,318.71₹1,685.04
Income before WC changes₹3,932.25₹2,952.19₹2,637.99₹1,852.25
Change in Assets-₹710.45-₹978.93-₹1,091.84-₹230.70
Change in Liabilities₹1,377.55₹433.36₹301.08₹190.60
Change in WC₹667.10-₹545.57-₹790.76-₹40.10
Cash flow from Operations₹3,747.13₹1,803.48₹1,291.74₹1,451.78
Cash flow from Investing-₹2,819.67-₹1,161.15-₹762.31-₹1,187.59
Cash flow from Financing-₹775.58-₹666.56-₹396.29-₹256.04
Total Cash Flow₹151.89-₹24.23₹133.15₹8.15
Cash (Start of the year)₹200.33₹224.56₹122.00₹113.85
Cash (End of the year)₹352.21₹200.33₹255.14₹122.00

Balance Sheet · Standalone

Balance Sheet · Standalone — all values in INR Crore
ParticularsMar 2026Mar 2025Mar 2024Mar 2023
Non-Current Assets₹5,637.16₹4,280.67₹3,245.82₹2,487.02
Current Assets₹14,316.52₹9,097.92₹8,512.16₹6,739.54
Total Assets₹19,953.68₹13,378.59₹11,757.99₹9,226.55
Current Liabilities₹7,787.59₹3,360.12₹3,431.39₹2,496.48
Net Current Asset₹6,528.93₹5,737.80₹5,080.77₹4,243.06
Non-Current Liabilities₹321.89₹283.35₹182.18₹124.64
Equity Capital₹11,844.20₹9,735.12₹8,144.41₹6,605.43
Total Equity & Liabilities₹19,953.68₹13,378.59₹11,757.99₹9,226.55
* All values are in INR Crore
Qty
Bid
0
0
0
0
0
0
0
0
0
0
Ask
Qty
9548.5
1
0
0
0
0
0
0
0
0
Bid Total: 0
Ask Total: 1
Buy orders: 0%
Sell orders: 100%
Bearish
1
Neutral
3
Bullish
4
Slightly Bullish
by SEBI experts
Expert Pick
EXPPICK
Stop-loss
Entry price
Target
Indicator
Value
Verdict

RSI (14)
49.31
Neutral

ATR (14)
255.18
Neutral

STOCH(9,6)
18.14
Bullish

STOCH RSI (14)
0
Bullish

ADX(9)
16.96
Bullish

UO(9)
44.56
Neutral

ROC(12)
-0.45
Bearish

WillR(14)
-81.86
Bullish
Period
Simple value
Exponential vaue

5D
9727.4
9673.41

10D
9788.65
9713.88

20D
9708.6
9659.42

50D
9234.73
9233.64

100D
8451.45
8708.37

About Polycab India

Polycab India logo
ISIN
INE455K01017
Sector Market Cap
₹ 1,45,107 Cr

Polycab India Ltd is the country’s largest integrated manufacturer of wires and cables, and a prominent player in the fast-moving electrical goods (FMEG) industry.

The company’s 25 manufacturing facilities span five strategic locations in India -- Gujarat, Maharashtra, Uttarakhand, Tamil Nadu and the Union Territory of Daman. The company has also built a network of over 4,300 authorised distributors that have established presence through more than 2 lakh retail outlets across the country.

Polycab’s journey began in 1964 when Thakurdas Jaisinghani established Sind Electric Stores that dealt in various electrical products. The family business was managed from 1968 by his sons Girdhari, Inder, Ajay and Ramesh.

In 1975, the family founded a partnership firm in the name of Thakur Industries. In 1983, a firm named Polycab Industries was founded by Jaisinghani brothers and was registered as a small-scale industrial unit. They had a factory at Halol, Gujarat, for manufacturing PVC insulated wires, cables copper and aluminium and bare copper wires.

In 1996, it was incorporated as Polycab Wires Pvt. Ltd at Mumbai as a private limited company. In 2018, the company was converted into a public limited company and the word private was struck off from its name.

In 2019, Polycab India Ltd listed on NSE and BSE after a successful ₹1,345 crore initial public offering (IPO) being subscribed 52 times. Polycab share price has surged over 428% in the last three years. The company's market capitalisation stood at over ₹82,500 crore as of December 20, 2023.

Business segments

Polycab India operates in two major segments -- wires and cables (which contributed 89% to external sales in FY23) and fast moving electrical goods (contributed 9% to FY23 sales). Besides that, the company operates some other international businesses in the same space.

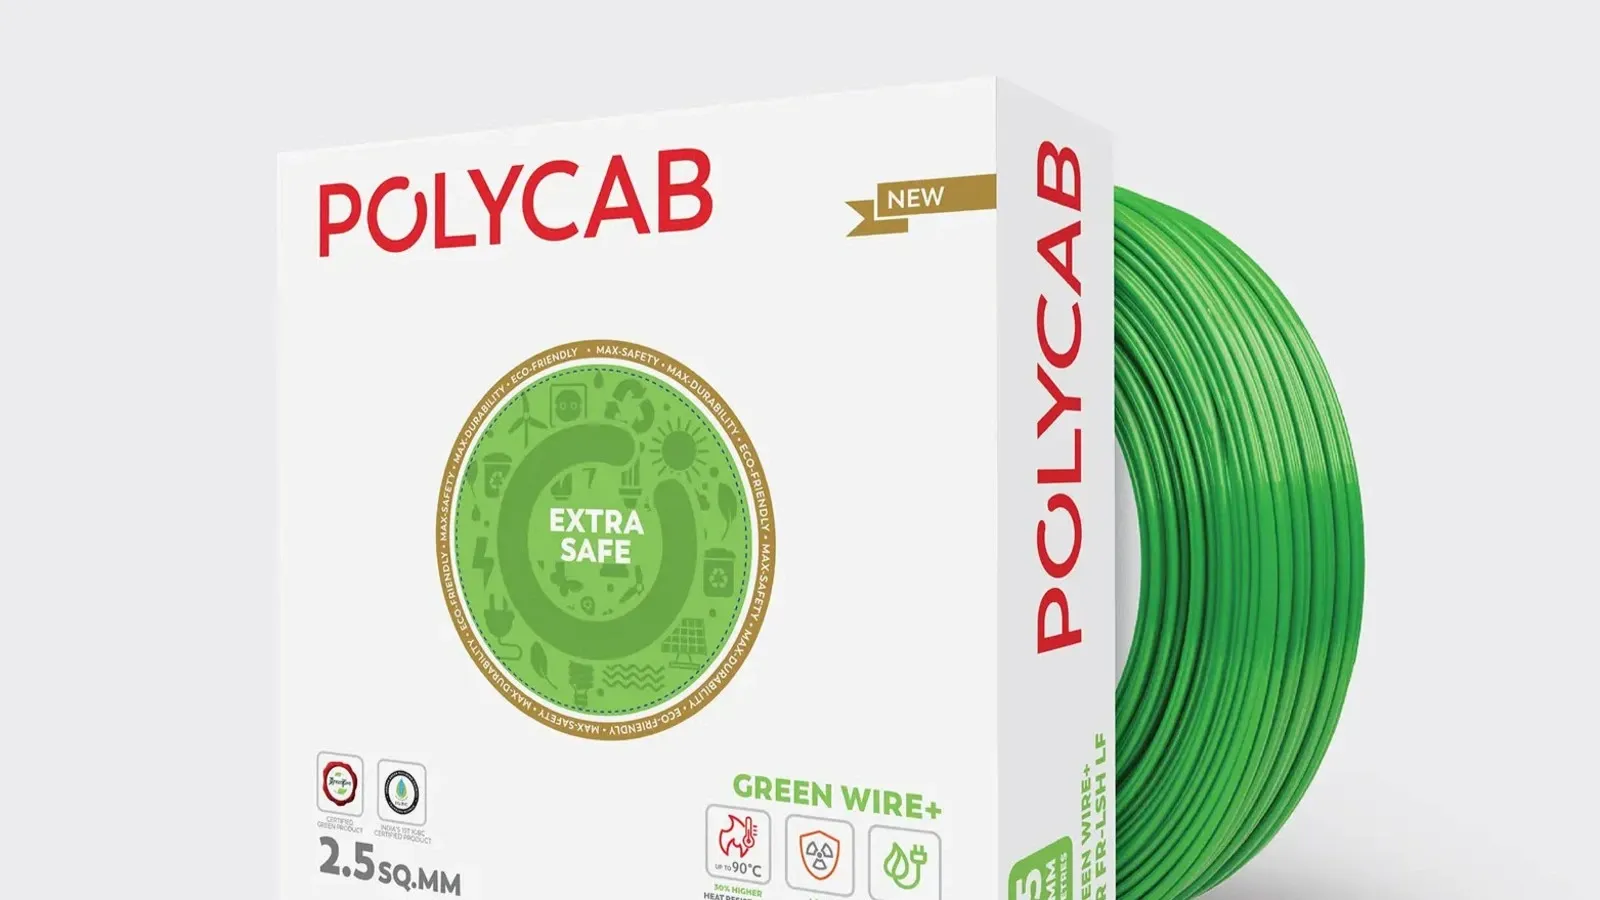
Wires and Cables (W&C):

Polycab is India’s dominant manufacturer and seller of a varied range of wires and cables for retail and industrial use, catering to a diverse customer base across a wide range of industries.

FMEG:

The company’s FMEG business, which began in 2013-14, is a high-growth segment. It features a growing product mix across different price points that caters to the complete spectrum of customers. The company is present in segments such as fans, lighting luminaires, switches, switchgears, water heaters, pipes and agro pumps.

International Business:

Polycab’s international business delivers superior electrical products and solutions, tailored to meet the ever-changing demands of its customers.

Polycab India Financial Highlights

  • Revenue: Polycab India reported revenue of ₹29,120.04 crore in FY26 vs ₹22,615.95 crore in FY25. It showed an increase of 28.76% on a yearly basis.
  • Operating Profit: Polycab India reported an operating profit of ₹3,613.08 crore in FY26 vs ₹2,700.85 crore in FY25. It showed an increase of 33.78% on a year-on-year basis.
  • Net Profit: Polycab India reported a net profit of ₹2,708.43 crore in FY26 vs ₹2,045.54 crore in FY25. It showed an increase of 32.41% on a yearly basis.

Polycab India Quarterly Result Highlights

  • Polycab India reported revenue of ₹8,924.90 crore in Mar 2026, compared with ₹7,686.59 crore in Dec 2025, representing an increase of 16.11% on a quarter-on-quarter (QoQ) basis.
  • Polycab India reported an operating profit of ₹1,049.29 crore in Mar 2026, compared with ₹842.20 crore in Dec 2025, representing an increase of 24.59% on a quarter-on-quarter (QoQ) basis.
  • Polycab India reported a profit of ₹785.60 crore in Mar 2026, compared with ₹630.17 crore in Dec 2025, reflecting an increase of 24.66% on a QoQ basis.
  • The earnings per share (EPS) of Polycab India stood at ₹177.53 during Mar 2026.
Know more
Promoters
61.50%
FII
18.21%
Other DII
2.73%
Retail and other
12.34%
Mutual funds
5.23%
Foreign institutions - FII
Compare against other stocks
Polycab India logo
Polycab India
Cable
Add Stock
Add Another

FAQs on Polycab India Share Price