Logo

Varun Beverages Share Price

NSE: VBL
|
Consumer Food
₹ 515.80
+₹5.15 (1.01%)
1D
Last updated 03 Jul, 2026, 15:59 IST

Varun Beverages Share Price Today

As of 5 Jul 2026, Varun Beverages share price is ₹515.80. The stock opened at ₹517.50, compared to its previous close of ₹510.65. During today's trading session, Varun Beverages share price moved in the range of ₹512.75 to ₹522.40, with an average price of ₹517.58 for the day. Looking at its last 52-week, the stock has touched a low of ₹381.00 and a high of ₹555.80. On the performance front, Varun Beverages share price has increased by 4.46% over the last six months and is up 14.44% on a year-on-year basis.


₹512.75
1.01% up today
₹522.40
1D LOW
1D HIGH

Varun Beverages Returns Calculator

Open
₹517.50
High
₹522.40
Low
₹512.75
Prev. close
₹510.65

Circuit
L
H
₹464.25
₹567.35
52-week
L
H
₹381.00
₹555.80

Varun Beverages Shareholder Returns

Varun Beverages Share Price History

Mkt Cap Cr
1,72,641.00

P/E
52.65

P/B
8.59

ROE
15.51%

D/E
0.02

ROCE
19.85%

Div. Yield
0.21%

EPS(TTM)
7.91
Turnover
0.68

EV/EBITDA
30.02

Net Margin
18.39%

Op. Margin
29.39%

ROA
12.13%

Quick Ratio
2.69

Curr. Ratio
2.66
Based on fundamentals, this stock's
Step 1 of 5
Performance
Very Poor
Varun Beverages has not beaten FD return of 7%
Step 1 of 5
Valuation
Overvalued
Varun Beverages appears overvalued compared to its peers
Step 5 of 5
Earnings
Excellent
Varun Beverages revenue, operating profit and net profit are growing
Peer Comparison
Peer comparison — key ratios
NameMkt Cap CrP/EP/BROED/EROCEBook ValueDiv. YieldTurnoverEPS(TTM)
Hindustan Unilever5,19,424.0032.129.9131.07%0.0325.43%9.811.99%0.9765.66
Nestle India2,78,882.0064.7343.9376.34%0.1756.47%42.671.02%2.6818.38
Britannia Industries1,29,450.0051.0225.3549.61%0.2951.85%192.691.68%3.62106.35
Marico1,11,174.0061.3426.4141.85%0.0340.56%44.730.47%1.5915.00
Godrej Consumer Products1,10,234.0059.228.7114.71%0.3817.09%76.661.86%1.0914.81
LENSKART SOLUTIONS LTD92,343.50184.4110.575.65%0.207.00%52.450.00%0.492.80
Dabur India79,251.3042.436.9416.59%0.0820.18%42.431.85%1.208.41
Colgate Palmolive9,183.4023.6827.81158.62%0.03179.72%58.242.33%3.5948.73
PATANJALI FOODS LIMITED45,064.0024.833.4415.37%0.2110.59%120.370.84%3.0516.69
P&G Hygiene & Health28,858.2033.6938.30113.67%0.00155.91%232.122.87%4.93263.86

Varun Beverages Financials

Full statement

Income Statement · Consolidated

Income Statement · Consolidated — all values in INR Crore
ParticularsDec 2025Dec 2024Dec 2023Dec 2022
Revenue₹21,685.38₹20,007.65₹16,042.58₹13,173.14
Other Income₹352.35₹121.27₹79.36₹38.85
Total Revenue₹22,037.73₹20,128.92₹16,121.94₹13,211.99
Total Expenses₹18,022.05₹16,694.35₹13,382.10₹11,188.35
Profit Before Tax₹4,009.65₹3,433.09₹2,739.36₹2,023.64
Tax₹947.61₹798.80₹637.55₹473.52
Profit After Tax₹3,062.04₹2,634.29₹2,101.81₹1,550.11
EPS - Basic₹8.98₹7.95₹15.83₹11.53
EPS - Diluted₹8.98₹7.94₹15.82₹11.52

Cash Flow · Consolidated

Cash Flow · Consolidated — all values in INR Crore
ParticularsDec 2025Dec 2024Dec 2023Dec 2022
Profit before tax₹4,015.68₹3,434.57₹2,739.84₹2,023.64
Income before WC changes₹4,968.52₹4,778.05₹3,732.20₹2,748.55
Change in Assets-₹47.25-₹1,134.42-₹690.41-₹1,005.93
Change in Liabilities-₹523.81₹465.03₹16.93₹420.73
Change in WC-₹571.05-₹669.39-₹673.48-₹585.19
Cash flow from Operations₹3,509.31₹3,381.10₹2,390.78₹1,790.03
Cash flow from Investing-₹2,734.94-₹4,316.78-₹3,289.87-₹1,704.60
Cash flow from Financing-₹1,266.47₹2,953.54₹984.90-₹17.94
Total Cash Flow-₹492.09₹2,017.85₹85.81₹67.49
Cash (Start of the year)₹2,266.28₹242.21₹154.33₹150.75
Cash (End of the year)₹1,784.18₹2,266.28₹242.21₹154.33

Balance Sheet · Consolidated

Balance Sheet · Consolidated — all values in INR Crore
ParticularsDec 2025Dec 2024Dec 2023Dec 2022
Non-Current Assets₹17,675.75₹15,279.94₹10,951.55₹8,214.21
Current Assets₹7,889.40₹7,863.97₹4,235.63₹3,404.03
Total Assets₹25,565.16₹23,143.91₹15,187.18₹11,618.24
Current Liabilities₹4,073.95₹4,524.43₹4,153.21₹3,968.75
Net Current Asset₹3,815.46₹3,339.55₹82.42-₹564.72
Non-Current Liabilities₹1,750.26₹1,879.85₹3,949.32₹2,434.00
Equity Capital₹19,740.96₹16,739.64₹7,084.65₹5,215.49
Total Equity & Liabilities₹25,565.16₹23,143.91₹15,187.18₹11,618.24

Income Statement · Standalone

Income Statement · Standalone — all values in INR Crore
ParticularsDec 2025Dec 2024Dec 2023Dec 2022
Revenue₹14,556.82₹14,348.60₹12,632.83₹10,595.83
Other Income₹513.93₹353.94₹146.14₹143.76
Total Revenue₹15,070.76₹14,702.54₹12,778.97₹10,739.58
Total Expenses₹11,527.51₹11,632.60₹10,410.81₹9,055.08
Profit Before Tax₹3,543.25₹3,069.94₹2,368.16₹1,684.50
Tax₹866.60₹749.58₹593.04₹414.30
Profit After Tax₹2,676.64₹2,320.36₹1,775.13₹1,270.20
EPS - Basic₹7.91₹7.11₹5.46₹9.78
EPS - Diluted₹7.91₹7.11₹5.46₹9.77

Cash Flow · Standalone

Cash Flow · Standalone — all values in INR Crore
ParticularsDec 2025Dec 2024Dec 2023Dec 2022
Profit before tax₹3,543.25₹3,069.94₹2,368.16₹1,684.50
Income before WC changes₹3,789.90₹3,818.62₹3,074.96₹2,259.02
Change in Assets-₹257.16-₹231.56-₹488.84-₹644.92
Change in Liabilities-₹147.98₹42.39-₹2.42₹277.53
Change in WC-₹405.13-₹189.17-₹491.26-₹367.39
Cash flow from Operations₹2,576.99₹2,966.94₹1,952.88₹1,558.79
Cash flow from Investing-₹2,056.89-₹3,687.09-₹2,769.57-₹1,509.31
Cash flow from Financing-₹979.39₹2,728.75₹818.78-₹26.23
Total Cash Flow-₹459.29₹2,008.60₹2.09₹23.24
Cash (Start of the year)₹2,058.08₹49.48₹47.39₹24.15
Cash (End of the year)₹1,598.79₹2,058.08₹49.48₹47.39

Balance Sheet · Standalone

Balance Sheet · Standalone — all values in INR Crore
ParticularsDec 2025Dec 2024Dec 2023Dec 2022
Non-Current Assets₹15,901.24₹14,145.93₹11,074.33₹8,617.05
Current Assets₹5,099.03₹5,338.05₹2,935.13₹2,451.90
Total Assets₹21,000.27₹19,483.97₹14,009.46₹11,068.94
Current Liabilities₹1,277.14₹2,173.32₹3,292.94₹3,268.31
Net Current Asset₹3,821.89₹3,164.73-₹357.81-₹816.41
Non-Current Liabilities₹958.34₹751.95₹3,640.71₹2,283.24
Equity Capital₹18,764.80₹16,558.71₹7,075.80₹5,517.40
Total Equity & Liabilities₹21,000.27₹19,483.97₹14,009.46₹11,068.94
* All values are in INR Crore
Qty
Bid
525
515.8
0
0
0
0
0
0
0
0
Ask
Qty
0
0
0
0
0
0
0
0
0
0
Bid Total: 525
Ask Total: 0
Buy orders: 100%
Sell orders: 0%
Bearish
1
Neutral
6
Bullish
1
Neutral
by SEBI experts
Expert Pick
EXPPICK
Stop-loss
Entry price
Target
Indicator
Value
Verdict

RSI (14)
49.66
Neutral

ATR (14)
13.51
Neutral

STOCH(9,6)
48.64
Neutral

STOCH RSI (14)
36.17
Neutral

ADX(9)
18.96
Bullish

UO(9)
37.53
Neutral

ROC(12)
-4.67
Bearish

WillR(14)
-74.84
Neutral
Period
Simple value
Exponential vaue

5D
510.76
512.62

10D
511.49
514.24

20D
520.8
517.02

50D
516.86
507.64

100D
475.21
491.88

About Varun Beverages

Varun Beverages logo
ISIN
INE200M01039
Sector Market Cap
₹ 1,72,641 Cr

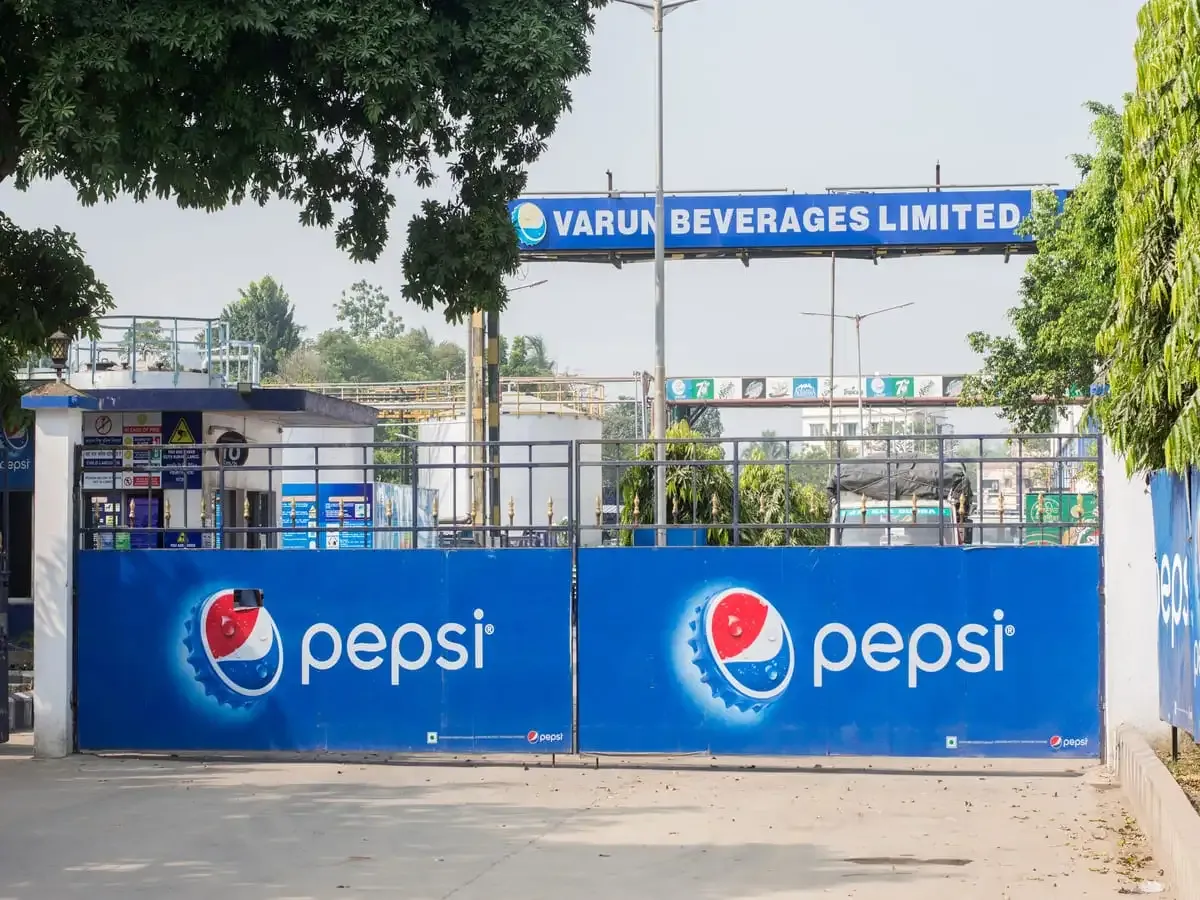
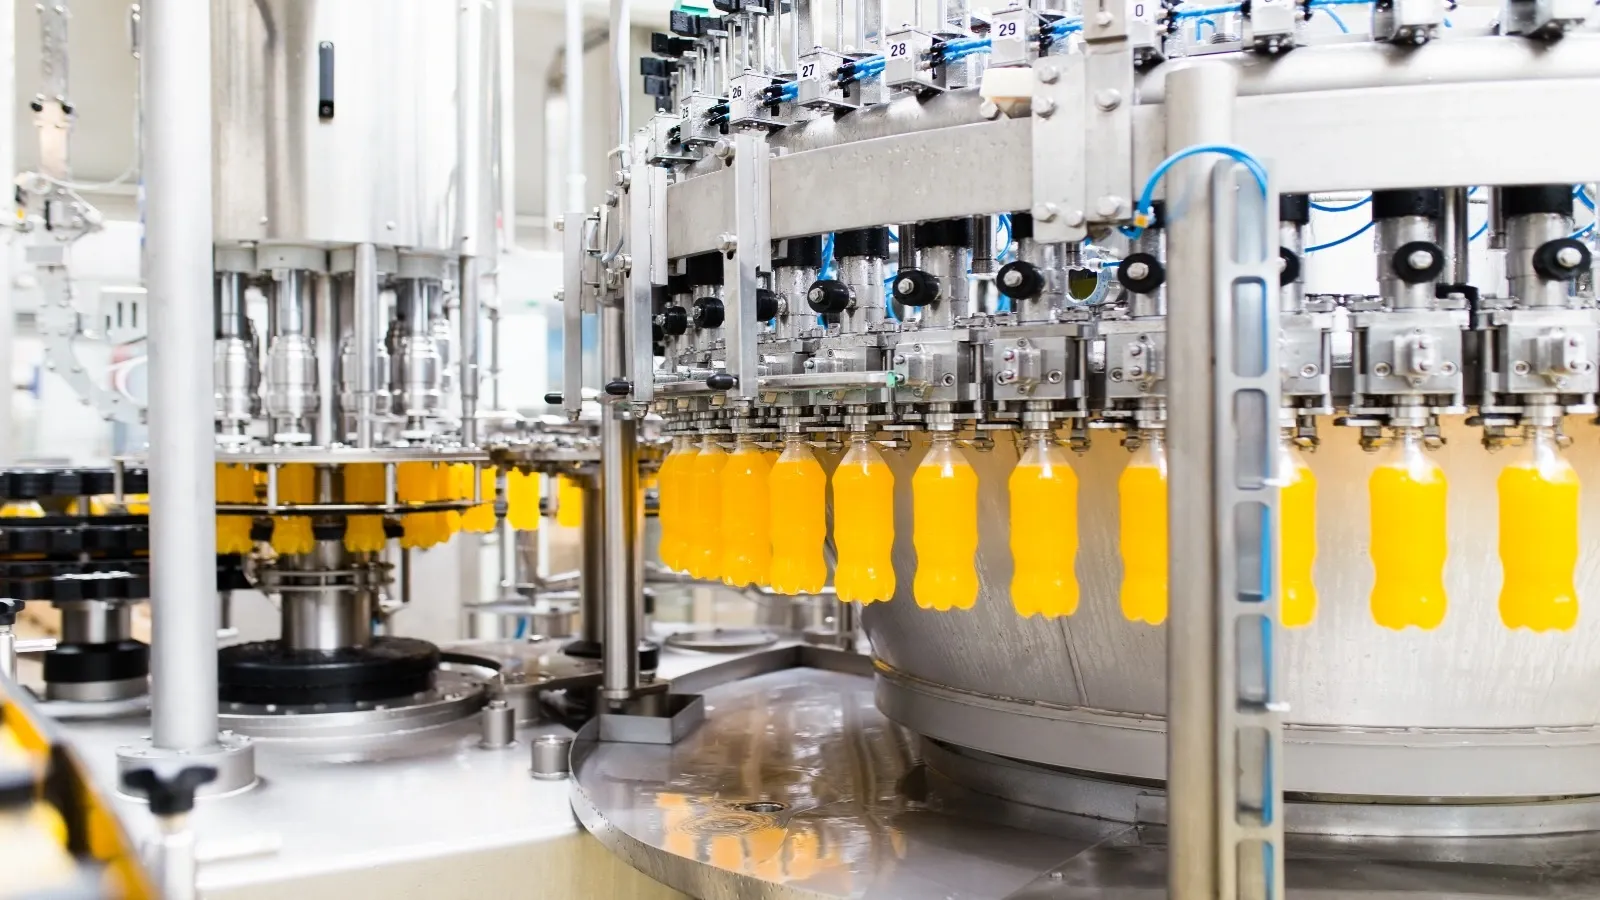
Varun Beverages Limited is an India-based company, which is a franchisee of PepsiCo. It produces and distributes a range of carbonated soft drinks (CSDs), as well as non-carbonated beverages (NCBs), including packaged drinking water sold under trademarks owned by PepsiCo. PepsiCo CSD brands produced and sold by the Company include Pepsi, Pepsi Black, Mountain Dew, Sting, Seven-Up, Mirinda Orange, Seven-Up Nimbooz Masala Soda and Evervess. PepsiCo NCB brands produced and sold by it include Tropicana Slice, Tropicana Juices (100% and Delight), Seven-Up Nimbooz, Gatorade as well as packaged drinking water under the brand Aquafina. It is also engaged in co-manufacturing of Kurkure puffcorn in India. It has approximately 36 manufacturing plants in India and over 12 manufacturing plants in international geographies. Its subsidiaries include Varun Beverages (Nepal) Private Limited, The Beverage Company Proprietary Limited, and Varun Beverages Lanka (Private) Limited, and others.

Varun Beverages Financial Highlights

  • Revenue: Varun Beverages reported revenue of ₹22,037.73 crore in FY25 vs ₹20,128.92 crore in FY24. It showed an increase of 9.48% on a yearly basis.
  • Operating Profit: Varun Beverages reported an operating profit of ₹4,009.65 crore in FY25 vs ₹3,433.09 crore in FY24. It showed an increase of 16.79% on a year-on-year basis.
  • Net Profit: Varun Beverages reported a net profit of ₹3,062.04 crore in FY25 vs ₹2,634.29 crore in FY24. It showed an increase of 16.24% on a yearly basis.

Varun Beverages Quarterly Result Highlights

  • Varun Beverages reported revenue of ₹6,617.72 crore in Mar 2026, compared with ₹4,303.53 crore in Dec 2025, representing an increase of 53.77% on a quarter-on-quarter (QoQ) basis.
  • Varun Beverages reported an operating profit of ₹1,163.19 crore in Mar 2026, compared with ₹358.89 crore in Dec 2025, representing an increase of 224.11% on a quarter-on-quarter (QoQ) basis.
  • Varun Beverages reported a profit of ₹878.71 crore in Mar 2026, compared with ₹260.00 crore in Dec 2025, reflecting an increase of 237.97% on a QoQ basis.
  • The earnings per share (EPS) of Varun Beverages stood at ₹8.98 during Mar 2026.
Know more
Promoters
59.44%
FII
19.51%
Other DII
6.10%
Retail and other
6.65%
Mutual funds
8.30%
Foreign institutions - FII
Compare against other stocks
Varun Beverages logo
Varun Beverages
Consumer Food
Add Stock
Add Another

FAQs on Varun Beverages Share Price