Titan Company Limited – Company Overview
‘Titan’ is India's leading lifestyle brand and one of the most trusted names in the Indian household for its consumer goods. Titan Company Limited, part of the prestigious Tata Group. The company started its business in watches, then ventured into jewellery under the name ‘Tanishq’, eyewear under the name ‘Titan Eye+’ and fashion accessories.
Titan plays an important role in India's organised retail and consumer discretionary sector. It has a robust presence in the retail sector through physical stores and e-commerce.
Titan has grown to become one of the world's largest watch manufacturers by volume and India's trusted jewellery retailer through its flagship brand Tanishq. The company operates over 1200+ Titan Watch stores, 500+ Tanishq jewellery stores and 860+ Titan Eyeplus optical stores.
Given India's growing consumption story and rising disposable incomes, Titan Company stock is widely tracked by retail and institutional investors alike.
Titan Company Limited – Company Details
- Founded- 1984
- Headquarters- Bangalore, Karnataka, India
- NSE Symbol- TITAN
- ISIN- INE280A01028
- BSE Code - 500114
- Sector- Consumer Discretionary
- Industry- Lifestyle & Retail
Core Business Segments
- Watches- Titan, by volume, is one of the largest watch manufacturers in the world. It manufactures and sells watches under brands like Titan, Fastrack, Sonata and a few partnerships, like Tommy Hilfiger. It has grown its product portfolio to cater to almost every demography in India.
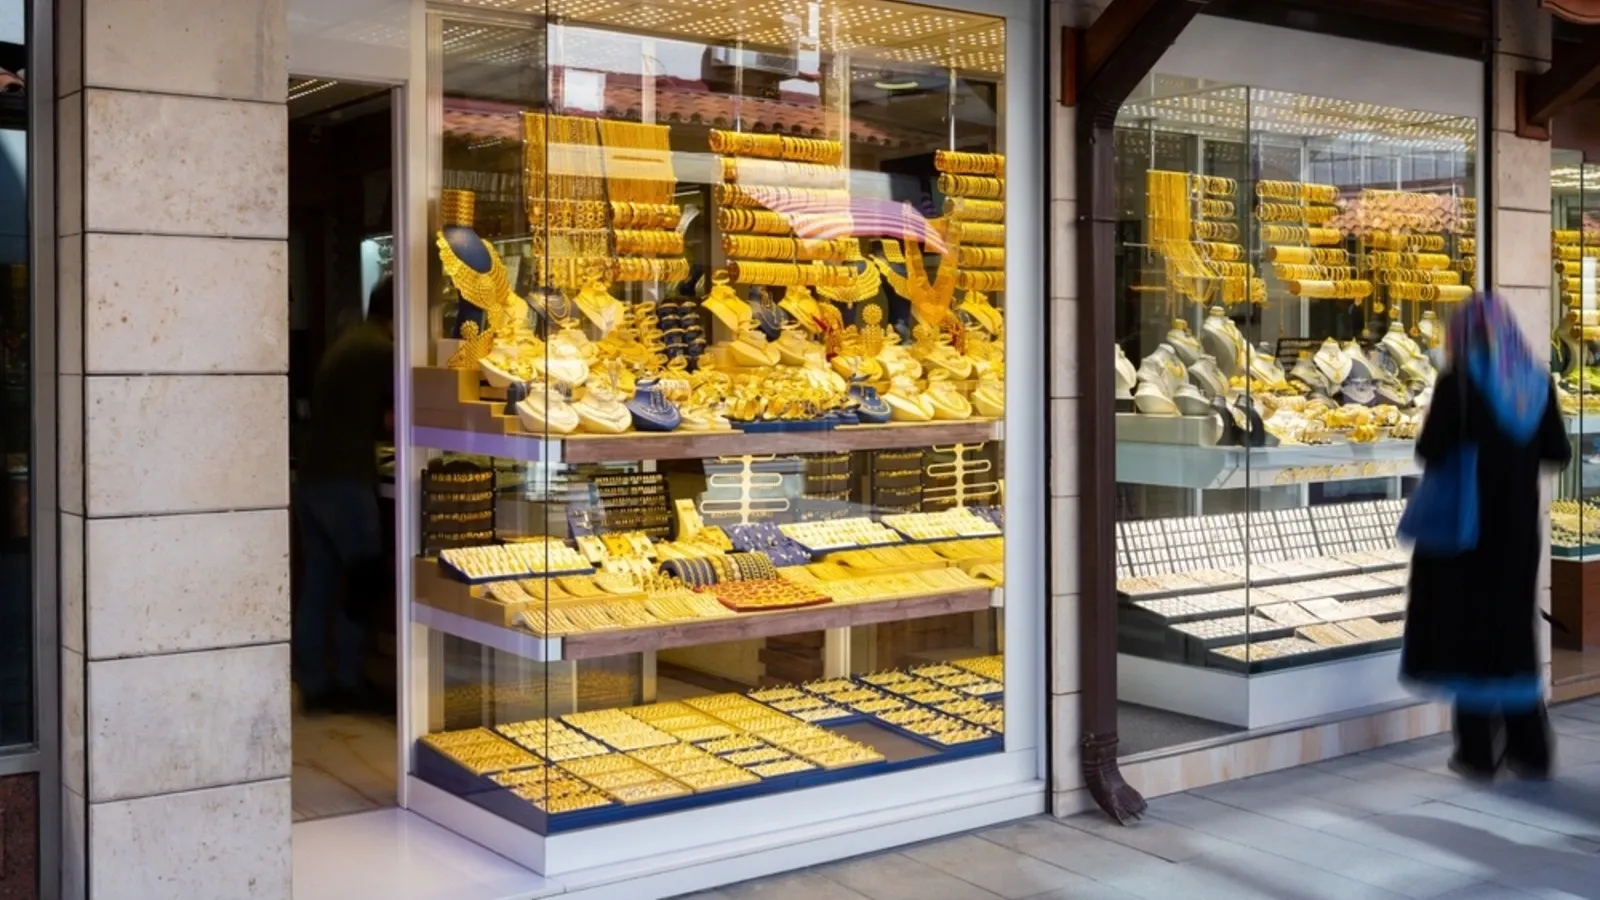
- Jewellery - It's jewellery arm ‘Tanishq’ designs, manufactures and sells gold, diamond and studded jewellery. Tanishq has grown to be one of the reputed names in the organised jewellery market of India.
- Eyewear - Titan Eyeplus sells glasses, sunglasses and contact lenses. It has a presence both offline through physical stores and online as well.
- Accessories and Fashion- Titan owns CaratLane (it sells jewellery both online and through stores), Taneira (ethnic wear, especially sarees), fragrances and other accessories.
Titan Company Latest News & Corporate Actions
Corporate Developments
- Store Expansion- Titan Company and all its allied brands like Tanishq, Titan Eyeplus, CaratLane and Taneira continue aggressive retail expansion with new store openings across tier 2 and tier 3 cities.
- Digital Innovation- The company is investing heavily in digital transformation, including augmented reality try-ons, personalised jewellery design platforms and enhanced e-commerce capabilities through Tanishq and CaratLane.
Major Launches and Strategic Initiatives
- Lab-Grown Diamonds- In 2025, Tanishq launched its lab-grown diamond jewellery collection, catering to the growing demand for sustainable and affordable luxury.
- CaratLane Expansion- CaratLane is rapidly expanding its physical store network and at the same time, maintaining strong online growth. It's targeting millennial and Gen-Z consumers largely
- Smart Wearables- Understanding the growing demand for wearables, Titan has entered the smart watch and fitness tracker segment.
Market Reaction and Stock Highlights
- Titan shares have consistently outperformed the main market indices over long periods. It is a favourite blue-chip stock for investors who focus on quality
- The stock usually sees increased activity during festive seasons (Diwali, Akshaya Tritiya) when jewellery demand peaks. Its quarterly results are watched closely by market participants.
- Given its strong brand reputation, execution capabilities and India's consumption growth potential, analysts by and large have positive ratings for the stock.
Other Corporate Actions
- Same-Store Sales Growth (SSSG)- The company continues to report healthy SSSG across its brands,like CaratLane selling Tanishq, Its watch stores selling fragrance and accessories. This indicates a strong brand pull and customer loyalty.
- Export Initiatives- Titan is also exploring international markets, particularly in the Middle East and Southeast Asia, to diversify revenue streams.
- Sustainability Initiatives- The company is implementing ESG (environmental, social, governance) practices across its supply chain, including responsible sourcing and recycling programs. It also continuously strives to build a positive work environment through employee well-being initiatives and ensuring that its board is diverse.
Source – NSE website, BSE announcements and company investor presentations
Titan Company Financial Highlights
- Revenue: Titan Company reported revenue of ₹88,136.00 crore in FY26 vs ₹60,942.00 crore in FY25. It showed an increase of 44.62% on a yearly basis.
- Operating Profit: Titan Company reported an operating profit of ₹6,801.00 crore in FY26 vs ₹4,535.00 crore in FY25. It showed an increase of 49.97% on a year-on-year basis.
- Net Profit: Titan Company reported a net profit of ₹5,073.00 crore in FY26 vs ₹3,337.00 crore in FY25. It showed an increase of 52.02% on a yearly basis.
Titan Company Quarterly Result Highlights
- Titan Company reported revenue of ₹27,104.00 crore in Mar 2026, compared with ₹25,567.00 crore in Dec 2025, representing an increase of 6.01% on a quarter-on-quarter (QoQ) basis.
- Titan Company reported an operating profit of ₹1,577.00 crore in Mar 2026, compared with ₹2,223.00 crore in Dec 2025, representing a decrease of 29.06% on a quarter-on-quarter (QoQ) basis.
- Titan Company reported a profit of ₹1,179.00 crore in Mar 2026, compared with ₹1,684.00 crore in Dec 2025, reflecting a decrease of 29.99% on a QoQ basis.
- The earnings per share (EPS) of Titan Company stood at ₹57.19 during Mar 2026.