As of 7 Jul 2026, BHEL share price is ₹376.45. The stock opened at ₹389.70, compared to its previous close of ₹387.50. During today's trading session, BHEL share price moved in the range of ₹375.00 to ₹389.70, with an average price of ₹382.35 for the day. Looking at its last 52-week, the stock has touched a low of ₹205.12 and a high of ₹424.90. On the performance front, BHEL share price has increased by 24.02% over the last six months and is up 46.85% on a year-on-year basis.
| Name | Mkt Cap Cr | P/E | P/B | ROE | D/E | ROCE | Book Value | Div. Yield | Turnover | EPS(TTM) |
|---|---|---|---|---|---|---|---|---|---|---|
| ABB India | 1,49,821.00 | 70.66 | 47.90 | 22.38% | 0.01 | 29.83% | 339.50 | 0.75% | 1.01 | 78.73 |
| CG Power | 1,45,709.00 | 85.59 | 12.95 | 20.29% | 0.01 | 27.01% | 12.57 | 0.20% | 1.35 | 8.42 |
| Hitachi Energy India | 1,44,221.00 | 145.99 | 27.86 | 19.09% | 0.02 | 24.84% | 1,161.25 | 0.02% | 1.48 | 221.63 |
| Siemens | 1,27,153.00 | 46.17 | 9.19 | 17.15% | 0.02 | 22.11% | 379.80 | 0.50% | 1.54 | 71.49 |
| GE T&D India | 7,758.80 | 43.21 | 7.74 | 18.64% | 0.01 | 20.90% | 105.07 | 0.22% | 2.18 | 48.16 |
| WAAREE ENERGIES LIMITED | 82,731.40 | 21.30 | 5.73 | 25.71% | 0.15 | 29.30% | 456.44 | 0.07% | 1.48 | 130.88 |
| Suzlon | 75,606.10 | 23.91 | 8.00 | 33.43% | 0.03 | 27.06% | 7.20 | 0.00% | 1.38 | 3.00 |
| Apar Industries | 57,569.50 | 58.93 | 10.67 | 18.11% | 0.18 | 27.50% | 1,284.87 | 0.42% | 3.83 | 242.46 |
| Thermax | 56,406.80 | 78.31 | 10.16 | 12.98% | 0.03 | 14.29% | 371.54 | 0.42% | 1.45 | 54.46 |
| Schneider Electric Infra | 35,900.90 | 168.90 | 46.36 | 27.45% | 0.71 | 25.88% | 32.39 | 0.00% | 2.11 | 8.89 |
| Particulars | Mar 2025 | Mar 2024 | Mar 2023 | Mar 2022 |
|---|---|---|---|---|
| Revenue | ₹28,339.48 | ₹23,892.78 | ₹23,364.94 | ₹21,211.09 |
| Other Income | ₹465.31 | ₹546.27 | ₹488.63 | ₹354.54 |
| Total Revenue | ₹28,804.79 | ₹24,439.05 | ₹23,853.57 | ₹21,565.63 |
| Total Expenses | ₹28,118.20 | ₹24,260.37 | ₹23,193.98 | ₹21,145.59 |
| Profit Before Tax | ₹745.60 | ₹242.66 | ₹715.61 | ₹470.46 |
| Tax | ₹211.70 | -₹39.56 | ₹61.49 | ₹25.75 |
| Profit After Tax | ₹533.90 | ₹282.22 | ₹654.12 | ₹444.71 |
| EPS - Basic | ₹1.53 | ₹0.81 | ₹1.88 | ₹1.28 |
| EPS - Diluted | ₹1.53 | ₹0.81 | ₹1.88 | ₹1.28 |
| Particulars | Mar 2025 | Mar 2024 | Mar 2023 | Mar 2022 |
|---|---|---|---|---|
| Profit before tax | ₹745.60 | ₹242.66 | ₹715.61 | ₹470.46 |
| Income before WC changes | ₹381.13 | -₹490.46 | -₹54.49 | -₹343.36 |
| Change in Assets | -₹7,044.71 | -₹3,723.20 | -₹2,677.80 | ₹33.86 |
| Change in Liabilities | ₹8,774.18 | ₹278.59 | ₹1,881.17 | ₹560.87 |
| Change in WC | ₹1,729.47 | -₹3,444.61 | -₹796.63 | ₹594.73 |
| Cash flow from Operations | ₹2,191.89 | -₹3,712.90 | -₹740.70 | ₹660.25 |
| Cash flow from Investing | -₹2,730.91 | ₹1,330.86 | ₹1,480.46 | -₹1,125.32 |
| Cash flow from Financing | -₹856.81 | ₹2,655.74 | ₹88.96 | -₹329.49 |
| Total Cash Flow | -₹1,395.83 | ₹273.70 | ₹828.72 | -₹794.56 |
| Cash (Start of the year) | ₹1,835.04 | ₹1,561.34 | ₹732.62 | ₹1,519.90 |
| Cash (End of the year) | ₹439.21 | ₹1,835.04 | ₹1,561.34 | ₹732.62 |
| Particulars | Mar 2025 | Mar 2024 | Mar 2023 | Mar 2022 |
|---|---|---|---|---|
| Non-Current Assets | ₹25,323.41 | ₹24,459.81 | ₹27,825.52 | ₹28,381.78 |
| Current Assets | ₹42,759.77 | ₹34,542.11 | ₹29,094.50 | ₹27,861.98 |
| Total Assets | ₹68,083.18 | ₹59,001.92 | ₹56,920.02 | ₹56,243.76 |
| Current Liabilities | ₹28,225.59 | ₹25,247.24 | ₹23,479.55 | ₹21,371.15 |
| Net Current Asset | ₹14,534.18 | ₹9,294.87 | ₹5,614.95 | ₹6,490.83 |
| Non-Current Liabilities | ₹15,135.43 | ₹9,316.03 | ₹9,062.21 | ₹8,366.01 |
| Equity Capital | ₹24,722.16 | ₹24,438.65 | ₹24,378.26 | ₹26,506.60 |
| Total Equity & Liabilities | ₹68,083.18 | ₹59,001.92 | ₹56,920.02 | ₹56,243.76 |
| Particulars | Mar 2025 | Mar 2024 | Mar 2023 | Mar 2022 |
|---|---|---|---|---|
| Revenue | ₹28,339.48 | ₹23,892.78 | ₹23,364.94 | ₹21,211.09 |
| Other Income | ₹503.39 | ₹587.92 | ₹514.81 | ₹367.81 |
| Total Revenue | ₹28,842.87 | ₹24,480.70 | ₹23,879.75 | ₹21,578.90 |
| Total Expenses | ₹28,118.20 | ₹24,260.37 | ₹23,193.98 | ₹21,141.95 |
| Profit Before Tax | ₹724.67 | ₹220.33 | ₹685.77 | ₹436.95 |
| Tax | ₹211.70 | -₹39.56 | ₹61.49 | ₹26.71 |
| Profit After Tax | ₹512.97 | ₹259.89 | ₹624.28 | ₹410.24 |
| EPS - Basic | ₹1.47 | ₹0.75 | ₹1.79 | ₹1.18 |
| EPS - Diluted | ₹1.47 | ₹0.75 | ₹1.79 | ₹1.18 |
| Particulars | Mar 2025 | Mar 2024 | Mar 2023 | Mar 2022 |
|---|---|---|---|---|
| Profit before tax | ₹724.67 | ₹220.33 | ₹685.77 | ₹436.95 |
| Income before WC changes | ₹381.13 | -₹490.46 | -₹54.49 | -₹341.02 |
| Change in Assets | -₹7,044.71 | -₹3,723.20 | -₹2,677.80 | ₹33.86 |
| Change in Liabilities | ₹8,774.19 | ₹278.59 | ₹1,881.17 | ₹558.55 |
| Change in WC | ₹1,729.48 | -₹3,444.61 | -₹796.63 | ₹592.41 |
| Cash flow from Operations | ₹2,191.90 | -₹3,712.90 | -₹740.70 | ₹660.27 |
| Cash flow from Investing | -₹2,730.91 | ₹1,330.86 | ₹1,480.46 | -₹1,125.33 |
| Cash flow from Financing | -₹856.82 | ₹2,655.74 | ₹88.96 | -₹329.50 |
| Total Cash Flow | -₹1,395.83 | ₹273.70 | ₹828.72 | -₹794.56 |
| Cash (Start of the year) | ₹1,835.04 | ₹1,561.34 | ₹732.62 | ₹1,527.18 |
| Cash (End of the year) | ₹439.21 | ₹1,835.04 | ₹1,561.34 | ₹732.62 |
| Particulars | Mar 2025 | Mar 2024 | Mar 2023 | Mar 2022 |
|---|---|---|---|---|
| Non-Current Assets | ₹25,719.55 | ₹24,871.74 | ₹28,259.64 | ₹28,846.34 |
| Current Assets | ₹42,759.77 | ₹34,542.12 | ₹29,094.50 | ₹27,861.98 |
| Total Assets | ₹68,479.32 | ₹59,413.86 | ₹57,354.14 | ₹56,708.32 |
| Current Liabilities | ₹28,230.88 | ₹25,247.24 | ₹23,479.55 | ₹21,371.15 |
| Net Current Asset | ₹14,528.89 | ₹9,294.88 | ₹5,614.95 | ₹6,490.83 |
| Non-Current Liabilities | ₹15,135.43 | ₹9,316.03 | ₹9,062.20 | ₹8,366.01 |
| Equity Capital | ₹25,113.01 | ₹24,850.59 | ₹24,812.39 | ₹26,971.16 |
| Total Equity & Liabilities | ₹68,479.32 | ₹59,413.86 | ₹57,354.14 | ₹56,708.32 |
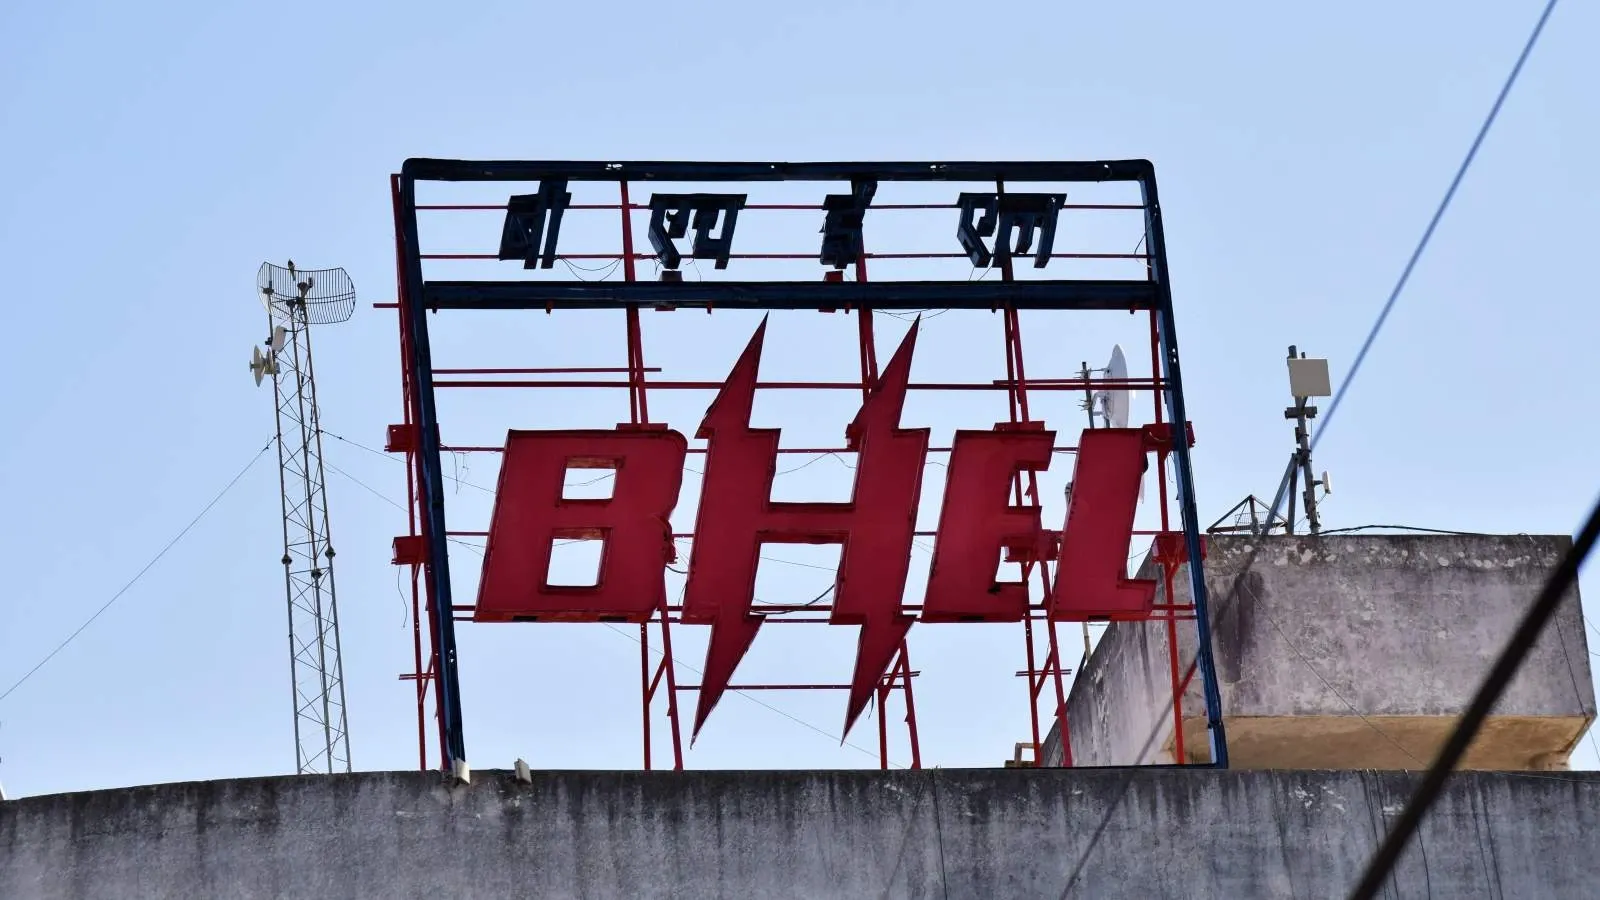
Bharat Heavy Electricals Ltd (BHEL) is one of the largest engineering and manufacturing companies in India. The state-owned company’s business operations span across several core sectors of economy like transportation, defence and power.
The public sector undertaking (PSU) has been a reliable designer, manufacturer and supplier of world-class equipment related to power generation, transmission, transportation, defence, aerospace as well as oil and gas sectors. The company has also forayed into emerging sectors like battery energy storage systems and electric vehicle chargers in recent years. It is one of the few companies in the world having the capability to design and manufacture equipment for the entire range of power plants – nuclear, hydro, thermal and gas.
BHEL was incorporated on November 13, 1964. It later came into existence in its present form on January 1, 1974, after merger with HE (India) Ltd plant at Bhopal, Transformer Plant in Jhansi and Central Foundry Forge Plant in Haridwar.
After the merger, BHEL reached a turnover level of ₹230 crore by 1973-74. In 1991, BHEL became a public company and it had a market capitalisation of over ₹62,137 crore (as of December 12, 2023). In the past three years, BHEL share price has surged nearly 400%.
As of September 2023, the government held around 63.17% stake in BHEL, while 36.83% was owned by the public.
BHEL has 16 manufacturing facilities across the country in Bhopal, Bengaluru, Goindwal, Haridwar, Hyderabad, Jagdishpur, Jhansi, Rudrapur, Ranipet, Tiruchirappalli, Thirumayam and Visakhapatnam along with repair units in Mumbai and Varanasi.
BHEL’s international footprint spans 89 countries. These include neighbouring countries of Bangladesh, Afghanistan, Bhutan and Nepal, along with Indonesia, Oman, Iraq, Sudan, Afghanistan, United States and New Zealand.
BHEL has a strong presence in various sectors of the Indian capital goods industry, including power generating equipment for the utilities. The worldwide installed base of power generating equipment supplied by BHEL is 197 GW.
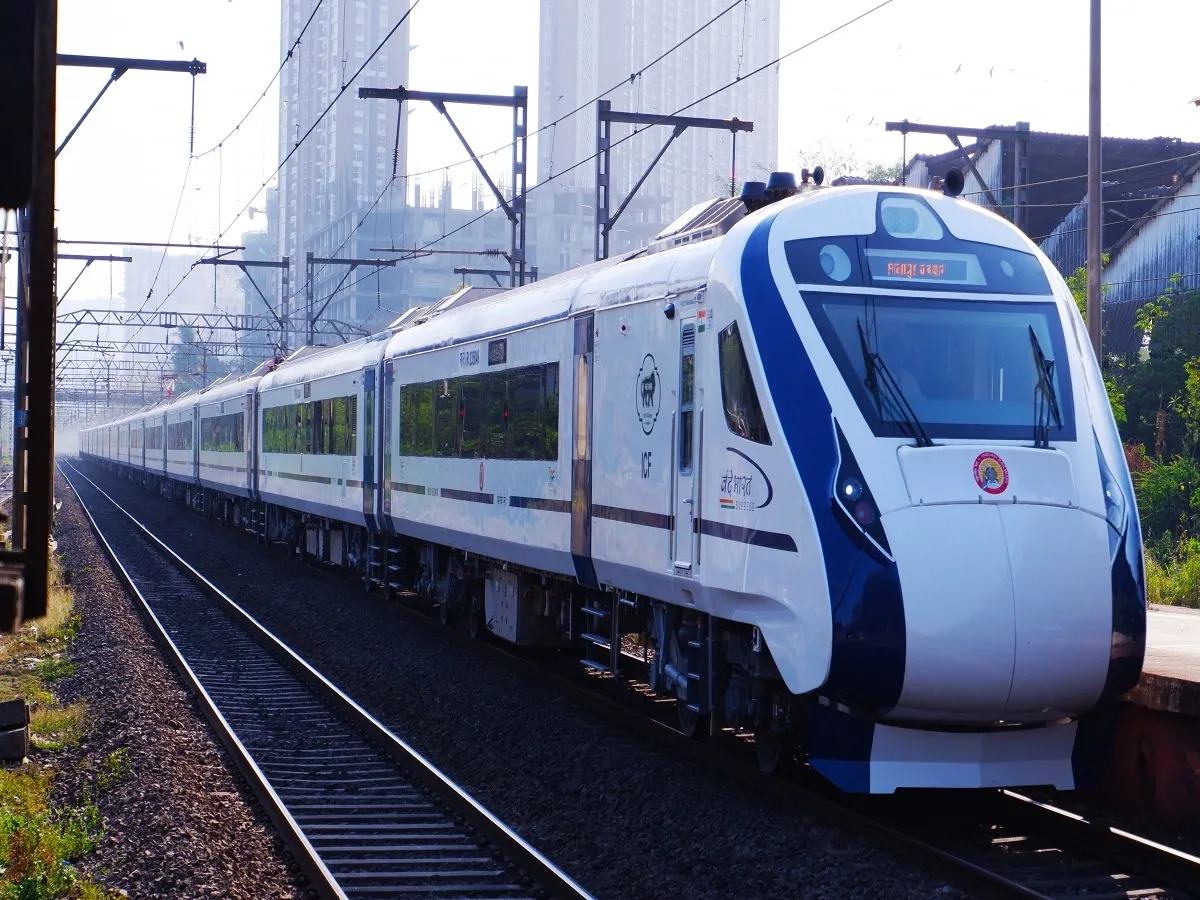
Besides, the company has supplied more than 800 locomotives and other traction equipment for locomotives and EMUs (electric multiple units). BHEL has also commissioned over 240 electric substations and 6 major HVDC (high voltage direct current) projects in the country, becoming the largest manufacturer and supplier of power transformers and electrical AC machines in the country. The company has also installed and commissioned over 1.2 GW solar portfolio spread across India.
BHEL is also the only manufacturer of nuclear steam turbines in the country and has been involved in all three stages of India’s nuclear power programme.
BHEL has also been a major supplier of critical equipment and services in the defence and aerospace sector for over three decades and is a trusted supplier of naval guns to the Indian Navy for their warships.
BHEL share price is ₹376.45 as on 07 Jul, 2026, 15:57 IST.
In the last 1 year, BHEL delivered a return of 46.85%. The BHEL share price hit a high of ₹424.90 and low of ₹205.12.
The Mutual Fund Shareholding in BHEL was 12.88% at the end of Mar 2026.
The 52-week high and low of BHEL share is ₹424.90 and ₹205.12 as of 07 Jul, 2026.
The market capitalisation of BHEL is ₹1,34,913.00 Crores as on 07 Jul, 2026.
The stock symbol of BHEL is BHEL on the NSE, 500103 on the BSE, and the ISIN is INE257A01026.
BHEL shares closed yesterday at ₹387.50 on NSE & ₹387.45 on BSE
To buy BHEL shares, open a demat account with Upstox and complete the KYC process. Once your account is set up, search for the stock and place your order.
No, shares of BHEL or any other publicly traded company cannot be bought or sold on holidays when the stock exchanges are closed. You can only buy or sell BHEL shares on days when the stock exchanges are open for trading. It's important to check the NSE & BSE holidays calendar, before placing any trades to avoid any inconvenience.
The PE and PB ratio of BHEL is 84.23 and 5.16 respectively, as on 07 Jul, 2026, 15:57 IST.