
BEL Share Price

₹ 394.55

-₹3.15 (-0.79%)
1D
Last updated 09 Nov, 2026, 15:59 IST
NSE: BEL
|
Engineering

BEL Share Price Today

As of 11 Nov 2026, BEL share price is ₹394.55. The stock opened at ₹398.50, compared to its previous close of ₹397.70. During today's trading session, BEL share price moved in the range of ₹391.85 to ₹399.30, with an average price of ₹395.58 for the day. Looking at its last 52-week, the stock has touched a low of ₹354.55 and a high of ₹473.45. On the performance front, BEL share price has declined by 10.27% over the last six months and is down 4.76% on a year-on-year basis.

Share price over the last 1 day fell from 395.60 to 394.55, ranging between 392.00 and 396.35.

₹391.85
0.79% down today
₹399.30
1D LOW
1D HIGH

BEL Stock Insights

Latest Earning
Op Profit TrendUp by 47.12% QoQ
Latest Earning
Net Profit TrendUp by 46.69% QoQ
Latest Earning
Revenue TrendUp by 31.46% QoQ
Stock Performance
UnderperformingUnderperforming Nifty by 5.13 % in last 1 yr
Shareholding Pattern
DIIDII increased stake by 15.69%
Shareholding Pattern
FIIFII decreased stake by 5.76%
BEL stock performance
Open₹398.50
High₹399.30
Low₹391.85
Prev. close₹397.70
BEL trading activity
Volume92,35,268
Average traded price₹394.34
Last traded time03:59:35 09 Nov
Last traded quantity10

Circuit
L
H
₹355.10
₹434.00
52-week
L
H
₹354.55
₹473.45
Mkt Cap Cr
2,88,151.48

P/E
45.0

P/B
10.97

ROA
13.96%
ROE
24.37%

ROCE
32.13%

Quick Ratio
1.45

EV/EBITDA
30.78

Based on fundamentals, this stock's

Performance: 4 out of 5, Good
Performance
Good
Bharat Electron outperforming most market indices
Valuation: 1 out of 5, Overvalued
Valuation
Overvalued
Bharat Electron appears overvalued compared to its peers
Earnings: 5 out of 5, Excellent
Earnings
Excellent
Bharat Electron revenue, operating profit and net profit are growing
Peer Comparison
Peer comparison — key ratios
NameMkt Cap CrP/EP/BROAROEROCEQuick RatioEV/EBITDA
HAL3,32,983.0735.728.117.04%22.21%14.09%1.9220.72
Solar Industries (India)1,71,931.1073.5122.4117.77%29.5%32.87%1.3547.4
MAZAGON DOCK SHIPBUIL LTD75,754.7630.917.249.07%23.45%26.84%1.2420.27
Bharat Dynamics39,213.0278.089.593.65%9.91%7.22%1.2843.53
Cochin Shipyard33,911.1149.865.774.68%12.2%14.45%1.0428.0
Garden Reach Ship & Eng25,188.8431.469.597.53%28.48%38.21%0.819.25
ITI23,920.0673.6912.553.47%-8.2%1.44%0.944.23
Data Patterns India22,505.5693.4913.0612.3%13.97%19.23%8.557.33
SIGMA ADVANCED SYSTEM LTD17,819.1384.2918.8915.73%57.22%39.83%0.9981.88
MTAR Technologies16,986.83127.320.657.65%11.43%12.93%0.8670.54

Auto-generated based on historical fundamentals; not a recommendation to buy/sell.

BEL Company Background

ISIN
INE263A01024
Sector Market Cap
₹ 288,151.48 Cr

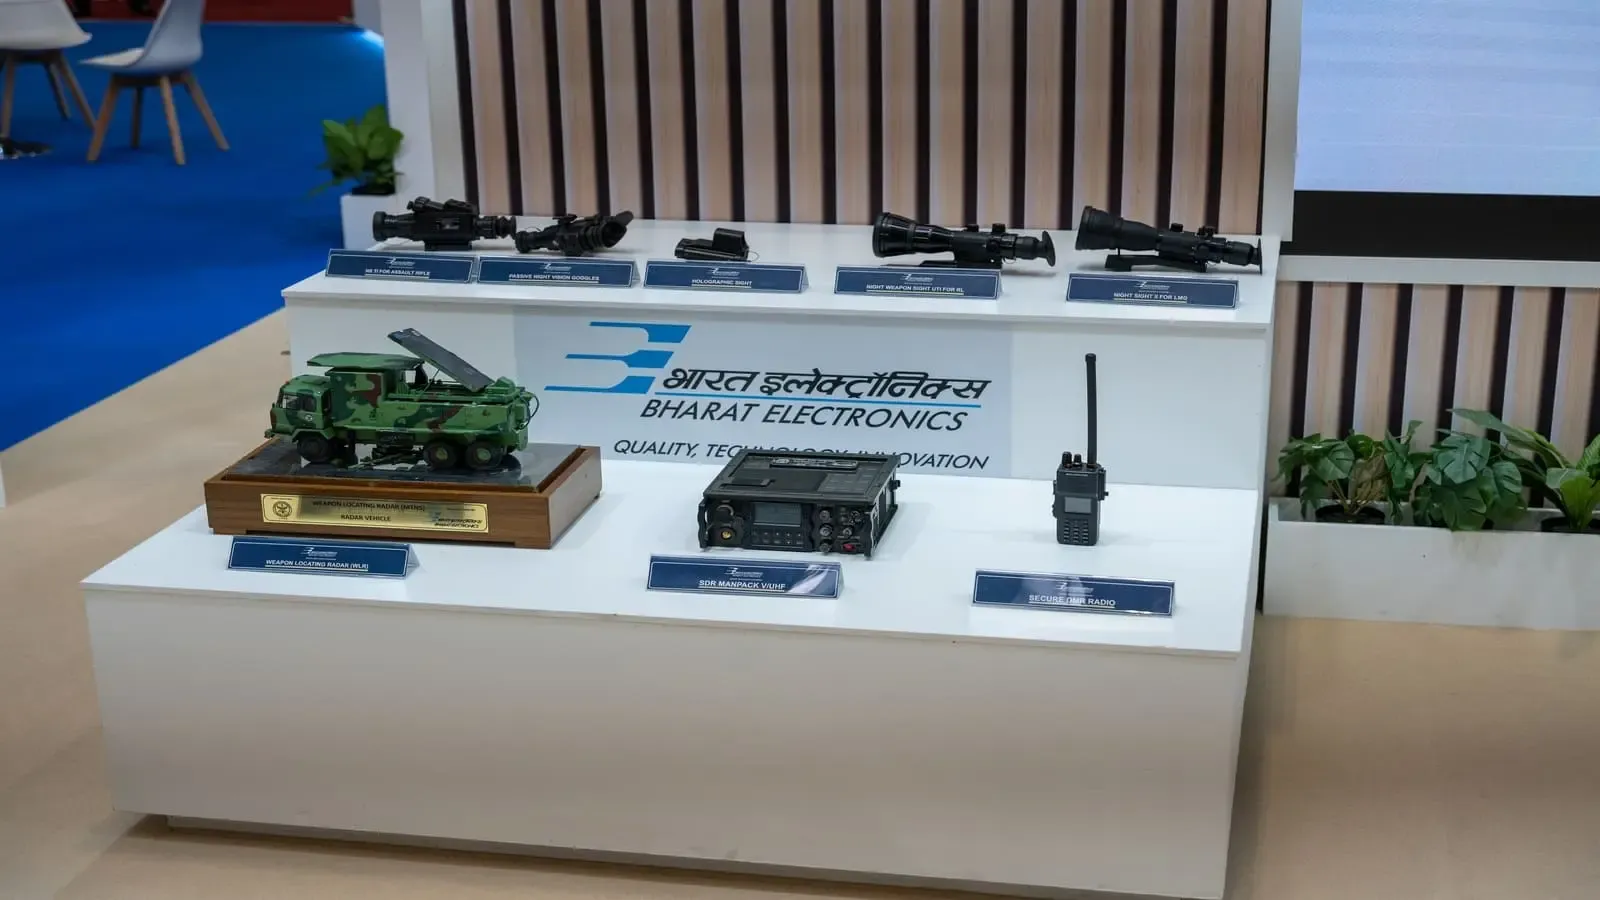
Bharat Electronics Limited (BEL) is a public sector company specialising in aerospace and defence electronics. It is primarily engaged in design, development, manufacturing and supply of high-end electronic products and systems. Bharat Electronics Ltd is a Navratna public sector undertaking under the Ministry of Defence.

The company’s market capitalisation stood at over ₹1.18 lakh crore as of December 13, 2023. BEL share price has surged over 324% in the last three years.

Bharat Electronics Limited was established in Bengaluru in 1954. The company began its journey by producing a small range of communication equipment in 1956. It ventured into producing receiving valves in 1961, Germanium semiconductors in 1962 and radio transmitters for All India Radio (AIR) in 1964.

The company established a radar manufacturing unit for the Indian Army in 1966. By 1970, BEL was manufacturing black-and-white television picture tubes and X-ray tubes. In 1972, it started supplying TV transmitters to Doordarshan.

The company now caters to the diverse needs of both defence and civilian customers in India and abroad through its multi-product and multi-technology portfolio. BEL specialises in products for communication, radars, naval systems, electronic warfare systems, weapon systems and DTH. The company also manufactures electronic voting machines (EVMs).

In 2002, the company was the first defence PSU to get Miniratna status and in 2007 it became a Navratna PSU.

BEL business operations

Bharat Electronics Limited operates through several subsidiaries. BEL Optronic Devices Limited (BELOP) is a wholly-owned subsidiary of the company. BEL-THALES Systems Limited (BTSL) operates as a subsidiary with BEL holding a 74% share in the company. GE BE Pvt Limited (GEBEL) functions as a joint venture (JV) with BEL holding a 26% share. Bharat Electronics Limited holds a 50% shareholding in the Defence Innovation Organisation (DIO).

In the defence segment, BEL received orders worth ₹18,052 crore in FY23. BEL’s defence products include radar and fire control systems, weapon systems, communication, network-centric systems, electronic warfare systems, avionics, anti-submarine warfare systems, sonar systems, electro-optics, tank electronics, gun upgrades, cyber security systems and unmanned systems.

Bharat Electronics Limited's recent milestones include the successful delivery of various defence systems such as the DRDO-designed Akash Missile System, Long Range Surface to Air Missile (LR SAM), Naval Fire Control Systems, L-70 Air Defence Gun System, and Schilka Air Defence Gun System. BEL’s export services cater to clients in countries like the United States, France, China, Germany, Switzerland, ASEAN nations, Mauritius, the Republic of Armenia, Sri Lanka, Sweden and Israel.

Over the years, the company has signed MoUs with several foreign defence manufacturers like Lockheed Martin, EADS and Northrop Grumman, Rafael, Raytheon and Elisra for developing electronic warfare systems.

BEL Financial Highlights

  • Revenue: BEL reported revenue of ₹28,176.14 crore in FY26 vs ₹24,511.11 crore in FY25. It showed an increase of 14.95% on a yearly basis.
  • Operating Profit: BEL reported an operating profit of ₹8,052.96 crore in FY26 vs ₹7,099.00 crore in FY25. It showed an increase of 13.44% on a year-on-year basis.
  • Net Profit: BEL reported a net profit of ₹6,023.47 crore in FY26 vs ₹5,287.15 crore in FY25. It showed an increase of 13.93% on a yearly basis.

BEL Quarterly Result Highlights

  • BEL reported revenue of ₹7,514.85 crore in Sep 2026, compared with ₹5,716.54 crore in Jun 2026, representing an increase of 31.46% on a quarter-on-quarter (QoQ) basis.
  • BEL reported an operating profit of ₹2,054.11 crore in Sep 2026, compared with ₹1,396.25 crore in Jun 2026, representing an increase of 47.12% on a quarter-on-quarter (QoQ) basis.
  • BEL reported a profit of ₹1,531.33 crore in Sep 2026, compared with ₹1,043.90 crore in Jun 2026, reflecting an increase of 46.69% on a QoQ basis.
  • The earnings per share (EPS) of BEL stood at ₹8.29 during Sep 2026.

Data Source: BSE, Company announcements

Securities shown are illustrative, not recommendations. Past performance does not guarantee future results.

Promoters
51.14%
FII
16.98%
Other DII
6.98%
Retail and other
10.00%
Mutual funds
14.90%
Foreign Institutional Investor (FII)
FII shareholding by period
Dec 202518.51%
Mar 202619.50%
Jun 202618.02%
Sep 202616.98%

BEL Investment Returns

1 day
-0.79%

1 week
+3.80%

1 month
+7.17%

1 year
-4.76%

3 years
+186.01%

5 years
+436.07%

BEL Share Price History

BEL share price history by day, showing open and close prices and the percentage change
Day
Open / Close
Change %
09 Nov 26
₹398.50 / ₹394.55
-0.79%
08 Nov 26
₹400.00 / ₹397.70
+0.43%
06 Nov 26
₹390.00 / ₹396.00
+0.23%
05 Nov 26
₹404.00 / ₹395.10
-0.73%
Show more

BEL Financials

Full statement

Income Statement · Consolidated

Income Statement · Consolidated — all values in INR Crore
ParticularsMar 2026Mar 2025Mar 2024Mar 2023
Revenue₹27,610.11₹23,768.75₹20,268.24₹17,734.44
Other Income₹566.03₹742.36₹670.14₹280.80
Total Revenue₹28,176.14₹24,511.11₹20,938.38₹18,015.24
Total Expenses₹20,123.18₹17,412.11₹15,672.17₹14,092.33
Profit Before Tax₹8,052.96₹7,099.00₹5,266.21₹3,922.91
Tax₹2,029.49₹1,811.85₹1,323.10₹982.56
Profit After Tax₹6,023.47₹5,287.15₹3,943.11₹2,940.35
EPS - Basic₹8.29₹7.28₹5.45₹4.09
EPS - Diluted₹8.29₹7.28₹5.45₹4.09

Cash Flow · Consolidated

Cash Flow · Consolidated — all values in INR Crore
ParticularsMar 2026Mar 2025Mar 2024Mar 2023
Profit before tax₹8,091.75₹7,134.53₹5,308.34₹3,968.80
Income before WC changes₹8,120.92₹6,949.17₹5,259.80₹4,800.82
Change in Assets-₹4,312.80-₹2,394.60-₹694.69-₹2,283.08
Change in Liabilities-₹246.13-₹2,315.66₹1,512.75-₹251.15
Change in WC-₹4,558.93-₹4,710.26₹818.06-₹2,534.23
Cash flow from Operations₹1,541.37₹564.27₹4,659.49₹1,199.26
Cash flow from Investing₹1,730.00₹639.29-₹5,923.85₹2,707.65
Cash flow from Financing-₹2,096.86-₹1,696.43-₹1,475.01-₹1,262.08
Total Cash Flow₹1,174.51-₹492.87-₹2,739.37₹2,644.83
Cash (Start of the year)₹713.45₹1,206.32₹3,945.69₹1,300.86
Cash (End of the year)₹1,887.96₹713.45₹1,206.32₹3,945.69

Balance Sheet · Consolidated

Balance Sheet · Consolidated — all values in INR Crore
ParticularsMar 2026Mar 2025Mar 2024Mar 2023
Non-Current Assets₹6,480.65₹5,973.98₹5,463.70₹5,443.43
Current Assets₹38,056.87₹34,857.88₹34,062.98₹30,047.74
Total Assets₹44,537.52₹40,831.86₹39,526.68₹35,491.17
Current Liabilities₹19,259.75₹19,752.54₹22,026.73₹20,565.78
Net Current Asset₹18,797.12₹15,105.34₹12,036.25₹9,481.96
Non-Current Liabilities₹1,270.63₹1,086.49₹1,155.56₹1,046.01
Equity Capital₹24,007.14₹19,992.83₹16,344.39₹13,879.38
Total Equity & Liabilities₹44,537.52₹40,831.86₹39,526.68₹35,491.17

Income Statement · Standalone

Income Statement · Standalone — all values in INR Crore
ParticularsMar 2026Mar 2025Mar 2024Mar 2023
Revenue₹27,479.63₹23,658.01₹20,169.39₹17,646.20
Other Income₹590.39₹767.59₹755.84₹360.02
Total Revenue₹28,070.02₹24,425.60₹20,925.23₹18,006.22
Total Expenses₹19,994.98₹17,335.61₹15,590.67₹14,021.34
Profit Before Tax₹8,075.04₹7,089.99₹5,334.56₹3,984.88
Tax₹2,026.56₹1,801.74₹1,314.56₹978.21
Profit After Tax₹6,048.48₹5,288.25₹4,020.00₹3,006.67
EPS - Basic₹8.27₹7.23₹5.50₹4.11
EPS - Diluted₹8.27₹7.23₹5.50₹4.11

Cash Flow · Standalone

Cash Flow · Standalone — all values in INR Crore
ParticularsMar 2026Mar 2025Mar 2024Mar 2023
Profit before tax₹8,075.04₹7,089.99₹5,334.56₹3,984.88
Income before WC changes₹8,060.61₹6,858.74₹5,182.03₹4,735.11
Change in Assets-₹4,269.50-₹2,400.82-₹653.51-₹2,321.44
Change in Liabilities-₹278.10-₹2,333.29₹1,532.46-₹263.82
Change in WC-₹4,547.60-₹4,734.11₹878.95-₹2,585.26
Cash flow from Operations₹1,494.34₹457.25₹4,648.01₹1,086.55
Cash flow from Investing₹1,747.39₹771.57-₹5,888.85₹2,800.10
Cash flow from Financing-₹2,096.48-₹1,696.14-₹1,474.34-₹1,261.51
Total Cash Flow₹1,145.25-₹467.32-₹2,715.18₹2,625.14
Cash (Start of the year)₹681.68₹1,149.00₹3,864.18₹1,239.04
Cash (End of the year)₹1,826.93₹681.68₹1,149.00₹3,864.18

Balance Sheet · Standalone

Balance Sheet · Standalone — all values in INR Crore
ParticularsMar 2026Mar 2025Mar 2024Mar 2023
Non-Current Assets₹6,316.99₹5,790.91₹5,264.50₹5,151.20
Current Assets₹37,773.40₹34,627.17₹33,891.15₹29,903.28
Total Assets₹44,090.39₹40,418.08₹39,155.65₹35,054.48
Current Liabilities₹19,175.44₹19,698.51₹21,990.08₹20,508.81
Net Current Asset₹18,597.96₹14,928.66₹11,901.07₹9,394.47
Non-Current Liabilities₹1,217.39₹1,021.89₹1,083.18₹963.68
Equity Capital₹23,697.56₹19,697.68₹16,082.39₹13,581.99
Total Equity & Liabilities₹44,090.39₹40,418.08₹39,155.65₹35,054.48
* All values are in INR Crore
BEL market depth
Bid quantityBid priceAsk priceAsk quantity
00394.557341
0000
0000
0000
0000
Total bid quantity0
Total ask quantity7,341
BEL technical summary
Bearish indicators3
Neutral indicators4
Bullish indicators1
OverallSlightly Bearish
by SEBI experts

Expert Pick

EXPPICK
Stop-loss
Stop-loss is locked. Sign in to view.
Entry price
Entry price is locked. Sign in to view.
Target
Target is locked. Sign in to view.
Indicator
Value
Verdict

RSI (14)
60.01
Neutral

ATR (14)
9.5
Neutral

STOCH(9,6)
75.94
Neutral

STOCH RSI (14)
86.61
Bearish

ADX(9)
30.72
Bearish

UO(9)
64.57
Neutral

ROC(12)
8.99
Bullish

WillR(14)
-19.92
Bearish
Period
Simple value
Exponential vaue

5D
396.27
393.04

10D
384.12
387.42

20D
378.33
383.32

50D
387.87
387.1

100D
398.16
396.54
Volume trend — traded volume by day
9 Nov92L
8 Nov29L
6 Nov88L
5 Nov1Cr
4 Nov2Cr
Average1Cr

Technical indicators used here are for indicative purposes only. Kindly do not treat it as an investment or trading advice

Compare against other stocks

BEL
Engineering
Add Stock
Add Another

BEL Returns Calculator

Ex-date: 13 Aug 2026

Ex-date: 06 Mar 2026

BEL Latest News

1 day ago
Stocks to watch, Nov 9: Amber Enterprises, Tata Steel, Tata Chemicals, pharma stocks, Adani Enterprises, BEL, BHEL

6 days ago
Top gainers and losers, Nov 4: BEL surges 5%, Adani Ent, Titan rise 4%, TCS declines 2.5%; check list
6 days ago
Market wrap, Nov 4: SENSEX rises 383 pts, NIFTY50 ends at 23,960; NIFTY Smallcap 100 jumps 2%, BEL top gainer

6 days ago
NIFTY50, SENSEX recover after opening lower amid mixed global cues; SBI, ITC, Max Healthcare among top gainers
1 week ago
Bharat Electronics Q2 FY27 results: Net profit rises 20% YoY; order book stands at ₹68,717 crore

2 weeks ago
Bharat Electronics, HAL, BEML: Defence stocks rally as Centre clears ₹2.12 lakh crore procurement proposals
2 weeks ago
Bharat Electronics bags fresh orders worth ₹1,011 crore; ₹770 crore Army radar deal adds to the spotlight

2 weeks ago
Defence ministry inks ₹770 crore contract with BEL for low-level light-weight radars for Army

2 weeks ago
Hindustan Aeronautics, BEL, BDL: What Rubio’s India visit means for defence stocks; key things investors should know
3 weeks ago
Bharat Electronics shares rise as firm bags order worth ₹533 crore; check details
Showing news item 1 of 10


BEL Share Price FAQs


Please be aware that BEL stock prices are subject to continuous fluctuations due to various factors.