Logo

National Aluminium Share Price

NSE: NATIONALUM
|
Aluminium Products
₹ 347.60
+₹15.35 (4.62%)
1D
Last updated 03 Jul, 2026, 15:59 IST

National Aluminium Share Price Today

As of 5 Jul 2026, National Aluminium share price is ₹347.60. The stock opened at ₹340.00, compared to its previous close of ₹332.25. During today's trading session, National Aluminium share price moved in the range of ₹338.90 to ₹349.20, with an average price of ₹344.05 for the day. Looking at its last 52-week, the stock has touched a low of ₹179.93 and a high of ₹445.15. On the performance front, National Aluminium share price has increased by 5.24% over the last six months and is up 80.81% on a year-on-year basis.


₹338.90
4.62% up today
₹349.20
1D LOW
1D HIGH

National Aluminium Returns Calculator

Open
₹340.00
High
₹349.20
Low
₹338.90
Prev. close
₹332.25

Circuit
L
H
₹312.85
₹382.35
52-week
L
H
₹179.93
₹445.15

National Aluminium Shareholder Returns

National Aluminium Share Price History

Mkt Cap Cr
61,012.90

P/E
10.53

P/B
2.82

ROE
26.83%

D/E
0.00

ROCE
35.20%

Div. Yield
3.16%

EPS(TTM)
31.67
Turnover
0.76

EV/EBITDA
6.18

Net Margin
0.00%

Op. Margin
0.00%

ROA
21.84%

Quick Ratio
0.00

Curr. Ratio
3.61
Based on fundamentals, this stock's
Step 1 of 5
Performance
Very Poor
Natl. Aluminium has not beaten FD return of 7%
Step 3 of 5
Valuation
Fairly Valued
Natl. Aluminium appears to be fairly valued compared to its peers
Step 5 of 5
Earnings
Excellent
Natl. Aluminium revenue, operating profit and net profit are growing
Peer Comparison
Peer comparison — key ratios
NameMkt Cap CrP/EP/BROED/EROCEBook ValueDiv. YieldTurnoverEPS(TTM)
Hindustan Zinc2,23,371.0015.349.3876.94%0.5566.34%9.441.99%1.2632.45
Hindalco Industries2,13,284.0015.931.5612.83%0.2311.85%341.500.52%1.2045.40
VEDANTA ALUMINIUM METAL L1,80,562.000.00461.8549.39%-0.84-158.42%1.000.00%0.00-3.66
Vedanta1,07,985.0014.725.1636.71%0.4810.49%3.285.19%0.2645.34
Hindustan Copper47,843.5052.0814.3227.48%0.0334.56%34.620.58%0.869.52
Gravita India12,439.7032.885.0715.45%0.1814.84%250.220.38%1.8740.25
JAIN RESOURCE RECYCLING L12,357.5035.567.9222.25%0.8119.98%44.710.00%5.7810.37
Precision Wires India168.1410.920.868.93%0.3816.76%42.250.38%5.668.58
KSH INTERNATIONAL LIMITED5,707.4051.847.0613.63%0.4016.82%119.270.00%3.6718.38
Shivalik Bimetal Con4,390.5945.819.1219.91%0.0923.82%78.000.52%0.9914.20

National Aluminium Financials

Full statement

Income Statement · Consolidated

Income Statement · Consolidated — all values in INR Crore
ParticularsMar 2025Mar 2024Mar 2023Mar 2022
Revenue₹16,787.63₹13,149.15₹14,256.85₹14,180.81
Other Income₹357.01₹250.71₹233.64₹297.42
Total Revenue₹17,144.64₹13,399.86₹14,490.49₹14,478.23
Total Expenses₹10,009.54₹11,043.10₹12,535.50₹10,523.36
Profit Before Tax₹7,078.37₹2,712.08₹1,845.16₹3,954.31
Tax₹1,810.43₹723.62₹410.50₹1,002.90
Profit After Tax₹5,267.94₹1,988.46₹1,434.66₹2,951.41
EPS - Basic₹28.68₹10.83₹7.81₹16.07
EPS - Diluted₹28.68₹10.83₹7.81₹16.07

Cash Flow · Consolidated

Cash Flow · Consolidated — all values in INR Crore
ParticularsMar 2025Mar 2024Mar 2023Mar 2022
Profit before tax₹5,267.94₹1,988.46₹1,434.66₹2,951.41
Income before WC changes₹7,600.47₹3,362.45₹2,537.45₹4,647.80
Change in Assets₹103.68-₹291.81-₹303.55-₹503.44
Change in Liabilities-₹178.96₹283.44-₹578.97₹569.50
Change in WC-₹75.28-₹8.37-₹882.52₹66.06
Cash flow from Operations₹5,806.11₹2,719.32₹908.24₹3,958.35
Cash flow from Investing-₹3,970.54-₹2,000.47-₹334.25-₹2,619.23
Cash flow from Financing-₹1,757.66-₹738.65-₹923.50-₹1,139.84
Total Cash Flow₹77.91-₹19.80-₹349.51₹199.28
Cash (Start of the year)₹43.49₹63.29₹412.80₹213.52
Cash (End of the year)₹121.40₹43.49₹63.29₹412.80

Balance Sheet · Consolidated

Balance Sheet · Consolidated — all values in INR Crore
ParticularsMar 2025Mar 2024Mar 2023Mar 2022
Non-Current Assets₹13,742.84₹13,105.15₹12,326.11₹10,790.54
Current Assets₹9,139.32₹6,129.88₹5,300.50₹6,485.00
Total Assets₹22,882.16₹19,235.03₹17,626.61₹17,275.54
Current Liabilities₹3,498.20₹3,177.68₹2,885.65₹3,099.14
Net Current Asset₹5,641.12₹2,952.20₹2,414.85₹3,385.86
Non-Current Liabilities₹1,578.52₹1,669.26₹1,614.59₹1,624.01
Equity Capital₹17,805.44₹14,388.09₹13,126.37₹12,552.39
Total Equity & Liabilities₹22,882.16₹19,235.03₹17,626.61₹17,275.54

Income Statement · Standalone

Income Statement · Standalone — all values in INR Crore
ParticularsMar 2025Mar 2024Mar 2023Mar 2022
Revenue₹16,787.63₹13,149.15₹14,256.85₹14,214.58
Other Income₹357.01₹250.71₹233.64₹264.09
Total Revenue₹17,144.64₹13,399.86₹14,490.49₹14,478.67
Total Expenses₹10,009.54₹11,043.10₹12,535.50₹10,523.80
Profit Before Tax₹7,135.10₹2,783.57₹1,954.99₹3,954.87
Tax₹1,810.43₹723.62₹410.50₹1,002.90
Profit After Tax₹5,324.67₹2,059.95₹1,544.49₹2,951.97
EPS - Basic₹28.99₹11.22₹8.41₹16.07
EPS - Diluted₹28.99₹11.22₹8.41₹16.07

Cash Flow · Standalone

Cash Flow · Standalone — all values in INR Crore
ParticularsMar 2025Mar 2024Mar 2023Mar 2022
Profit before tax₹5,324.67₹2,059.95₹1,544.49₹2,951.97
Income before WC changes₹7,600.47₹3,362.45₹2,537.45₹4,646.60
Change in Assets₹103.68-₹283.22-₹303.55-₹404.80
Change in Liabilities-₹178.96₹282.61-₹578.97₹563.32
Change in WC-₹75.28-₹0.61-₹882.52₹158.52
Cash flow from Operations₹5,806.11₹2,727.08₹908.24₹4,049.61
Cash flow from Investing-₹3,970.54-₹1,999.64-₹334.25-₹2,735.92
Cash flow from Financing-₹1,757.66-₹747.24-₹923.50-₹1,114.41
Total Cash Flow₹77.91-₹19.80-₹349.51₹199.28
Cash (Start of the year)₹43.49₹63.29₹412.80₹213.52
Cash (End of the year)₹121.40₹43.49₹63.29₹412.80

Balance Sheet · Standalone

Balance Sheet · Standalone — all values in INR Crore
ParticularsMar 2025Mar 2024Mar 2023Mar 2022
Non-Current Assets₹13,983.16₹13,287.12₹12,438.19₹11,008.77
Current Assets₹9,139.32₹6,131.48₹5,300.50₹6,480.06
Total Assets₹23,122.48₹19,418.60₹17,738.69₹17,488.83
Current Liabilities₹3,498.20₹3,239.56₹2,885.65₹3,310.18
Net Current Asset₹5,641.12₹2,891.92₹2,414.85₹3,169.88
Non-Current Liabilities₹1,578.52₹1,607.38₹1,614.59₹1,624.01
Equity Capital₹18,045.76₹14,571.66₹13,238.45₹12,554.64
Total Equity & Liabilities₹23,122.48₹19,418.60₹17,738.69₹17,488.83
* All values are in INR Crore
Qty
Bid
204
347.6
0
0
0
0
0
0
0
0
Ask
Qty
0
0
0
0
0
0
0
0
0
0
Bid Total: 204
Ask Total: 0
Buy orders: 100%
Sell orders: 0%
Bearish
3
Neutral
5
Bullish
0
Slightly Bearish
by SEBI experts
Expert Pick
EXPPICK
Stop-loss
Entry price
Target
Indicator
Value
Verdict

RSI (14)
40.79
Neutral

ATR (14)
13.93
Neutral

STOCH(9,6)
33.54
Neutral

STOCH RSI (14)
84.78
Bearish

ADX(9)
42.29
Bearish

UO(9)
44.77
Neutral

ROC(12)
-5.2
Bearish

WillR(14)
-71.17
Neutral
Period
Simple value
Exponential vaue

5D
340.3
342.04

10D
349.15
348.61

20D
362.98
362.44

50D
394.99
380.45

100D
387.78
374.66

About National Aluminium

National Aluminium logo
ISIN
INE139A01034
Sector Market Cap
₹ 61,012.9 Cr

Founded on January 7, 1981, National Aluminium Company Limited (NALCO) is based in Odisha’s capital Bhubaneswar. The Government of India owns 51.28% in NALCO.

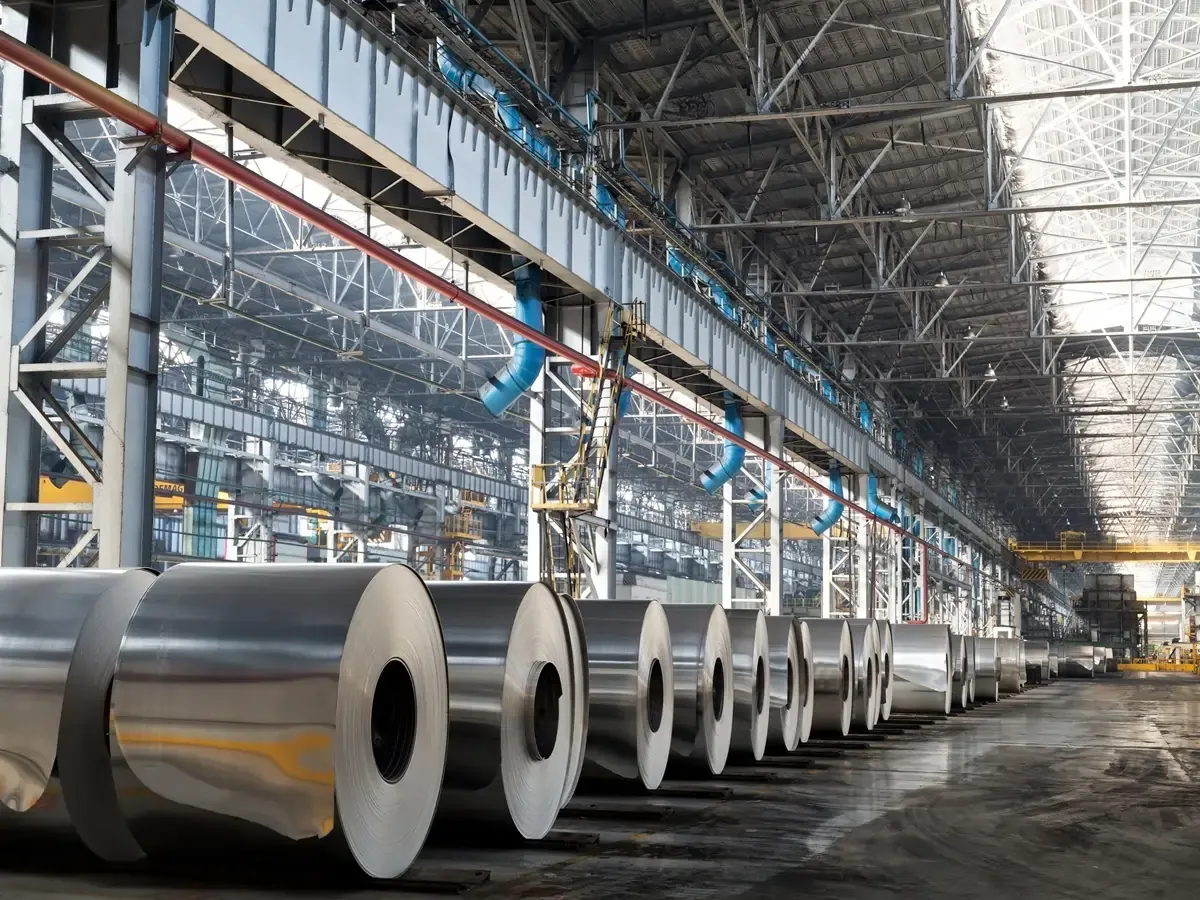
The company operates an aluminium smelter with a capacity of 4.60 lakh tonnes per annum (TPA) and a 1200 MW captive power plant in Angul, Odisha, as well as a 68.25 lakh TPA bauxite mine and a 21 lakh TPA (normative capacity) alumina refinery in Damanjodi in the state’s Koraput district.

The company maintains seven operational stockyards across the country in addition to regional sales offices in Delhi, Kolkata, Mumbai and Chennai. NALCO also has a bulk cargo facility of its own for product export.

With a market capitalisation of ₹20,337 crore (as of December 18, 2023), NALCO is listed both on BSE and NSE.

NALCO’s share price has surged over 164% in the last three years.

Operations

Bauxite Mine:

Located in Koraput district, the mine has a capacity of 68.25 lakh MT. 
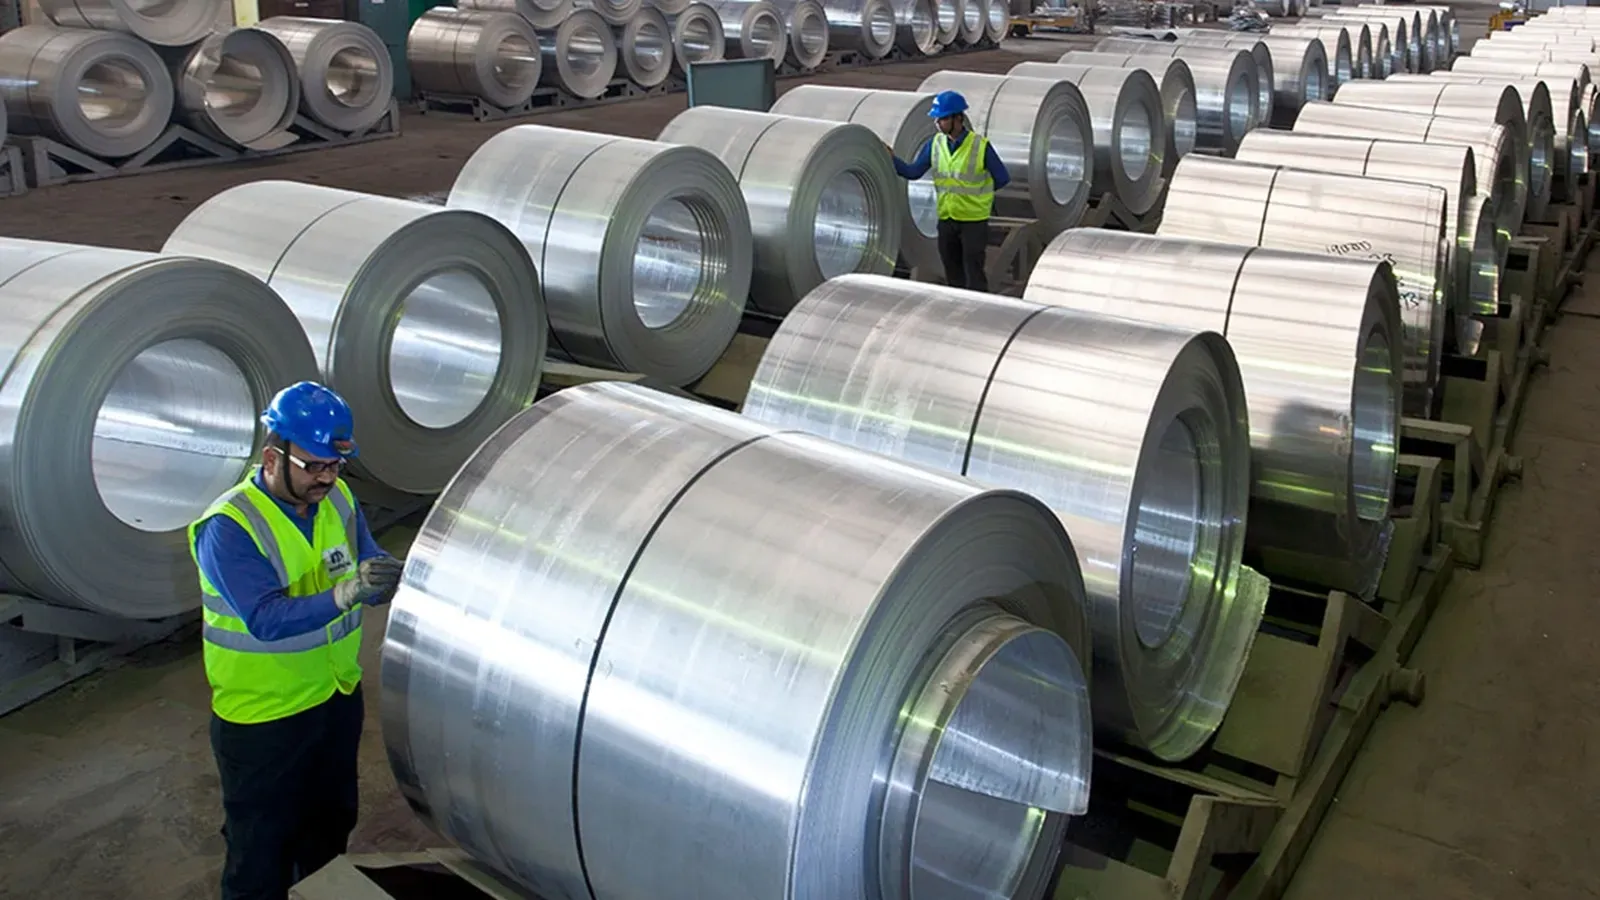
Alumina Refinery: With a normative capacity of 21 lakh tonnes annually, NALCO’s alumina refinery is massive.
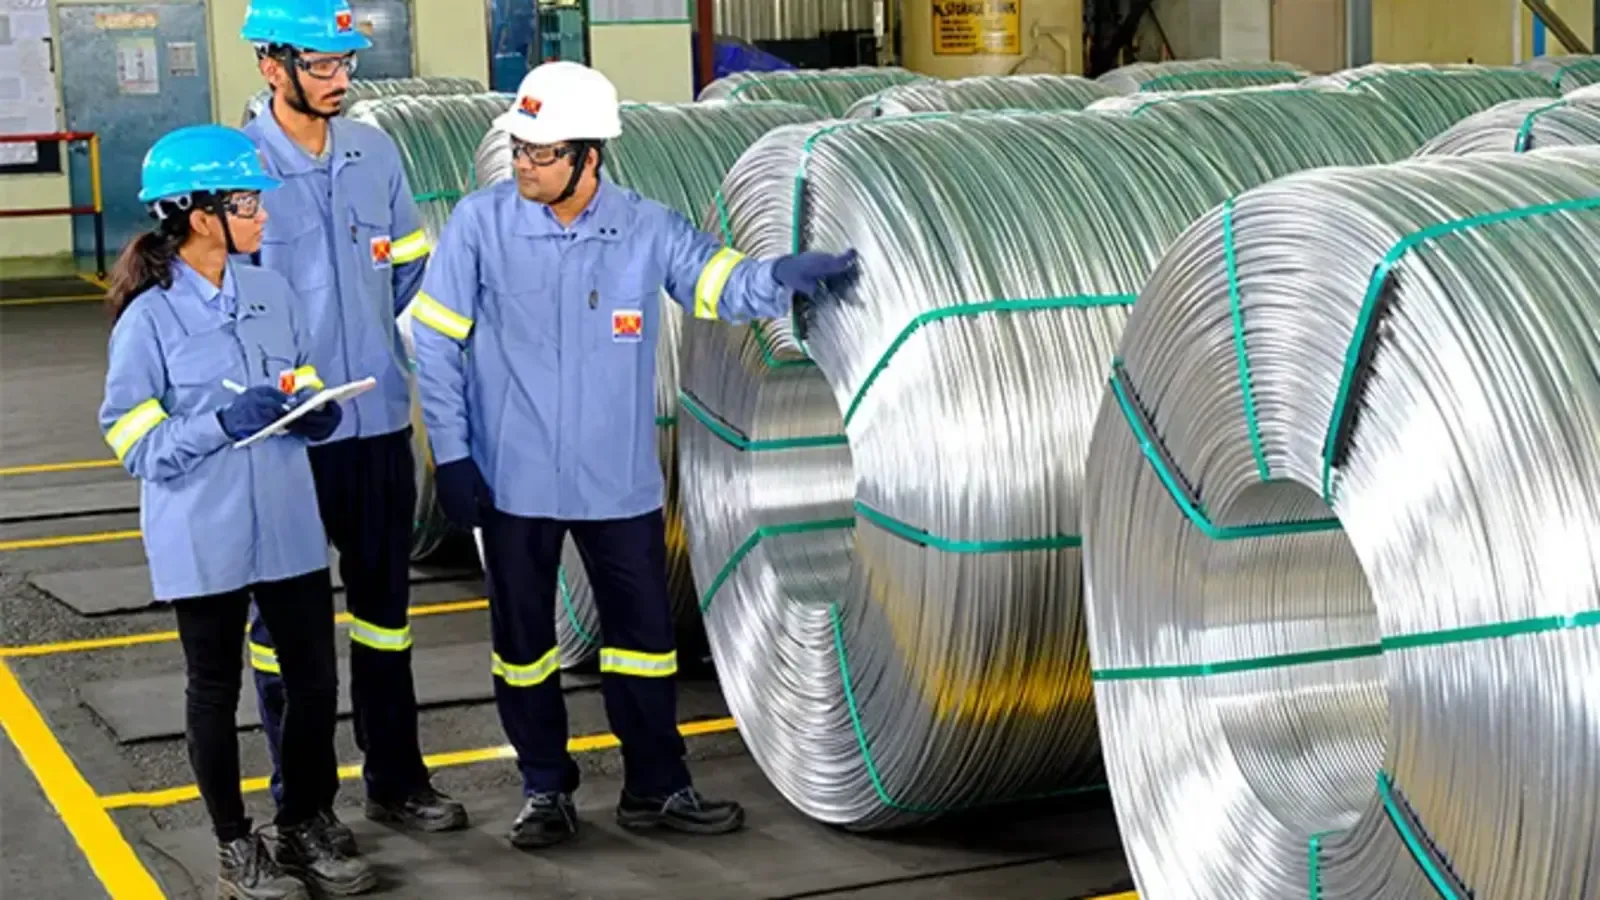
Smelter Plant:

Located in Angul, Odisha, NALCO’s 4.6 lakh tonnes per annum aluminium smelter is equipped with advanced technology for smelting. Captive Power Plant: A 1,200 MW captive power plant adjacent to the smelter ensures a steady supply of power. The surplus power is sold to the state grid.

Wind and Solar Power:

To achieve carbon neutrality, NALCO has built 198 MW of wind power plants at various locations across India and 850 kWp of rooftop solar power plants on its premises.

Port, Rail:

NALCO has automated ship handling and storage facilities in Visakhapatnam port for the import and export of caustic soda and calcined alumina. Kolkata and Paradip ports are also used to export aluminium. Using its own locomotives and wagons for both finished goods and raw materials, NALCO manages its surface transportation operations.

Expansion plans

5th stream alumina refinery:

Currently underway, this project aims to increase the refinery capacity. Utkal coal mines: Mining activities have started contributing to cost reduction in coal procurement. Clearances for Utkal-E are in an advanced stage.

Caustic soda plant:

In collaboration with Gujarat Alkalies & Chemicals Limited (GACL), the caustic soda plant started production in May 2022. Dispatch of caustic soda to NALCO began in August 2022.

Angul Aluminium Park Private Ltd (AAPPL):

This is a joint venture with Odisha Industrial Infrastructure Development Corporation to boost ancillary, upstream and downstream products related to the aluminum industry.

Khanij Bidesh India Limited (KABIL):

Formed in partnership with Hindustan Copper Ltd (HCL) and Mineral Exploration Corporation Ltd (MECL, this joint venture aims at acquiring strategic mineral assets overseas and facilitating supply in India.

National Aluminium Financial Highlights

  • Revenue: National Aluminium reported revenue of ₹18,508.88 crore in FY26 vs ₹17,144.64 crore in FY25. It showed an increase of 7.96% on a yearly basis.
  • Operating Profit: National Aluminium reported an operating profit of ₹7,748.70 crore in FY26 vs ₹7,078.37 crore in FY25. It showed an increase of 9.47% on a year-on-year basis.
  • Net Profit: National Aluminium reported a net profit of ₹5,797.01 crore in FY26 vs ₹5,267.94 crore in FY25. It showed an increase of 10.04% on a yearly basis.

National Aluminium Quarterly Result Highlights

  • National Aluminium reported revenue of ₹5,209.61 crore in Mar 2026, compared with ₹4,925.01 crore in Dec 2025, representing an increase of 5.78% on a quarter-on-quarter (QoQ) basis.
  • National Aluminium reported an operating profit of ₹2,316.04 crore in Mar 2026, compared with ₹2,125.77 crore in Dec 2025, representing an increase of 8.95% on a quarter-on-quarter (QoQ) basis.
  • National Aluminium reported a profit of ₹1,722.44 crore in Mar 2026, compared with ₹1,595.15 crore in Dec 2025, reflecting an increase of 7.98% on a QoQ basis.
  • The earnings per share (EPS) of National Aluminium stood at ₹28.68 during Mar 2026.
Know more
Promoters
51.28%
FII
22.28%
Other DII
4.51%
Retail and other
15.69%
Mutual funds
6.24%
Foreign institutions - FII
Compare against other stocks
National Aluminium logo
National Aluminium
Aluminium Products
Add Stock
Add Another

FAQs on National Aluminium Share Price