Logo

Olectra Greentech Share Price

NSE: OLECTRA
|
Electronics
₹ 1,490.00
-₹47.80 (-3.11%)
1D
Last updated 03 Jul, 2026, 15:59 IST

Olectra Greentech Share Price Today

As of 6 Jul 2026, Olectra Greentech share price is ₹1,490.00. The stock opened at ₹1,544.00, compared to its previous close of ₹1,537.80. During today's trading session, Olectra Greentech share price moved in the range of ₹1,460.00 to ₹1,544.60, with an average price of ₹1,502.30 for the day. Looking at its last 52-week, the stock has touched a low of ₹866.60 and a high of ₹1,714.20. On the performance front, Olectra Greentech share price has increased by 19.39% over the last six months and is up 23.23% on a year-on-year basis.


₹1,460.00
3.11% down today
₹1,544.60
1D LOW
1D HIGH

Olectra Greentech Returns Calculator

Open
₹1,544.00
High
₹1,544.60
Low
₹1,460.00
Prev. close
₹1,537.80

Circuit
L
H
₹1,192.00
₹1,788.00
52-week
L
H
₹866.60
₹1,714.20

Olectra Greentech Shareholder Returns

Olectra Greentech Share Price History

Mkt Cap Cr
12,623.20

P/E
70.32

P/B
10.28

ROE
14.46%

D/E
0.28

ROCE
19.12%

Div. Yield
0.04%

EPS(TTM)
21.06
Turnover
1.58

EV/EBITDA
35.83

Net Margin
0.00%

Op. Margin
0.00%

ROA
6.99%

Quick Ratio
0.00

Curr. Ratio
1.93
Based on fundamentals, this stock's
Step 5 of 5
Performance
Excellent
Olectra Greentec outperforming all market indices
Step 3 of 5
Valuation
Fairly Valued
Olectra Greentec appears to be fairly valued compared to its peers
Step 5 of 5
Earnings
Excellent
Olectra Greentec revenue, operating profit and net profit are growing
Peer Comparison
Peer comparison — key ratios
NameMkt Cap CrP/EP/BROED/EROCEBook ValueDiv. YieldTurnoverEPS(TTM)
Maruti Suzuki4,51,199.0030.744.2113.70%0.0017.51%3,343.160.98%1.64459.46
Mahindra & Mahindra3,94,603.0021.194.2418.37%0.0214.63%597.861.01%1.82130.18
Bajaj Auto2,75,567.0022.836.3228.57%0.0128.35%7.011.71%1.55352.00
Eicher Motors1,99,072.0036.107.9321.97%0.0127.17%794.471.13%0.94183.79
TVS Motor Company1,72,335.0052.9816.6735.27%0.2717.59%14.200.36%3.6576.09
TATA MOTORS LIMITED1,62,115.0047.9511.4034.02%0.4228.42%10.841.01%3.859.13
HYUNDAI MOTOR INDIA LTD1,58,450.0029.177.9227.14%0.0633.27%238.391.08%3.1065.50
Tata Motors1,27,417.001.330.9775.90%0.232.31%4.371.01%1.9714.26
Hero MotoCorp97,378.2016.864.5126.57%0.0133.40%1,078.403.80%2.03263.34
Ashok Leyland96,771.8026.036.7924.37%0.0912.51%22.332.12%2.876.07

Olectra Greentech Financials

Full statement

Income Statement · Consolidated

Income Statement · Consolidated — all values in INR Crore
ParticularsMar 2025Mar 2024Mar 2023Mar 2022
Revenue₹1,801.90₹1,154.14₹1,090.76₹593.26
Other Income₹12.32₹11.60₹10.06₹7.71
Total Revenue₹1,814.21₹1,165.74₹1,100.82₹600.96
Total Expenses₹1,629.72₹1,067.96₹1,014.03₹547.21
Profit Before Tax₹187.88₹105.78₹89.43₹52.31
Tax₹48.67₹27.12₹22.54₹16.95
Profit After Tax₹139.21₹78.65₹66.89₹35.36
EPS - Basic₹16.92₹9.36₹7.99₹4.31
EPS - Diluted₹16.92₹9.36₹7.99₹4.31

Cash Flow · Consolidated

Cash Flow · Consolidated — all values in INR Crore
ParticularsMar 2025Mar 2024Mar 2023Mar 2022
Profit before tax₹187.88₹105.78₹89.43₹52.31
Income before WC changes₹265.96₹177.08₹144.78₹85.65
Change in Assets-₹399.86₹37.65-₹346.91-₹112.66
Change in Liabilities₹289.64-₹44.10₹210.22₹150.72
Change in WC-₹110.22-₹6.45-₹136.69₹38.06
Cash flow from Operations₹140.67₹143.00-₹10.27₹121.41
Cash flow from Investing-₹224.83-₹86.49-₹37.83-₹164.34
Cash flow from Financing₹82.95-₹56.00₹35.17₹49.73
Total Cash Flow-₹1.21₹0.51-₹12.94₹6.80
Cash (Start of the year)₹6.87₹6.36₹19.30₹12.50
Cash (End of the year)₹5.67₹6.87₹6.36₹19.30

Balance Sheet · Consolidated

Balance Sheet · Consolidated — all values in INR Crore
ParticularsMar 2025Mar 2024Mar 2023Mar 2022
Non-Current Assets₹660.35₹435.66₹410.49₹405.77
Current Assets₹1,511.05₹1,152.91₹1,146.41₹784.67
Total Assets₹2,171.40₹1,588.58₹1,556.90₹1,190.45
Current Liabilities₹923.50₹613.65₹664.85₹330.84
Net Current Asset₹587.55₹539.26₹481.56₹453.83
Non-Current Liabilities₹195.19₹58.32₹50.99₹82.31
Equity Capital₹1,052.72₹916.61₹841.06₹777.29
Total Equity & Liabilities₹2,171.40₹1,588.58₹1,556.90₹1,190.45

Income Statement · Standalone

Income Statement · Standalone — all values in INR Crore
ParticularsMar 2025Mar 2024Mar 2023Mar 2022
Revenue₹1,763.06₹1,113.97₹1,134.41₹585.43
Other Income₹11.86₹12.22₹11.44₹7.87
Total Revenue₹1,774.92₹1,126.19₹1,145.85₹593.30
Total Expenses₹1,588.68₹1,027.49₹1,054.74₹538.69
Profit Before Tax₹186.23₹98.71₹91.11₹52.07
Tax₹46.67₹25.06₹20.41₹16.37
Profit After Tax₹139.56₹73.64₹70.70₹35.70
EPS - Basic₹17.00₹8.97₹8.61₹4.35
EPS - Diluted₹17.00₹8.97₹8.61₹4.35

Cash Flow · Standalone

Cash Flow · Standalone — all values in INR Crore
ParticularsMar 2025Mar 2024Mar 2023Mar 2022
Profit before tax₹186.23₹98.71₹91.11₹52.07
Income before WC changes₹251.54₹158.96₹138.05₹80.77
Change in Assets-₹397.46₹41.34-₹361.05-₹115.44
Change in Liabilities₹289.69-₹45.23₹241.75₹157.31
Change in WC-₹107.77-₹3.89-₹119.30₹41.86
Cash flow from Operations₹128.71₹127.11₹1.61₹120.34
Cash flow from Investing-₹230.84-₹76.00₹13.49-₹161.78
Cash flow from Financing₹102.28-₹52.83-₹28.15₹48.61
Total Cash Flow₹0.16-₹1.72-₹13.05₹7.17
Cash (Start of the year)₹3.14₹4.86₹17.91₹10.74
Cash (End of the year)₹3.30₹3.14₹4.86₹17.91

Balance Sheet · Standalone

Balance Sheet · Standalone — all values in INR Crore
ParticularsMar 2025Mar 2024Mar 2023Mar 2022
Non-Current Assets₹619.63₹395.80₹368.44₹401.12
Current Assets₹1,505.25₹1,132.67₹1,134.19₹765.42
Total Assets₹2,124.88₹1,528.46₹1,502.63₹1,166.54
Current Liabilities₹876.92₹556.79₹601.77₹299.79
Net Current Asset₹628.33₹575.87₹532.42₹465.63
Non-Current Liabilities₹192.33₹52.51₹52.24₹85.69
Equity Capital₹1,055.63₹919.17₹848.63₹781.05
Total Equity & Liabilities₹2,124.88₹1,528.46₹1,502.63₹1,166.54
* All values are in INR Crore
Qty
Bid
0
0
0
0
0
0
0
0
0
0
Ask
Qty
1490
1502
0
0
0
0
0
0
0
0
Bid Total: 0
Ask Total: 1502
Buy orders: 0%
Sell orders: 100%
Bearish
1
Neutral
6
Bullish
1
Neutral
by SEBI experts
Expert Pick
EXPPICK
Stop-loss
Entry price
Target
Indicator
Value
Verdict

RSI (14)
62.33
Neutral

ATR (14)
66.7
Neutral

STOCH(9,6)
37.5
Neutral

STOCH RSI (14)
48.7
Neutral

ADX(9)
34.81
Bearish

UO(9)
48.05
Neutral

ROC(12)
17.29
Bullish

WillR(14)
-22.09
Neutral
Period
Simple value
Exponential vaue

5D
1502.78
1502.54

10D
1504.44
1479.15

20D
1402.34
1424.8

50D
1312.1
1323.67

100D
1172.47
1258.17

About Olectra Greentech

Olectra Greentech logo
ISIN
INE260D01016
Sector Market Cap
₹ 12,623.2 Cr

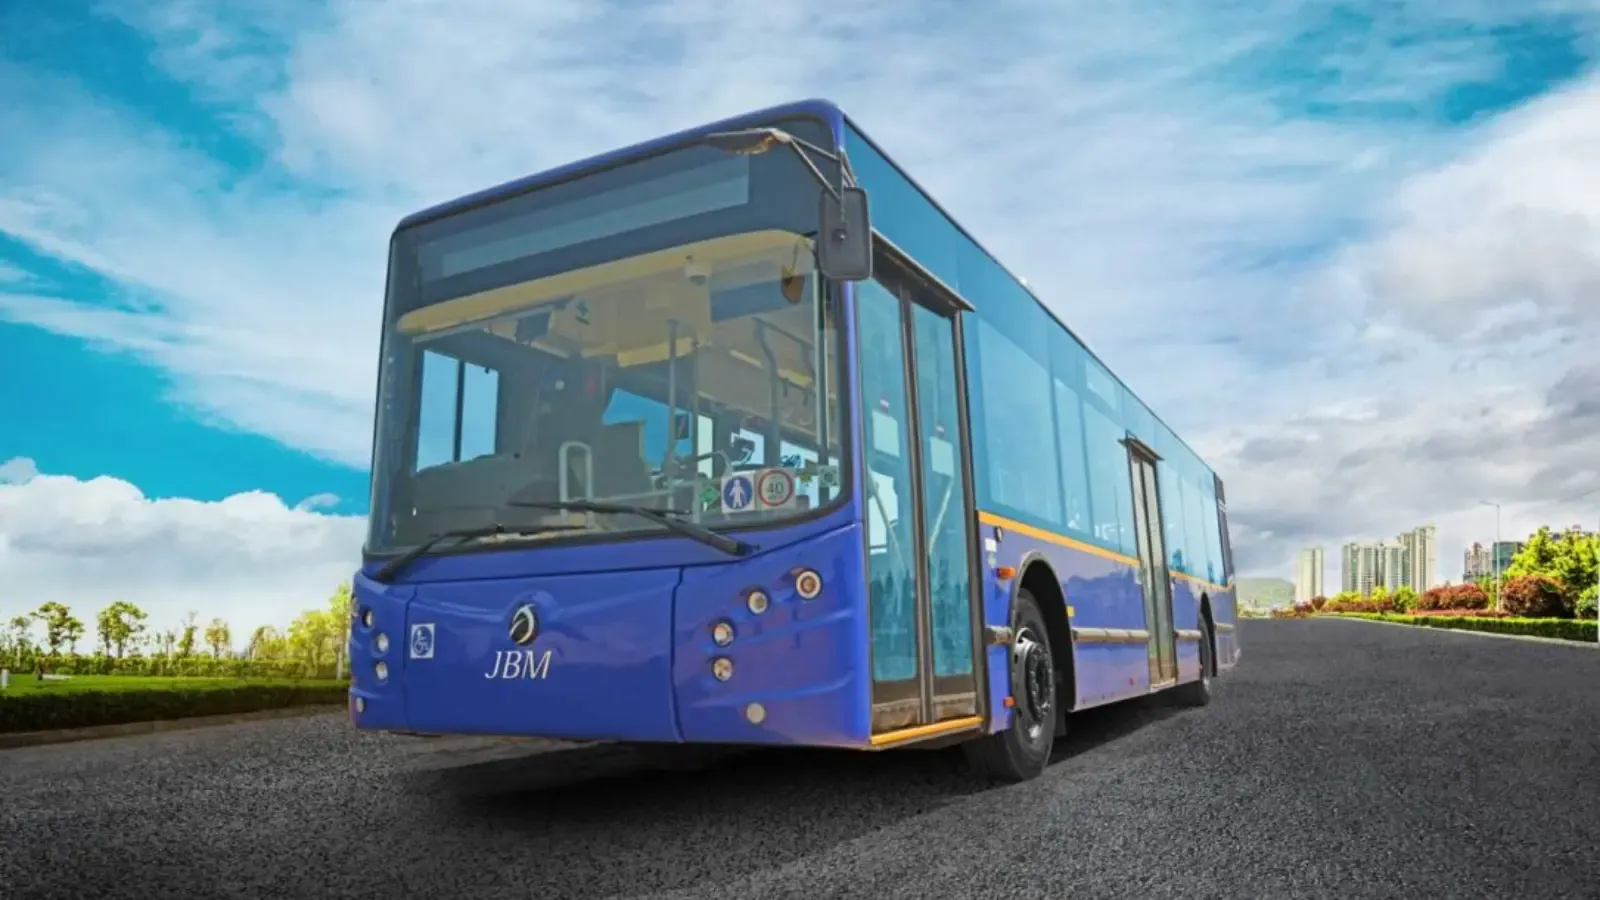
Olectra Greentech Limited (OGL) is India's leading manufacturer of pure electric buses, with production facilities located in Hyderabad. It is a subsidiary of the MEIL Group. Olectra has produced and deployed all types of electric buses across the country. The company was incorporated in 1992.

The market capitalisation of Olectra Greentech Limited stood at over ₹13,700 crore as of January 16, 2024. Olectra share price has gained more than 1,120% in the last three years.

Business operations

Olectra Greentech Limited is primarily engaged in manufacturing composite polymer insulators and electric buses. Building on its success in the commercial electric bus sector, the company later broadened its product range to include 3-wheeler electric autos and electric trucks within the e-mobility segment.

Olectra Greentech runs its business across various locations. It operates three plants and has one office in India. The company serves the electric vehicle market in nine states within India, while its insulator products are distributed in pan-India. Internationally, it has a presence in one country for e-vehicles and seven countries for insulators.

The manufacturing, operations and annual maintenance of electric buses constitute 87% of Olectra Greentech’s turnover. Secondly, the production of polymer insulators for power distribution contributes around 11% of the turnover.

Olectra caters to diverse customers within both the e-vehicles and composite insulator segments. In the e-vehicles sector, the customer base includes state and central government bodies situated in cities such as Pune, Hyderabad, Mumbai, Ahmedabad, Silvassa, Nagpur, Surat, Tirupati, Cochin, Kullu, Panjim and Dehradun.

In the composite insulator segment, the company’s customers consist of various state and central power generation and distribution corporations, private power generation companies and multinational infrastructure companies. These customers are based not only in India but also in international locations including the United States, Nigeria, Mozambique, Kenya and Zambia.

Olectra Greentech achieved its highest-ever sales with 563 electric buses and 17 electric tippers sold in FY23. A total of 259 electric buses were sold in the previous financial year. It also secured orders for 3,239 electric buses. The company expanded its business segment by introducing the e-tipper division and delivered 17 e-tippers in the last quarter of FY23. In the entire fiscal, 20 electric tippers were ordered.

The company issued a public tender in FY23 to identify a suitable vendor for constructing a greenfield electric vehicle manufacturing facility on 150 acres of land in Seetharampur, Telangana. The land was acquired from the Telangana State Industrial Infrastructure Corporation Limited (TSIIC). The objective is to increase the production capacity to 5,000 buses/trucks with the potential for scalability up to 10,000 units.

Olectra Greentech Financial Highlights

  • Revenue: Olectra Greentech reported revenue of ₹2,326.52 crore in FY26 vs ₹1,814.22 crore in FY25. It showed an increase of 28.24% on a yearly basis.
  • Operating Profit: Olectra Greentech reported an operating profit of ₹246.14 crore in FY26 vs ₹187.88 crore in FY25. It showed an increase of 31.01% on a year-on-year basis.
  • Net Profit: Olectra Greentech reported a net profit of ₹179.53 crore in FY26 vs ₹139.21 crore in FY25. It showed an increase of 28.96% on a yearly basis.

Olectra Greentech Quarterly Result Highlights

  • Olectra Greentech reported revenue of ₹645.90 crore in Mar 2026, compared with ₹667.10 crore in Dec 2025, representing a decrease of 3.18% on a quarter-on-quarter (QoQ) basis.
  • Olectra Greentech reported an operating profit of ₹79.81 crore in Mar 2026, compared with ₹64.07 crore in Dec 2025, representing an increase of 24.57% on a quarter-on-quarter (QoQ) basis.
  • Olectra Greentech reported a profit of ₹57.39 crore in Mar 2026, compared with ₹46.68 crore in Dec 2025, reflecting an increase of 22.94% on a QoQ basis.
  • The earnings per share (EPS) of Olectra Greentech stood at ₹16.92 during Mar 2026.
Know more
Promoters
50.02%
FII
7.11%
Other DII
0.35%
Retail and other
42.20%
Mutual funds
0.33%
Foreign institutions - FII
Compare against other stocks
Olectra Greentech logo
Olectra Greentech
Electronics
Add Stock
Add Another

FAQs on Olectra Greentech Share Price