Mahanagar Gas Share Price

₹ 1,037.90

-₹10.60 (-1.01%)
1D
Last updated 02 Nov, 2026, 15:57 IST

Mahanagar Gas Share Price Today

As of 3 Nov 2026, Mahanagar Gas share price is ₹1,037.90. The stock opened at ₹1,041.00, compared to its previous close of ₹1,048.50. During today's trading session, Mahanagar Gas share price moved in the range of ₹1,020.00 to ₹1,044.80, with an average price of ₹1,032.40 for the day. Looking at its last 52-week, the stock has touched a low of ₹900.00 and a high of ₹1,284.00. On the performance front, Mahanagar Gas share price has declined by 8.61% over the last six months and is down 18.72% on a year-on-year basis.

Share price over the last 1 day fell from 1037.20 to 1035.90, ranging between 1020.90 and 1043.20.

₹1,020.00
1.01% down today
₹1,044.80
1D LOW
1D HIGH

Mahanagar Gas Stock Insights

Latest Earning
Op Profit TrendUp by 46.32% QoQ
Latest Earning
Net Profit TrendUp by 48.61% QoQ
Latest Earning
Revenue TrendUp by 15.47% QoQ
Stock Performance
UnderperformingUnderperforming Nifty by 7.39 % in last 1 yr
Shareholding Pattern
DIIDII decreased stake by 9.41%
Shareholding Pattern
FIIFII increased stake by 1.06%
Mahanagar Gas stock performance
Open₹1,041.00
High₹1,044.80
Low₹1,020.00
Prev. close₹1,048.50
Mahanagar Gas trading activity
Volume2,13,461
Average traded price₹1,035.64
Last traded time03:57:54 02 Nov
Last traded quantity1

Circuit
L
H
₹830.40
₹1,245.40
52-week
L
H
₹900.00
₹1,284.00
Mkt Cap Cr
10,324.25

P/E
14.36

P/B
1.6

ROA
7.96%
ROE
13.09%

ROCE
17.37%

Quick Ratio
0.91

EV/EBITDA
7.44

Based on fundamentals, this stock's

Performance: 3 out of 5, Neutral
Performance
Neutral
Mahanagar Gas performance is moderate compared to markets
Valuation: 3 out of 5, Fairly Valued
Valuation
Fairly Valued
Mahanagar Gas appears to be fairly valued compared to its peers
Earnings: 4 out of 5, Good
Earnings
Good
Mahanagar Gas revenue, operating profit and net profit are growing
Peer Comparison
Peer comparison — key ratios
NameMkt Cap CrP/EP/BROAROEROCEQuick RatioEV/EBITDA
GAIL1,10,461.678.761.148.14%13.05%14.0%0.636.21
Adani Total Gas58,757.3594.0611.676.38%12.4%12.89%0.5947.47
Petronet LNG43,297.509.721.8613.58%17.56%21.47%5.265.43
Gujarat Gas20,190.7311.841.16.19%10.95%12.37%1.666.57
Indraprastha Gas19,481.0214.391.695.47%8.66%11.02%1.149.08
GSPL TRANSMISSION LIMITED3,574.668.810.514.14%4.3%6.47%3.080.0
IRM Energy992.6210.850.896.52%8.18%12.23%—4.3
POSITRON ENERGY LIMITED152.777.851.5934.83%85.51%65.0%2.090.33
AXIOM GAS ENGINEERING LTD134.310.00.015.42%33.09%25.32%1.080.0

Auto-generated based on historical fundamentals; not a recommendation to buy/sell.

Mahanagar Gas Company Background

ISIN
INE002S01010
Sector Market Cap
₹ 10,324.25 Cr

Mahanagar Gas Limited (MGL) is a major natural gas distribution company in India. Formed in 1995, Mahanagar Gas has GAIL Limited and the Government of Maharashtra as its promotors. The company is known for pioneering the natural gas distribution network in Mumbai and its adjoining regions. It is the only distributor of Compressed Natural Gas (CNG) and Piped Natural Gas (PNG) in Mumbai, Thane and Raigad district in Maharashtra.

The market capitalisation of Mahanagar Gas Limited is over ₹12,400 crore as of January 12, 2024. Mahanagar Gas share price has gained over 12% in the last three years.

Business operations

Mahanagar Gas caters to a diverse customer base through its CNG and PNG services. With a substantial CNG customer base of 9.2 lakh and an active PNG customer base of 15.1 lakh, Mahanagar Gas plays a crucial role in providing clean and efficient energy solutions.

The company has an extensive gas pipeline network, spanning over 6,500 kilometers, utilising both steel and polyethylene materials. This infrastructure facilitates domestic connectivity for a staggering 2.17 million households. Mahanagar Gas also operates 1,909 CNG dispensing points, enhancing its accessibility to eco-friendly fueling solutions.

It manages five city gate stations strategically situated in Sion (Mumbai), Mahape (Navi Mumbai), Ambernath (Thane), Taloja (Raigad) and Savroli (Raigad). In total, Mahanagar Gas maintains 31 offices to facilitate its business operations.

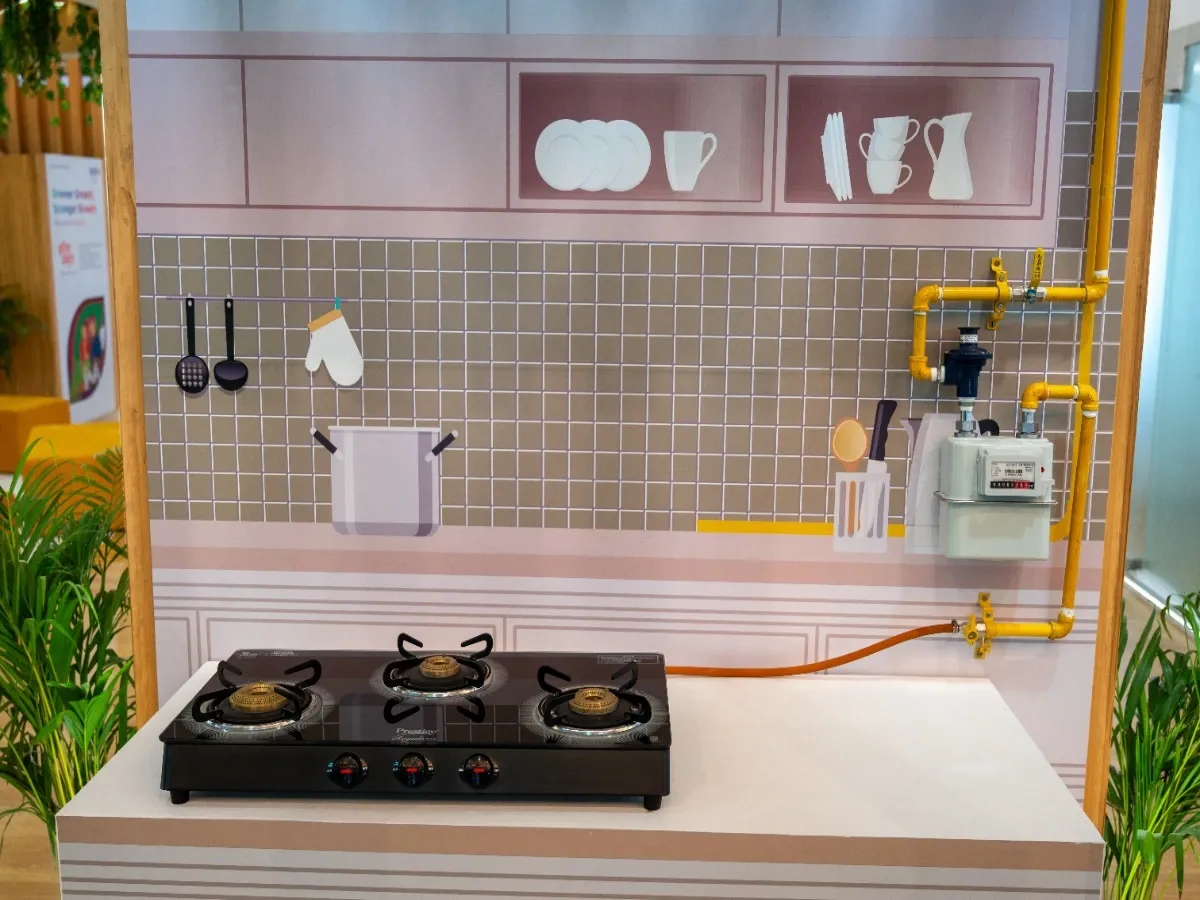
Mahanagar Gas’ extensive network in Mumbai, its adjoining areas and Raigad district spans 6,742 kilometres and consists of both carbon steel and polyethene pipelines, connecting over 23.72 lakh domestic customers. The domestic PNG provided through this network serves various purposes including cooking and water heating.

The PNG and CNG business segments are the core of Mahanagar Gas’ business. In FY23, the company commissioned a medium-density polyethylene line to Maharashtra's Raj Bhavan premises. The company reached an unprecedented connectivity milestone by servicing 3,05,030 domestic households. There were the highest-ever domestic PNG conversions totalling 1,38,000, illustrating a strong customer preference for sustainable energy solutions.

A strategic Memorandum of Understanding (MoU) was established with the Indian Navy to provide PNG connections, enriching the lives of approximately 8000 armed forces households and other defence establishments. Mahanagar Gas has plans to add 200 CNG stations within the next five years.

When it comes to the CNG segment, in December 2022, Mahanagar Gas Limited inaugurated the 300th CNG station, contributing to a total of 313 CNG stations by the conclusion of FY 23. To enhance infrastructure further, it has undertaken lease agreements with City and Industrial Development Corporation, Maharashtra Industrial Development Corporation, Maharashtra State Road Transport Corporation and the Government of Maharashtra for the development of additional Mahanagar Gas-owned CNG stations in the future.

Mahanagar Gas had ׁ509 employees of which 49 (around 10%) were women employees as of March 31, 2023.

Mahanagar Gas Financial Highlights

  • Revenue: Mahanagar Gas reported revenue of ₹8,365.57 crore in FY26 vs ₹7,430.39 crore in FY25. It showed an increase of 12.59% on a yearly basis.
  • Operating Profit: Mahanagar Gas reported an operating profit of ₹1,134.59 crore in FY26 vs ₹1,369.59 crore in FY25. It showed a decrease of 17.16% on a year-on-year basis.
  • Net Profit: Mahanagar Gas reported a net profit of ₹840.56 crore in FY26 vs ₹1,040.15 crore in FY25. It showed a decrease of 19.19% on a yearly basis.

Mahanagar Gas Quarterly Result Highlights

  • Mahanagar Gas reported revenue of ₹2,403.15 crore in Jun 2026, compared with ₹2,081.15 crore in Mar 2026, representing an increase of 15.47% on a quarter-on-quarter (QoQ) basis.
  • Mahanagar Gas reported an operating profit of ₹258.01 crore in Jun 2026, compared with ₹176.33 crore in Mar 2026, representing an increase of 46.32% on a quarter-on-quarter (QoQ) basis.
  • Mahanagar Gas reported a profit of ₹192.64 crore in Jun 2026, compared with ₹129.63 crore in Mar 2026, reflecting an increase of 48.61% on a QoQ basis.
  • The earnings per share (EPS) of Mahanagar Gas stood at ₹85.15 during Jun 2026.

Data Source: BSE, Company announcements

Securities shown are illustrative, not recommendations. Past performance does not guarantee future results.

Promoters
32.50%
FII
23.46%
Other DII
10.28%
Retail and other
21.78%
Mutual funds
11.98%
Foreign Institutional Investor (FII)
FII shareholding by period
Dec 202524.89%
Mar 202624.14%
Jun 202623.21%
Sep 202623.46%

Mahanagar Gas Investment Returns

1 day
-1.01%

1 week
+0.16%

1 month
-0.72%

1 year
-18.72%

3 years
+0.31%

5 years
+2.15%

Mahanagar Gas Share Price History

Mahanagar Gas share price history by day, showing open and close prices and the percentage change
Day
Open / Close
Change %
02 Nov 26
₹1,041.00 / ₹1,037.90
-1.01%
30 Oct 26
₹1,043.10 / ₹1,048.50
-0.43%
29 Oct 26
₹1,050.10 / ₹1,053.00
+0.02%
28 Oct 26
₹1,041.60 / ₹1,052.80
+0.15%
Show more

Mahanagar Gas Financials

Full statement

Income Statement · Consolidated

Income Statement · Consolidated — all values in INR Crore
ParticularsMar 2026Mar 2025Mar 2024Mar 2023
Revenue₹8,245.70₹7,263.80₹6,290.10₹6,299.28
Other Income₹119.87₹166.59₹174.87₹111.88
Total Revenue₹8,365.57₹7,430.39₹6,464.97₹6,411.16
Total Expenses₹7,225.95₹6,059.94₹4,736.86₹5,355.62
Profit Before Tax₹1,134.59₹1,369.59₹1,728.11₹1,055.54
Tax₹294.04₹329.44₹443.42₹265.49
Profit After Tax₹840.55₹1,040.15₹1,284.69₹790.05
EPS - Basic₹85.15₹105.31₹130.06₹79.98
EPS - Diluted₹85.15₹105.31₹130.06₹79.98

Cash Flow · Consolidated

Cash Flow · Consolidated — all values in INR Crore
ParticularsMar 2026Mar 2025Mar 2024Mar 2023
Profit before tax₹1,134.59₹1,369.59₹1,728.11₹1,055.54
Income before WC changes₹1,491.76₹1,615.03₹1,898.16₹1,219.68
Change in Assets-₹116.91-₹127.50-₹0.22-₹231.30
Change in Liabilities₹52.98₹187.83₹94.18₹244.70
Change in WC-₹63.93₹60.33₹93.96₹13.40
Cash flow from Operations₹1,162.29₹1,406.61₹1,567.87₹969.30
Cash flow from Investing-₹888.26-₹1,052.72-₹1,081.95-₹649.09
Cash flow from Financing-₹368.58-₹331.51-₹499.25-₹284.79
Total Cash Flow-₹94.55₹22.38-₹13.33₹35.42
Cash (Start of the year)₹151.75₹129.37₹117.90₹82.48
Cash (End of the year)₹57.20₹151.75₹129.37₹117.90

Balance Sheet · Consolidated

Balance Sheet · Consolidated — all values in INR Crore
ParticularsMar 2026Mar 2025Mar 2024Mar 2023
Non-Current Assets₹7,144.61₹6,355.15₹5,345.80₹4,026.09
Current Assets₹1,836.51₹1,946.38₹1,907.60₹2,006.22
Total Assets₹8,981.12₹8,301.53₹7,253.40₹6,032.31
Current Liabilities₹1,958.54₹1,874.97₹1,699.78₹1,561.17
Net Current Asset-₹122.03₹71.41₹207.82₹445.05
Non-Current Liabilities₹580.99₹534.49₹410.31₹336.92
Equity Capital₹6,441.59₹5,892.07₹5,143.31₹4,134.22
Total Equity & Liabilities₹8,981.12₹8,301.53₹7,253.40₹6,032.31

Income Statement · Standalone

Income Statement · Standalone — all values in INR Crore
ParticularsMar 2026Mar 2025Mar 2024Mar 2023
Revenue₹8,240.21₹7,261.25₹6,244.53₹6,299.28
Other Income₹119.20₹166.04₹175.30₹111.88
Total Revenue₹8,359.41₹7,427.29₹6,419.83₹6,411.16
Total Expenses₹7,218.89₹6,056.67₹4,687.07₹5,355.62
Profit Before Tax₹1,140.52₹1,370.62₹1,732.76₹1,055.54
Tax₹293.70₹329.36₹443.69₹265.49
Profit After Tax₹846.82₹1,041.26₹1,289.07₹790.05
EPS - Basic₹85.73₹105.41₹130.50₹79.98
EPS - Diluted₹85.73₹105.41₹130.50₹79.98

Cash Flow · Standalone

Cash Flow · Standalone — all values in INR Crore
ParticularsMar 2026Mar 2025Mar 2024Mar 2023
Profit before tax₹1,140.52₹1,370.62₹1,732.76₹1,055.54
Income before WC changes₹1,492.26₹1,615.11₹1,896.41₹1,219.68
Change in Assets-₹128.70-₹114.31₹15.29-₹231.30
Change in Liabilities₹49.43₹187.56₹75.37₹244.70
Change in WC-₹79.27₹73.25₹90.66₹13.40
Cash flow from Operations₹1,147.45₹1,419.61₹1,563.10₹969.30
Cash flow from Investing-₹874.43-₹1,056.07-₹1,266.75-₹649.09
Cash flow from Financing-₹368.14-₹341.05-₹311.56-₹284.79
Total Cash Flow-₹95.12₹22.49-₹15.21₹35.42
Cash (Start of the year)₹151.68₹129.19₹117.90₹82.48
Cash (End of the year)₹56.56₹151.68₹102.69₹117.90

Balance Sheet · Standalone

Balance Sheet · Standalone — all values in INR Crore
ParticularsMar 2026Mar 2025Mar 2024Mar 2023
Non-Current Assets₹7,134.74₹6,355.36₹5,364.99₹4,026.09
Current Assets₹1,830.50₹1,929.13₹1,861.00₹2,006.22
Total Assets₹8,965.24₹8,284.49₹7,225.99₹6,032.31
Current Liabilities₹1,954.55₹1,874.48₹1,669.96₹1,561.17
Net Current Asset-₹124.05₹54.65₹191.04₹445.05
Non-Current Liabilities₹576.43₹531.54₹413.16₹336.92
Equity Capital₹6,434.26₹5,878.47₹5,142.87₹4,134.22
Total Equity & Liabilities₹8,965.24₹8,284.49₹7,225.99₹6,032.31
* All values are in INR Crore
Mahanagar Gas market depth
Bid quantityBid priceAsk priceAsk quantity
001037.915
0000
0000
0000
0000
Total bid quantity0
Total ask quantity15
Mahanagar Gas technical summary
Bearish indicators2
Neutral indicators5
Bullish indicators1
OverallSlightly Bearish
by SEBI experts

Expert Pick

EXPPICK
Stop-loss
Stop-loss is locked. Sign in to view.
Entry price
Entry price is locked. Sign in to view.
Target
Target is locked. Sign in to view.
Indicator
Value
Verdict

RSI (14)
48.74
Neutral

ATR (14)
22.37
Neutral

STOCH(9,6)
74.29
Neutral

STOCH RSI (14)
89.4
Bearish

ADX(9)
20.56
Bearish

UO(9)
57.58
Neutral

ROC(12)
2.57
Bullish

WillR(14)
-25.71
Neutral
Period
Simple value
Exponential vaue

5D
1048.34
1047.84

10D
1044.34
1045.43

20D
1041.33
1047.61

50D
1068.54
1064.36

100D
1098.29
1080.03
Volume trend — traded volume by day
2 Nov2L
30 Oct1L
29 Oct0L
28 Oct0L
27 Oct1L
Average1L

Technical indicators used here are for indicative purposes only. Kindly do not treat it as an investment or trading advice

Compare against other stocks

Mahanagar Gas
Gas Transmission
Add Stock
Add Another

Mutual Funds Invested in Mahanagar Gas

Fund name
AUM
Tata Resources & Energy Fund
2.17%

DSP Nifty Smallcap250 Quality 50 Index Fund
1.88%

Tata Retirement Savings Progressive Fund
1.66%

Mahanagar Gas Returns Calculator

Ex-date: 18 Aug 2026

Ex-date: 13 Feb 2026

Mahanagar Gas Latest News

2 months ago
Mahanagar Gas hikes CNG price by ₹2/kg, PNG by ₹1 amid West Asia crisis
2 months ago
MGL, IGL, Adani Total Gas: CGD stocks rally as Centre unveils domestic PNG incentive scheme; key details
2 months ago
Govt approves incentive scheme to boost domestic PNG connections
5 months ago
Indraprastha Gas hikes CNG prices by ₹2 per kg in Delhi, IGL stock rally 6%, MGL and Adani Total Gas jump up to 8%
5 months ago
Mahanagar Gas withdraws support schemes, subsidies for commercial users amid West Asia conflict
5 months ago
Switching to PNG? Govt now lets you restore LPG connection later
Showing news item 1 of 6

Mahanagar Gas Share Price FAQs


Please be aware that Mahanagar Gas stock prices are subject to continuous fluctuations due to various factors.