GAIL Share Price

₹ 177.00

+₹9.09 (5.41%)
1D
Last updated 02 Nov, 2026, 15:59 IST
NSE: GAIL
|
Gases & Fuels

GAIL Share Price Today

As of 3 Nov 2026, GAIL share price is ₹177.00. The stock opened at ₹170.91, compared to its previous close of ₹167.91. During today's trading session, GAIL share price moved in the range of ₹168.78 to ₹177.40, with an average price of ₹173.09 for the day. Looking at its last 52-week, the stock has touched a low of ₹134.36 and a high of ₹186.87. On the performance front, GAIL share price has increased by 8.44% over the last six months and is down 3.15% on a year-on-year basis.

Share price over the last 1 day rose from 169.84 to 177.00, ranging between 169.84 and 177.37.

₹168.78
5.41% up today
₹177.40
1D LOW
1D HIGH

GAIL Stock Insights

Latest Earning
Op Profit TrendDown by 2.67% QoQ
Latest Earning
Net Profit TrendUp by 1.13% QoQ
Latest Earning
Revenue TrendUp by 14.47% QoQ
Stock Performance
OutperformingBeat Nifty by 6.51 % in last 6 month
Shareholding Pattern
PromoterPromoter increased stake by 0.13%
Shareholding Pattern
DIIDII increased stake by 1.00%
Shareholding Pattern
FIIFII increased stake by 10.65%
Technical Indicators
Volume SpikeVolume is 67.0% above 20-day average on 1 Day interval.
Technical Indicators
MACD CrossThe MACD line crossed above the signal line on 1 Day interval.
GAIL stock performance
Open₹170.91
High₹177.40
Low₹168.78
Prev. close₹167.91
GAIL trading activity
Volume1,34,14,848
Average traded price₹174.85
Last traded time03:59:33 02 Nov
Last traded quantity1

Circuit
L
H
₹170.93
₹181.49
52-week
L
H
₹134.36
₹186.87
Mkt Cap Cr
1,10,461.67

P/E
8.76

P/B
1.14

ROA
8.14%
ROE
13.05%

ROCE
14.0%

Quick Ratio
0.63

EV/EBITDA
6.21

Based on fundamentals, this stock's

Performance: 3 out of 5, Neutral
Performance
Neutral
GAIL (India) performance is moderate compared to markets
Valuation: 3 out of 5, Fairly Valued
Valuation
Fairly Valued
GAIL (India) appears to be fairly valued compared to its peers
Earnings: 3 out of 5, Neutral
Earnings
Neutral
GAIL (India) earnings growth is positive
Peer Comparison
Peer comparison — key ratios
NameMkt Cap CrP/EP/BROAROEROCEQuick RatioEV/EBITDA
Adani Total Gas58,757.3591.4811.356.38%12.4%12.89%0.5947.47
Petronet LNG43,297.5010.291.9414.92%17.56%21.47%5.265.43
Gujarat Gas19,533.9711.451.066.19%10.95%12.37%1.666.57
Indraprastha Gas19,481.0214.391.695.47%8.66%11.02%1.149.08
Mahanagar Gas10,324.2514.451.617.96%13.09%17.37%0.917.44
GSPL TRANSMISSION LIMITED3,574.668.810.514.14%4.3%6.47%3.080.0
IRM Energy992.6213.581.06.52%8.18%12.23%—4.3
POSITRON ENERGY LIMITED152.777.621.5534.83%85.51%65.0%2.090.33
AXIOM GAS ENGINEERING LTD134.310.00.015.42%33.09%25.32%1.080.0

Auto-generated based on historical fundamentals; not a recommendation to buy/sell.

GAIL Company Background

ISIN
INE129A01019
Sector Market Cap
₹ 110,461.67 Cr

Established in: 1984 Managing Director: Deepak Gupta

GAIL (India) Limited is India’s leading natural gas company and was established on August 16, 1984. It is headquartered at GAIL Bhawan in New Delhi, India. GAIL is a state-owned energy sector company that primarily focuses on producing, trading, transmitting, and distributing natural gas.

GAIL Ltd was formerly founded as the ‘Gas Authority of India Limited’ by the Ministry of Petroleum and Natural Gas to build, operate and maintain the HVJ Gas Pipeline. In 2002, the company name was updated to ensure it reflects the company’s business transformation as it expanded its business segments

The GAIL (India) Limited launched its IPO in 2004 with an issue size of around ₹1,649 crore and a price of ₹ 195 per share. GAIL is listed on both Indian stock exchanges, NSE and BSE. In 2013, GAIL Ltd was awarded the ‘Maharatna’ status by the Government of India, making it one of the 14 public sector companies with that status.

History of GAIL (India) Limited

GAIL Ltd was established in August 1984 under the Ministry of Petroleum & Natural Gas (PSU) with the aim of building, operating, and maintaining the HVJ gas pipeline. The HVJ pipeline was a 1,750 km-long pipeline, making it one of the largest gas pipeline projects in the world. The HVJ pipeline construction was started in 1987 and was completed by 1989.

On 6th December 1994, GAIL Ltd entered into a joint venture agreement with British Gas to establish Mahanagar Gas Limited to execute the Bombay City Gas Distribution project. In the following years, the company was awarded the status of ‘Navratna’ by the Government of India for its ‘excellent track record’ and ‘potential to become a global giant’.

In 1997, GAIL (India) Limited started the city gas distribution pilot project in New Delhi and set up nine compressed natural gas stations. Later, GAIL entered into a joint venture with Bharat Petroleum and the Government of Delhi to establish Indraprastha Gas to set up the Delhi gas distribution network.

In the following years, GAIL diversified into petrochemicals, telecom and liquidity hydrocarbons along with gas infrastructure. The company has entered the power, liquefied natural gas (LNG), regasification, city gas distribution and exploration and production by entering into equity and joint ventures. Due to the additional ventures, the Gas Authority of India was renamed GAIL (India) Limited on 22nd November, 2002.

Business Segments of Gail (India) Limited

The following are the business segments of Gail (India) Limited.

Natural Gas Transmission

Natural gas transmission is the core operation of the company and holds a significant market share in India. It operates a network of over 18,400 km of natural gas pipelines across the country and connects major gas sources to areas with high industrial and consumer demand.

Natural Gas Marketing

GAIL is a leading natural gas marketer. It procures gas from domestic producers and international companies with long-term (Sales and Purchase Agreements). The company manages a large portfolio of Liquefied Natural Gas, which includes shipping, regasification, and global trading, carried out by its subsidiary company.

Petrochemical

The company operates one of India’s largest integrated petrochemical complexes in Uttar Pradesh. It produces polymer, which is used in plastic manufacturing and holds equity in major petrochemical companies.

LPG & Liquid Hydrocarbons

The company operates 5 gas processing units (GPUs) that produce LPG, propane, Pentane, and Naphtha. GAIL Ltd also transmits LPG via its 2,040 km pipeline.

City Gas Distribution

GAIL offers gas connectivity to domestic, commercial and transport sectors, which is managed by its subsidiary. The company entered into various joint ventures to supply Piped Natural Gas (PNG) and Compressed Natural Gas (CNG) to households and vehicles.

Emerging Segments Gail is moving toward clean energy and entering the renewable energy sector. The company currently has an installed capacity of 145 MW, consisting of 118 MW of wind and 27 MW of solar energy.

Subsidiaries of GAIL India Limited

The following are the subsidiaries of Gail (India) Limited.

  • GAIL Gas Limited
  • Brahmaputra Cracker and Polymer Limited (BCPL)
  • GAIL Mangalore Petrochemicals Limited (GMPL)
  • Konkan LNG Limited (KLL)
  • GAIL Global (Singapore) Pte Limited
  • GAIL Global (USA) Inc. (GGUI)
  • GAIL Global (USA) LNG LLC
  • Joint Ventures & Associates of Gail (India) Limited

The following are the joint ventures of Gail (India) Limited.

  • Indraprastha Gas Limited (IGL)Mahanagar Gas Limited (MGL)
  • Petronet LNG Limited (PLL)
  • ONGC Petro-additions Limited (OPaL)
  • Tripura Natural Gas Company Limited (TNGCL)
  • Bengal Gas Company Limited

GAIL Financial Highlights

  • Revenue: GAIL reported revenue of ₹1,43,107.86 crore in FY26 vs ₹1,43,171.13 crore in FY25. It showed a decrease of 0.04% on a yearly basis.
  • Operating Profit: GAIL reported an operating profit of ₹9,725.22 crore in FY26 vs ₹16,095.51 crore in FY25. It showed a decrease of 39.58% on a year-on-year basis.
  • Net Profit: GAIL reported a net profit of ₹7,581.52 crore in FY26 vs ₹12,462.87 crore in FY25. It showed a decrease of 39.17% on a yearly basis.

GAIL Quarterly Result Highlights

  • GAIL reported revenue of ₹47,311.99 crore in Sep 2026, compared with ₹41,330.08 crore in Jun 2026, representing an increase of 14.47% on a quarter-on-quarter (QoQ) basis.
  • GAIL reported an operating profit of ₹6,100.28 crore in Sep 2026, compared with ₹6,267.56 crore in Jun 2026, representing a decrease of 2.67% on a quarter-on-quarter (QoQ) basis.
  • GAIL reported a profit of ₹4,723.75 crore in Sep 2026, compared with ₹4,670.99 crore in Jun 2026, reflecting an increase of 1.13% on a QoQ basis.
  • The earnings per share (EPS) of GAIL stood at ₹11.53 during Sep 2026.

Data Source: BSE, Company announcements

Securities shown are illustrative, not recommendations. Past performance does not guarantee future results.

Promoters
51.85%
FII
16.59%
Other DII
10.88%
Retail and other
13.57%
Mutual funds
7.10%
Foreign Institutional Investor (FII)
FII shareholding by period
Dec 202514.07%
Mar 202613.04%
Jun 202614.99%
Sep 202616.59%

GAIL Investment Returns

1 day
+5.41%

1 week
+5.18%

1 month
+3.38%

1 year
-3.15%

3 years
+45.02%

5 years
+75.89%

GAIL Share Price History

GAIL share price history by day, showing open and close prices and the percentage change
Day
Open / Close
Change %
02 Nov 26
₹170.91 / ₹177.00
+5.41%
30 Oct 26
₹165.99 / ₹167.91
+1.66%
29 Oct 26
₹165.00 / ₹165.17
+0.24%
28 Oct 26
₹166.58 / ₹164.78
-0.54%
Show more

GAIL Financials

Full statement

Income Statement · Consolidated

Income Statement · Consolidated — all values in INR Crore
ParticularsMar 2026Mar 2025Mar 2024Mar 2023
Revenue₹141,597.72₹141,901.69₹133,228.46₹145,668.30
Other Income₹1,510.14₹1,269.44₹1,007.81₹1,328.47
Total Revenue₹143,107.86₹143,171.13₹134,236.27₹146,996.77
Total Expenses₹134,886.85₹131,018.89₹123,323.34₹141,248.45
Profit Before Tax₹9,725.22₹16,095.51₹12,595.01₹7,256.38
Tax₹2,143.70₹3,632.64₹2,692.20₹1,660.49
Profit After Tax₹7,581.52₹12,462.87₹9,902.81₹5,595.89
EPS - Basic₹11.53₹18.93₹15.06₹8.52
EPS - Diluted₹11.53₹18.93₹15.06₹8.52

Cash Flow · Consolidated

Cash Flow · Consolidated — all values in INR Crore
ParticularsMar 2026Mar 2025Mar 2024Mar 2023
Profit before tax₹9,725.22₹16,095.51₹12,595.01₹7,256.38
Income before WC changes₹12,380.80₹18,069.78₹14,691.13₹8,247.54
Change in Assets₹1,762.41-₹672.38₹1,380.67-₹4,685.46
Change in Liabilities-₹1,117.06₹820.17-₹211.97₹1,256.37
Change in WC₹645.35₹147.79₹1,168.70-₹3,429.09
Cash flow from Operations₹11,248.65₹15,727.27₹12,585.72₹3,204.69
Cash flow from Investing-₹9,153.88-₹6,730.01-₹8,273.42-₹7,640.12
Cash flow from Financing-₹2,750.10-₹8,940.86-₹3,457.39₹2,972.06
Total Cash Flow-₹655.33₹56.40₹854.91-₹1,463.37
Cash (Start of the year)₹1,317.18₹1,146.03₹243.77₹1,519.80
Cash (End of the year)₹959.23₹1,317.18₹1,146.03₹243.77

Balance Sheet · Consolidated

Balance Sheet · Consolidated — all values in INR Crore
ParticularsMar 2026Mar 2025Mar 2024Mar 2023
Non-Current Assets₹120,774.88₹110,600.16₹104,445.42₹87,250.06
Current Assets₹19,761.71₹22,548.57₹20,271.81₹20,530.69
Total Assets₹140,536.59₹133,148.73₹124,717.23₹107,780.75
Current Liabilities₹23,281.41₹22,480.84₹21,640.54₹21,711.02
Net Current Asset-₹3,519.70₹67.73-₹1,368.73-₹1,180.33
Non-Current Liabilities₹27,963.52₹25,427.41₹25,880.91₹20,962.75
Equity Capital₹89,291.66₹85,240.48₹77,195.78₹65,106.98
Total Equity & Liabilities₹140,536.59₹133,148.73₹124,717.23₹107,780.75

Income Statement · Standalone

Income Statement · Standalone — all values in INR Crore
ParticularsMar 2026Mar 2025Mar 2024Mar 2023
Revenue₹138,600.95₹137,207.78₹130,573.05₹144,249.68
Other Income₹2,786.77₹2,401.25₹2,207.89₹2,684.70
Total Revenue₹141,387.72₹139,609.03₹132,780.94₹146,934.38
Total Expenses₹132,424.05₹127,224.50₹121,226.38₹140,350.57
Profit Before Tax₹8,963.67₹14,824.56₹11,554.56₹6,583.81
Tax₹1,995.37₹3,512.24₹2,718.08₹1,282.30
Profit After Tax₹6,968.30₹11,312.32₹8,836.48₹5,301.51
EPS - Basic₹10.60₹17.20₹13.44₹8.04
EPS - Diluted₹10.60₹17.20₹13.44₹8.04

Cash Flow · Standalone

Cash Flow · Standalone — all values in INR Crore
ParticularsMar 2026Mar 2025Mar 2024Mar 2023
Profit before tax₹8,963.67₹14,824.56₹11,554.56₹6,583.81
Income before WC changes₹11,152.41₹17,034.02₹14,041.58₹7,418.98
Change in Assets₹1,710.28-₹136.96₹861.13-₹4,330.35
Change in Liabilities-₹1,296.86₹1,016.49-₹306.33₹1,237.14
Change in WC₹413.42₹879.53₹554.80-₹3,093.21
Cash flow from Operations₹9,879.46₹15,560.45₹11,848.19₹2,808.01
Cash flow from Investing-₹7,746.26-₹6,048.08-₹8,002.40-₹6,553.33
Cash flow from Financing-₹2,290.10-₹9,211.84-₹3,430.97₹2,551.53
Total Cash Flow-₹156.90₹300.53₹414.82-₹1,193.79
Cash (Start of the year)₹889.12₹588.59₹173.77₹1,367.56
Cash (End of the year)₹732.22₹889.12₹588.59₹173.77

Balance Sheet · Standalone

Balance Sheet · Standalone — all values in INR Crore
ParticularsMar 2026Mar 2025Mar 2024Mar 2023
Non-Current Assets₹104,731.49₹95,603.99₹91,000.48₹77,378.19
Current Assets₹17,835.04₹20,297.59₹18,527.97₹18,753.39
Total Assets₹122,566.53₹115,901.58₹109,528.45₹96,131.58
Current Liabilities₹21,485.11₹20,954.72₹20,204.44₹20,369.52
Net Current Asset-₹3,650.07-₹657.13-₹1,676.47-₹1,616.13
Non-Current Liabilities₹27,007.15₹24,383.17₹25,144.61₹20,108.39
Equity Capital₹74,074.27₹70,563.69₹64,179.40₹55,653.67
Total Equity & Liabilities₹122,566.53₹115,901.58₹109,528.45₹96,131.58
* All values are in INR Crore
GAIL market depth
Bid quantityBid priceAsk priceAsk quantity
0017710104
0000
0000
0000
0000
Total bid quantity0
Total ask quantity10,104
GAIL technical summary
Bearish indicators3
Neutral indicators5
Bullish indicators0
OverallSlightly Bearish
by SEBI experts

Expert Pick

EXPPICK
Stop-loss
Stop-loss is locked. Sign in to view.
Entry price
Entry price is locked. Sign in to view.
Target
Target is locked. Sign in to view.
Indicator
Value
Verdict

RSI (14)
48.75
Neutral

ATR (14)
3.95
Neutral

STOCH(9,6)
72.1
Neutral

STOCH RSI (14)
100
Bearish

ADX(9)
33.45
Bearish

UO(9)
52.54
Neutral

ROC(12)
-0.23
Bearish

WillR(14)
-27.9
Neutral
Period
Simple value
Exponential vaue

5D
166.36
166.47

10D
166.69
166.77

20D
167.71
167.82

50D
170.97
169.82

100D
172.28
169.83
Volume trend — traded volume by day
2 Nov1Cr
30 Oct1Cr
29 Oct57L
28 Oct38L
27 Oct1Cr
Average99L

Technical indicators used here are for indicative purposes only. Kindly do not treat it as an investment or trading advice

Compare against other stocks

GAIL
Gases & Fuels
Add Stock
Add Another

Mutual Funds Invested in GAIL

Fund name
AUM
SBI PSU
9.05%

SBI Energy Opportunities Fund
6.78%

Motilal Oswal Enhanced Value Index Fund
5.34%

GAIL Returns Calculator

Ex-date: 02 Sep 2026

Ex-date: 05 Feb 2026

GAIL Latest News

2 months ago
IndiGo, Asian Paints, Indian Oil, BPCL: Oil-sensitive stocks tumble as crude oil prices hit 7-day high above $91/barrel

2 months ago
Upcoming dividends, stock splits, bonuses this week: NTPC, Coal India, ONGC, Glenmark Pharma, GAIL, Indigo Paints, P&G, among others in focus
3 months ago
GAIL shares tumble over 5% despite three-folds QoQ surge in Q1 profit to ₹4,292 crore; check June quarter performance
3 months ago
GAIL India Q1 results: Net profit jumps 240% QoQ to ₹4,292 crore on strong margin growth; revenue rises 12%

3 months ago
Q3 Results Today: Sun Pharma, GAIL India, IDFC First Bank, Bharat Dynamics, Delhivery, CDSL, others to post earnings on Jan 31; check list
3 months ago
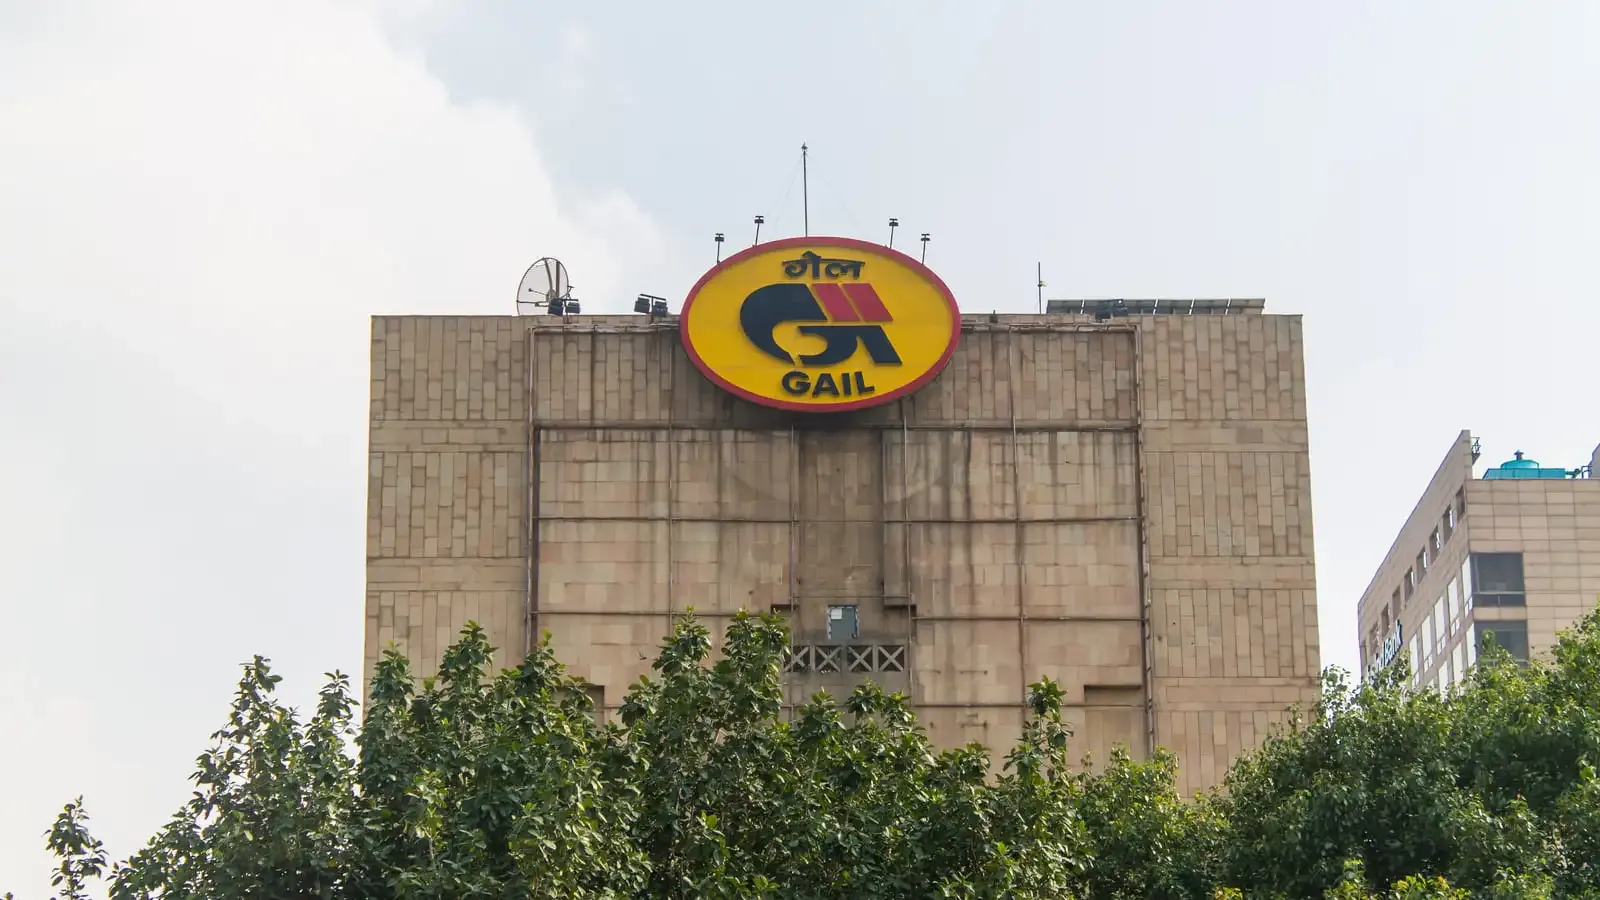
CONCOR, GAIL shares rise 2% on signing 15-year agreement to set up LNG dispensing station in Ahmedabad

4 months ago
US-Iran peace deal: What's next for oil & gas stocks after the Strait of Hormuz reopens?
5 months ago
Stocks to watch, May 22: Hindalco, Maruti, Dalmia Bharat, GAIL India, Honasa Consumer, Nykaa, LIC
5 months ago
GAIL India Q4 results: Standalone net profit declines 21% QoQ; board recommends final dividend for FY26
5 months ago
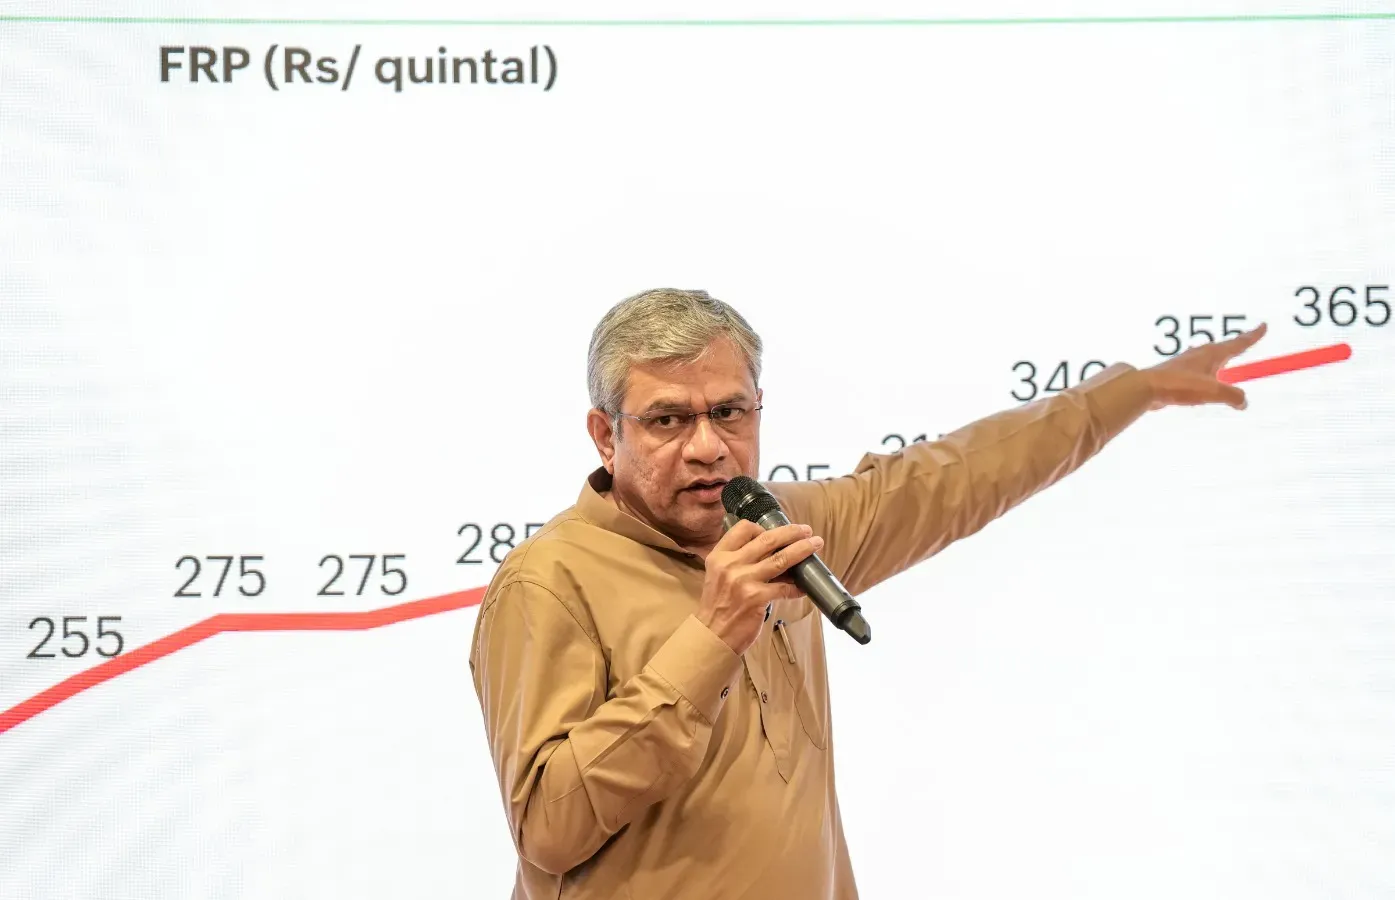
Cabinet clears ₹37,500 crore coal gasification scheme amid govt push to curb import bill
Showing news item 1 of 10


GAIL Share Price FAQs


Please be aware that GAIL stock prices are subject to continuous fluctuations due to various factors.