JBM Auto Share Price
JBM Auto Share Price Today
As of 24 Jul 2026, JBM Auto share price is ₹656.05. The stock opened at ₹652.00, compared to its previous close of ₹659.10. During today's trading session, JBM Auto share price moved in the range of ₹642.90 to ₹658.00, with an average price of ₹650.45 for the day. Looking at its last 52-week, the stock has touched a low of ₹477.00 and a high of ₹790.00. On the performance front, JBM Auto share price has increased by 24.59% over the last six months and is up 2.14% on a year-on-year basis.
JBM Auto Returns Calculator
JBM Auto Shareholder Returns
JBM Auto Share Price History
| Name | Mkt Cap Cr | P/E | P/B | ROE | D/E | ROCE | Book Value | Div. Yield | Turnover | EPS(TTM) |
|---|---|---|---|---|---|---|---|---|---|---|
| Samvardhana Motherson Intl | 1,53,462.00 | 28.72 | 2.69 | 11.90% | 0.18 | 13.26% | 2.88 | 0.57% | 0.27 | 1.70 |
| Bosch | 1,24,484.00 | 30.56 | 5.71 | 14.55% | 0.01 | 20.96% | 5.71 | 0.94% | 1.33 | 939.28 |
| Uno Minda | 65,259.60 | 49.66 | 8.71 | 20.45% | 0.36 | 19.87% | 10.27 | 0.26% | 2.19 | 16.87 |
| Sona BLW Precision Forgings | 44,787.50 | 65.27 | 7.48 | 10.70% | 0.06 | 13.46% | 93.82 | 0.47% | 0.59 | 10.40 |
| Endurance Techno | 38,256.10 | 40.20 | 5.59 | 13.91% | 0.01 | 15.68% | 351.25 | 0.42% | 2.13 | 52.17 |
| Exide Industries | 37,332.00 | 28.66 | 1.76 | 6.18% | 0.03 | 8.69% | 1.67 | 0.69% | 1.14 | 13.07 |
| ZF Steering Gear (India) | 26,936.10 | 51.04 | 7.15 | 14.98% | 0.02 | 19.74% | 7.18 | 0.03% | 1.08 | 267.13 |
| Motherson Sumi | 26,473.60 | 39.24 | 11.32 | 32.39% | 0.13 | 37.42% | 11.32 | 1.57% | 4.78 | 0.94 |
| Craftsman Automation | 24,324.80 | 43.43 | 5.11 | 12.57% | 0.84 | 13.92% | 5.54 | 0.16% | 0.91 | 93.92 |
| TENNECO CLEAN AIR INDIA L | 21,944.00 | 36.32 | 18.33 | 50.41% | 0.00 | 67.99% | 149.60 | 0.00% | 0.38 | 29.80 |
JBM Auto Financials
Income Statement · Consolidated
| Particulars | Mar 2025 | Mar 2024 | Mar 2023 | Mar 2022 |
|---|---|---|---|---|
| Revenue | ₹5,472.33 | ₹5,009.35 | ₹3,857.38 | ₹3,193.05 |
| Other Income | ₹53.58 | ₹20.32 | ₹27.01 | ₹20.99 |
| Total Revenue | ₹5,525.91 | ₹5,029.67 | ₹3,884.39 | ₹3,214.04 |
| Total Expenses | ₹5,217.20 | ₹4,793.66 | ₹3,715.16 | ₹3,017.03 |
| Profit Before Tax | ₹273.19 | ₹246.10 | ₹169.53 | ₹187.04 |
| Tax | ₹58.56 | ₹52.37 | ₹44.40 | ₹30.65 |
| Profit After Tax | ₹214.63 | ₹193.73 | ₹125.13 | ₹156.38 |
| EPS - Basic | ₹8.54 | ₹15.12 | ₹10.52 | ₹13.23 |
| EPS - Diluted | ₹8.54 | ₹15.12 | ₹10.52 | ₹13.23 |
Cash Flow · Consolidated
| Particulars | Mar 2025 | Mar 2024 | Mar 2023 | Mar 2022 |
|---|---|---|---|---|
| Profit before tax | ₹273.19 | ₹246.10 | ₹169.53 | ₹187.04 |
| Income before WC changes | ₹683.44 | ₹590.32 | ₹406.48 | ₹360.01 |
| Change in Assets | -₹508.75 | -₹453.84 | ₹279.21 | -₹545.00 |
| Change in Liabilities | ₹271.84 | ₹115.44 | -₹150.67 | ₹63.20 |
| Change in WC | -₹236.91 | -₹338.40 | ₹128.55 | -₹481.80 |
| Cash flow from Operations | ₹393.92 | ₹204.80 | ₹484.15 | -₹141.89 |
| Cash flow from Investing | -₹556.08 | -₹442.67 | -₹645.60 | -₹295.42 |
| Cash flow from Financing | ₹224.18 | ₹247.53 | ₹159.12 | ₹453.70 |
| Total Cash Flow | ₹62.03 | ₹9.66 | -₹2.33 | ₹16.39 |
| Cash (Start of the year) | ₹38.69 | ₹29.03 | ₹31.36 | ₹14.97 |
| Cash (End of the year) | ₹100.72 | ₹38.69 | ₹29.03 | ₹31.36 |
Balance Sheet · Consolidated
| Particulars | Mar 2025 | Mar 2024 | Mar 2023 | Mar 2022 |
|---|---|---|---|---|
| Non-Current Assets | ₹2,541.52 | ₹2,237.61 | ₹1,969.62 | ₹1,532.72 |
| Current Assets | ₹3,308.18 | ₹2,627.19 | ₹1,570.50 | ₹1,696.08 |
| Total Assets | ₹5,849.70 | ₹4,864.80 | ₹3,540.12 | ₹3,228.80 |
| Current Liabilities | ₹3,094.72 | ₹2,820.15 | ₹1,738.97 | ₹1,723.13 |
| Net Current Asset | ₹213.46 | -₹192.96 | -₹168.47 | -₹27.04 |
| Non-Current Liabilities | ₹1,368.69 | ₹852.57 | ₹770.32 | ₹609.17 |
| Equity Capital | ₹1,386.28 | ₹1,192.08 | ₹1,030.83 | ₹896.50 |
| Total Equity & Liabilities | ₹5,849.70 | ₹4,864.80 | ₹3,540.12 | ₹3,228.80 |
Income Statement · Standalone
| Particulars | Mar 2025 | Mar 2024 | Mar 2023 | Mar 2022 |
|---|---|---|---|---|
| Revenue | ₹4,777.54 | ₹4,243.54 | ₹3,749.25 | ₹3,168.16 |
| Other Income | ₹59.85 | ₹26.73 | ₹37.90 | ₹24.23 |
| Total Revenue | ₹4,837.39 | ₹4,270.27 | ₹3,787.15 | ₹3,192.39 |
| Total Expenses | ₹4,657.51 | ₹4,188.14 | ₹3,621.19 | ₹3,004.81 |
| Profit Before Tax | ₹179.88 | ₹82.13 | ₹165.97 | ₹187.57 |
| Tax | ₹45.90 | ₹21.30 | ₹44.33 | ₹30.65 |
| Profit After Tax | ₹133.98 | ₹60.83 | ₹121.64 | ₹156.92 |
| EPS - Basic | ₹5.67 | ₹2.57 | ₹10.29 | ₹13.27 |
| EPS - Diluted | ₹5.67 | ₹2.57 | ₹10.29 | ₹13.27 |
Cash Flow · Standalone
| Particulars | Mar 2025 | Mar 2024 | Mar 2023 | Mar 2022 |
|---|---|---|---|---|
| Profit before tax | ₹179.88 | ₹82.13 | ₹165.97 | ₹187.57 |
| Income before WC changes | ₹403.50 | ₹305.74 | ₹345.47 | ₹343.79 |
| Change in Assets | -₹32.08 | -₹10.14 | -₹83.41 | -₹345.44 |
| Change in Liabilities | -₹6.93 | ₹234.28 | -₹149.80 | ₹53.29 |
| Change in WC | -₹39.01 | ₹224.14 | -₹233.21 | -₹292.14 |
| Cash flow from Operations | ₹328.92 | ₹488.95 | ₹61.77 | ₹32.14 |
| Cash flow from Investing | -₹146.43 | -₹310.51 | -₹141.30 | -₹185.64 |
| Cash flow from Financing | -₹125.81 | -₹183.62 | ₹68.48 | ₹165.50 |
| Total Cash Flow | ₹56.68 | -₹5.18 | -₹11.05 | ₹12.00 |
| Cash (Start of the year) | ₹10.64 | ₹15.82 | ₹26.87 | ₹14.87 |
| Cash (End of the year) | ₹67.32 | ₹10.64 | ₹15.82 | ₹26.87 |
Balance Sheet · Standalone
| Particulars | Mar 2025 | Mar 2024 | Mar 2023 | Mar 2022 |
|---|---|---|---|---|
| Non-Current Assets | ₹1,523.93 | ₹1,540.04 | ₹1,314.42 | ₹1,236.92 |
| Current Assets | ₹1,929.52 | ₹1,743.73 | ₹1,741.85 | ₹1,664.43 |
| Total Assets | ₹3,453.45 | ₹3,283.77 | ₹3,056.27 | ₹2,901.35 |
| Current Liabilities | ₹1,745.25 | ₹1,905.72 | ₹1,662.44 | ₹1,672.39 |
| Net Current Asset | ₹184.27 | -₹161.99 | ₹79.41 | -₹7.95 |
| Non-Current Liabilities | ₹548.20 | ₹333.26 | ₹393.52 | ₹338.32 |
| Equity Capital | ₹1,160.00 | ₹1,044.78 | ₹1,000.31 | ₹890.64 |
| Total Equity & Liabilities | ₹3,453.45 | ₹3,283.77 | ₹3,056.27 | ₹2,901.35 |
About JBM Auto
Established in 1983, JBM Auto Ltd has become an important force in the automotive industry, specialising in the manufacturing and sale of sheet metal components, tools, moulds and buses. The company has diversified into different business segments like auto components and systems, buses, electric vehicles (EVs), EV aggregates, EV charging infrastructure and renewables.
The company also offers environment management services under its subsidiary JBM Environment Management Private Limited. This vertical of the company offers waste management services and sustainability solutions in different cities across India.
JBM Auto is a part of the $2.6 billion global conglomerate JBM Group. The group is a leading multinational in the automotive and EV industry globally with operations spread across 25 locations in 10 countries.
JBM Auto, integrating its business in the value chain, now manufactures its own buses and is pioneering the EV ecosystem.
JBM Auto Limited’s market capitalisation stood at over ₹21,300 crore as of January 23, 2024. JBM Auto share price has gained over 1,100% in the last three years.
Business operations
In the auto components and systems segment, JBM Auto is a leading player. The company manufactures and sells a wide range of automotive parts. This segment contributed around 70% of the company’s total revenue.

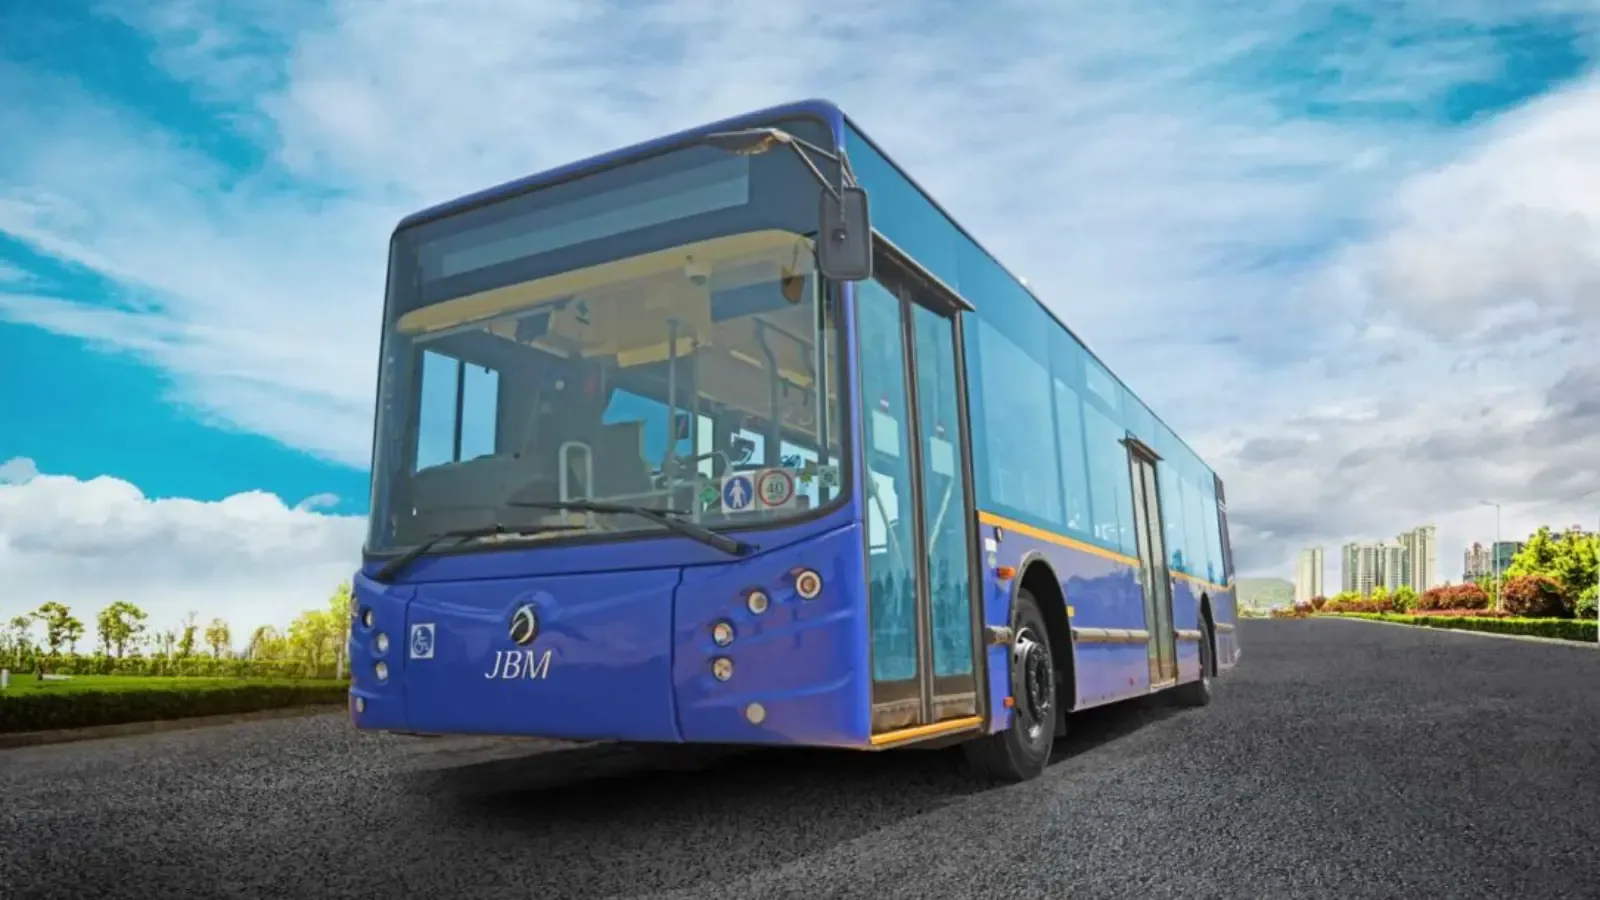
The bus and electric vehicle segment reflect the company’s commitment to sustainable mobility, with significant investments in electric bus product development and R&D. Notable deliverables include electric energy buses to AJL Gujarat, NMMT Navi Mumbai and BMTC Bangalore.
The EV aggregates division supports the focus on electric vehicles by providing the necessary components to increase productivity and efficiency. In addition, JBM Auto has expanded into the EV charging infrastructure sector, in line with the growing demand for electric vehicle charging solutions.
In the renewable energy segment, the company emphasises environmentally friendly practices and renewable energy solutions, while the environmental stewardship segment is firmly committed to clean up the environment through 17 manufacturing plants in Haryana, Uttar Pradesh, Maharashtra, Gujarat, Madhya Pradesh, Rajasthan and Tamil Nadu.
JBM Auto has a strong customer base, which includes industry leaders such as Ashok Leyland, Daimler, Nissan, Renault, Ford, Toyota, Volvo, Volkswagen, Tata, Honda, Escorts, Mahindra, Honda and Force.
The company has diversified into the renewable energy sector through its subsidiary JBM Solar Power Pvt. Ltd. The company offers end-to-end project execution including design engineering, technology management, global partnerships, supply chain management, land management, project financing and customer support for renewable energy players. The company is one of the leading firms in deploying mono-crystalline PV Technology at utility scale and for rooftop solar projects. JBM Solar Power has deployed over 20 solar power projects across India.
JBM Auto Financial Highlights
- Revenue: JBM Auto reported revenue of ₹6,227.30 crore in FY26 vs ₹5,525.91 crore in FY25. It showed an increase of 12.69% on a yearly basis.
- Operating Profit: JBM Auto reported an operating profit of ₹310.28 crore in FY26 vs ₹273.19 crore in FY25. It showed an increase of 13.58% on a year-on-year basis.
- Net Profit: JBM Auto reported a net profit of ₹238.07 crore in FY26 vs ₹214.63 crore in FY25. It showed an increase of 10.92% on a yearly basis.
JBM Auto Quarterly Result Highlights
- JBM Auto reported revenue of ₹1,882.47 crore in Mar 2026, compared with ₹1,643.78 crore in Dec 2025, representing an increase of 14.52% on a quarter-on-quarter (QoQ) basis.
- JBM Auto reported an operating profit of ₹107.89 crore in Mar 2026, compared with ₹77.45 crore in Dec 2025, representing an increase of 39.30% on a quarter-on-quarter (QoQ) basis.
- JBM Auto reported a profit of ₹83.82 crore in Mar 2026, compared with ₹59.99 crore in Dec 2025, reflecting an increase of 39.72% on a QoQ basis.
- The earnings per share (EPS) of JBM Auto stood at ₹8.54 during Mar 2026.
Similar Stocks
FAQs on JBM Auto Share Price
What is JBM Auto share price today?
JBM Auto share price is ₹656.05 as on 24 Jul, 2026, 15:41 IST.
How has the JBM Auto share price performed in the past?
In the last 1 year, JBM Auto delivered a return of 2.14%. The JBM Auto share price hit a high of ₹790.00 and low of ₹477.00.
How much is the Mutual Fund shareholding in JBM Auto shares?
The Mutual Fund Shareholding in JBM Auto was 0.11% at the end of Jun 2026.
What is the the 52-week high and low of JBM Auto shares ?
The 52-week high and low of JBM Auto share is ₹790.00 and ₹477.00 as of 24 Jul, 2026.
What is the market cap of JBM Auto?
The market capitalisation of JBM Auto is ₹15,589.70 Crores as on 24 Jul, 2026.
What are the stock symbols of JBM Auto?
The stock symbol of JBM Auto is JBMA on the NSE, 532605 on the BSE, and the ISIN is INE927D01051.
What was yesterday's closing price of JBM Auto shares ?
JBM Auto shares closed yesterday at ₹659.10 on NSE & ₹659.20 on BSE
How to buy JBM Auto shares?
To buy JBM Auto shares, open a demat account with Upstox and complete the KYC process. Once your account is set up, search for the stock and place your order.
Can I buy JBM Auto shares on Holidays?
No, shares of JBM Auto or any other publicly traded company cannot be bought or sold on holidays when the stock exchanges are closed. You can only buy or sell JBM Auto shares on days when the stock exchanges are open for trading. It's important to check the NSE & BSE holidays calendar, before placing any trades to avoid any inconvenience.
What is the PE and PB ratio of JBM Auto?
The PE and PB ratio of JBM Auto is 65.46 and 10.13 respectively, as on 24 Jul, 2026, 15:41 IST.