Stock Market Rally and Crash: Causes, Mechanics & Risks

Written by Bidita Sen
Published on August 11, 2026 | 17 min read
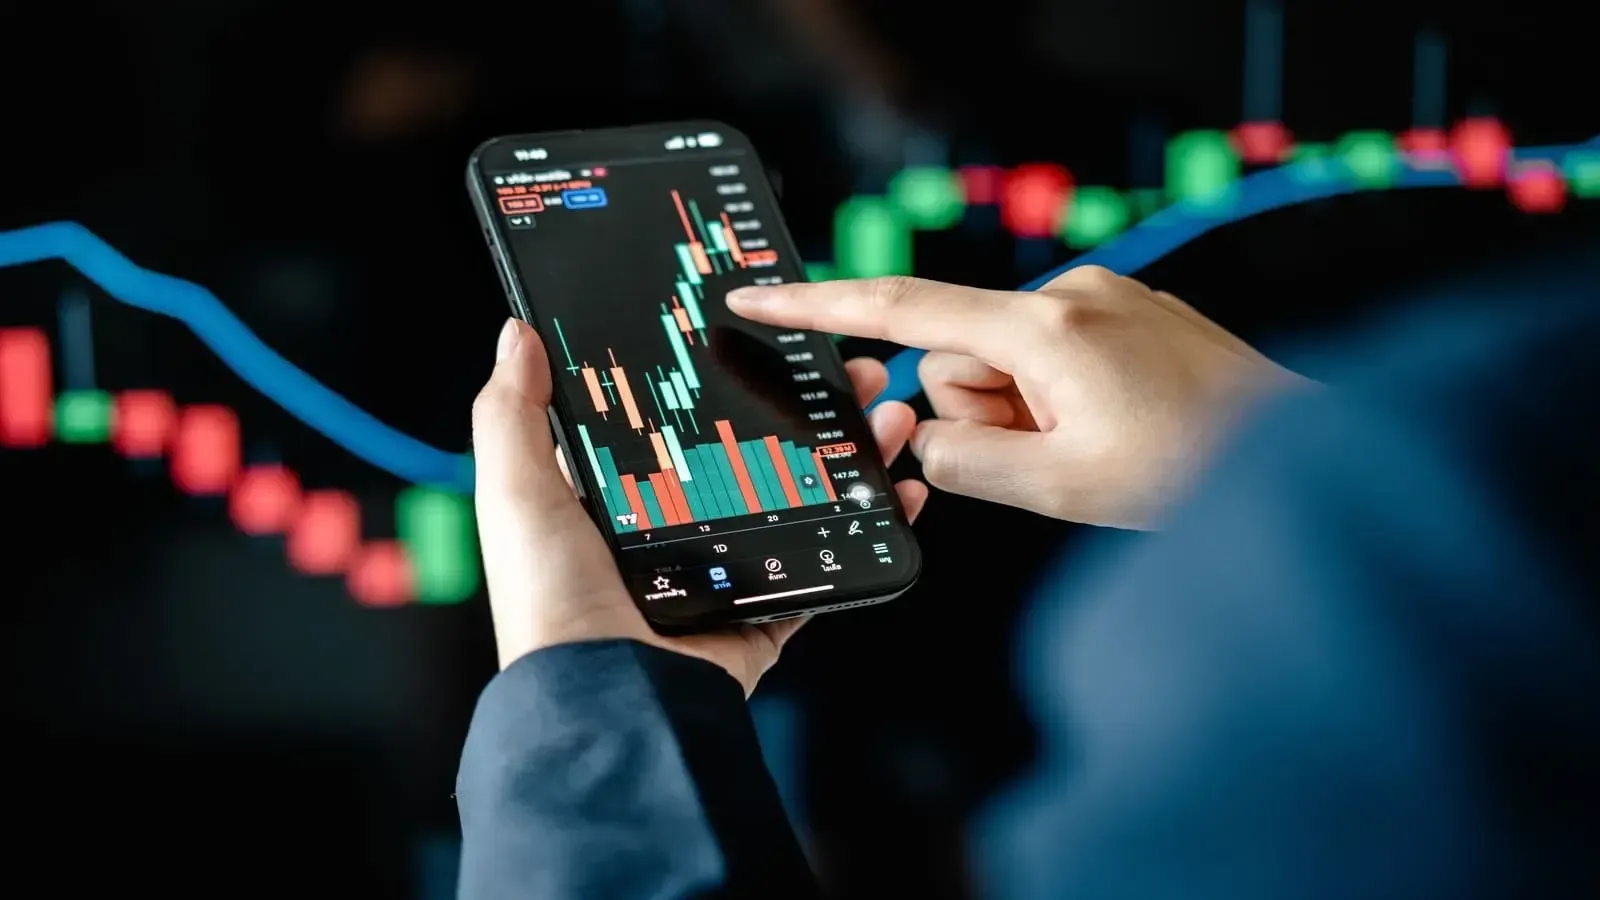

Key Takeaways
- Market rallies stem from low interest rates, strong earnings growth, and persistent institutional liquidity flows.
- Stock crashes occur when unexpected economic shocks, stretched valuations, or sudden credit tightening trigger panic.
- Regulatory frameworks like SEBI circuit breakers help stabilise Indian markets during extreme price volatility events.
- Balanced asset allocation and disciplined risk management can help preserve long-term capital through full market cycles.
The market pulse is very sensitive. Mood can swing from upbeat optimism to widespread panic with small movements in stock prices. The first step in equity investment is a thorough understanding of why market cycles expand and contract. Here is a clear breakdown of how stock market rallies and crashes work, what causes them, and how to respond.
What is a Stock Market Rally?
A stock market rally refers to a sustained period of rising asset prices across equity market indices such as the Nifty 50 or the BSE Sensex, or within specific industrial sectors. Rallies can occur over short windows lasting several days or extend into multi-year bull cycles. During a rally, buying pressure consistently outweighs selling pressure, driving market valuations upward. Financial markets experience two main categories of rallies: short-term tactical rallies and secular bull rallies.
Short-Term Rallies
Short-term rallies frequently occur within broader sideways or declining market environments. These movements are often driven by immediate catalysts, such as quarterly corporate earnings exceeding expectations, favorable economic data releases, or short-covering activity by institutional traders. A classic example is a bear market rally, where prices bounce sharply upward temporarily due to oversold conditions before resuming their overall downward trend.
Secular Bull Rallies
Secular bull rallies are prolonged upward movements that last for several years, supported by fundamental economic expansion. These cycles reflect underlying structural strength in national output, growing corporate profits, regulatory stability, and steady capital inflows from both domestic and foreign investors. During a secular rally, brief pullbacks occur, but the overarching trajectory of benchmark indices remains upward.
Primary Causes of Stock Market Rallies
Stock market rallies do not happen in isolation. They are driven by a combination of macroeconomic parameters, liquidity conditions, and corporate performance metrics.
- Central Bank Rate Cuts / High Liquidity
- Expanded Corporate Profit Margins
- Institutional Inflows (FPI / DII / SIP)
- Sustained Upward Stock Market Rally
1. Central Bank Monetary Easing
Monetary policy set by central banks, including the Reserve Bank of India (RBI) and the US Federal Reserve, serves as a primary driver of equity prices. When central banks lower benchmark repo rates and inject system liquidity, the cost of borrowing decreases for businesses and consumers.
Impact on Corporate Cost of Capital: Lower interest rates reduce interest expenses on corporate debt, support business expansion, and boost net earnings margins.
Valuation Impact: Discount rates applied to future cash flows decrease, raising the intrinsic valuation of equities relative to fixed-income instruments such as sovereign bonds or corporate fixed deposits.
2. Strong Corporate Earnings Growth
When companies listed on stock exchanges consistently report growth in revenue and profit margins, equity valuations may adjust upward. Broad-based earnings growth across core sectors—such as banking, information technology, manufacturing, and fast-moving consumer goods (FMCG)—provides a fundamental basis for stock indices to reach new historic highs.
3. Domestic and Foreign Institutional Capital Inflows
Liquidity is an important driver of asset prices. In the Indian context, equity market rallies receive backing from two major institutional capital channels:
Domestic Institutional Investors (DIIs): Systematic mutual fund inflows via Systematic Investment Plans (SIPs) provide continuous buying support. Monthly SIP inflows into Indian domestic mutual funds offer structural liquidity that can help absorb foreign selling and support market indices over time.
Foreign Portfolio Investors (FPIs): Global capital flows seeking emerging market growth opportunities inject large volumes of foreign currency into listed equities. When global risk appetite increases, FPI buying can contribute to price appreciation, particularly in large-cap equities.
4. Positive Economic Indicators
Macroeconomic parameters indicating steady expansion create favourable conditions for market rallies. Key indicators include:
GDP Growth Rates: Consistent expansion in real Gross Domestic Product signals rising aggregate demand and industrial activity.
Controlled Inflation: Stable Consumer Price Index (CPI) figures may reduce the need for aggressive monetary tightening, allowing businesses to plan long-term capital expenditure.
Government Policy and Reforms: Fiscal incentives, capital expenditure announcements, and regulatory clarity may encourage institutional participation.
What is a Stock Market Crash?
A stock market crash is a rapid, steep, and often unexpected decline in stock prices across a broad cross-section of listed companies, resulting in a significant loss of paper wealth within a very short timeframe. Unlike gradual market declines, crashes feature extreme trading volatility, heavy selling volume, and a sudden decline in market liquidity.
To analyse market drawdowns accurately, investors must distinguish between routine market pullbacks, formal market corrections, and full crashes.
| Market Phase | Percentage Decline | Typical Duration |
|---|---|---|
| Pullback | 3% to 9% | Few days to a few weeks |
| Market Correction | 10% to 19% | Few weeks to several months |
| Stock Crash | 20% or more (rapid) | Days to weeks (often accompanied by panic selling) |
Pullbacks vs. Corrections vs. Crashes
Pullback: A minor decline ranging between 3% and 9% from recent market highs. Pullbacks represent standard profit-booking by institutional traders and healthy consolidation within an ongoing upward trend.
Correction: A price drop between 10% and 19% from recent peak levels. Corrections occur when valuations become stretched relative to immediate earnings potential, prompting market prices to realign with fundamental realities.
Market Crash: A sudden drop of 20% or more from recent highs, often occurring over a matter of days or weeks. Crashes are driven by systemic panic, credit events, major geopolitical disruptions, or unexpected economic shocks.
Key Triggers that Cause Stock Market Crashes
Market crashes occur when multiple stress factors converge, creating panic selling across institutional and retail investor bases alike.
1. Macroeconomic and Geopolitical Shocks
Unforeseen macroeconomic disruptions can disrupt global supply chains, increase raw material costs, and create severe revenue uncertainty for listed businesses. Examples include:
- Unexpected outbreaks of global health crises or military conflicts in critical economic regions.
- Sudden spikes in global crude oil prices, which can increase import bills, fiscal deficits, and input costs for energy-importing economies like India.
2. Monetary Tightening and Rate Hikes
When inflation accelerates beyond central bank target bands, monetary authorities may respond by raising interest rates and draining banking system liquidity. Rapid rate hikes make fixed-income yields more attractive relative to equities, which may lead institutional capital to reallocate away from riskier assets. Furthermore, higher interest burdens can reduce corporate profitability and consumer spending.
3. Valuation Bubbles and Speculative Excess
During prolonged bull markets, investor optimism sometimes detaches equity valuations from fundamental financial metrics. When price-to-earnings (P/E) ratios, price-to-book (P/B) ratios, and market capitalisation-to-GDP ratios reach historically elevated levels, markets may become vulnerable. A single negative catalyst can shatter optimistic expectations, triggering a wave of selling as investors rush to exit stretched positions.
4. Systemic Banking or Credit Failures
Financial systems depend on the smooth flow of credit. When major financial institutions face insolvency, or when non-banking financial companies (NBFCs) experience severe liquidity freezes, market confidence may erode rapidly. Credit contraction restricts access to working capital, forcing institutional investors to sell liquid equities to satisfy short-term cash obligations.
5. Automated Algorithmic Selling and Margin Calls
Modern equity markets rely heavily on algorithmic and high-frequency trading programs. When key technical support levels are breached:
- Stop-loss orders may execute automatically, releasing large sell orders into order books.
- Leveraged traders facing margin calls from brokerages may be forced to liquidate positions, accelerating downward price momentum.
The Role of Central Banks, RBI, and Monetary Policy
Central bank policy is a major influence on equity market valuations. The Reserve Bank of India (RBI) manages liquidity, monetary stability, and inflation within the domestic economy, while the US Federal Reserve influences global capital flows.
RBI / Fed Monetary Stance
- Easy Policy
- Lower Rates & High Liquidity
- Lower Corporate Debt Cost
- Equities May Become More Attractive Than Bonds
- Market Rally
- Tight Policy
- Higher Rates & Rate Hikes
- Higher Corporate Debt Cost
- Bonds May Become More Attractive Than Equities
- Market Weakness / Bearish Conditions
Rate Cycles and Capital Flows
Interest rate decisions influence asset pricing through multiple channels, including changes in the yield curve.
Rate Reduction Phase: Lower sovereign bond yields may encourage capital to move toward higher-yielding equity assets. Companies may refinance existing debt at lower rates, improving net profitability. This environment can support stock market rallies.
Rate Hiking Phase: Rising yields on government securities may reduce the equity risk premium. Institutional managers may shift capital from equities into other fixed-income instruments such as government securities and corporate bonds, putting downward pressure on stock prices.
Foreign Exchange and RBI Reserves
For emerging equity markets, exchange rate stability is important. When the US Dollar Index (DXY) strengthens sharply, foreign portfolio managers often reduce exposure to emerging market risk assets, leading to outflows from Indian equities. The RBI may use its foreign exchange reserves to manage excessive volatility in the INR/USD exchange rate, helping stabilize financial markets during periods of currency market stress.
Market Psychology: Greed, Fear, FOMO, and Herd Behaviour
Financial markets reflect collective human decision-making. While fundamentals primarily influence long-term equity valuations, market sentiment often influences short-term price movements.
Fundamental Valuation
Market Sentiment: Greed
- Fear of Missing Out (FOMO)
- Overvaluation Ignored
- Retail Participation Peaks
Peak Rally Phase
Market Sentiment: Fear
- Panic Selling
- Margin Call Liquidation
- Flight to Cash & Gold
Crash Bottom Phase
The Expansion Phase: Greed and FOMO
As a market rally progresses:
- Rising prices attract retail investors who observe past returns and fear missing out (FOMO) on future gains.
- Caution gives way to optimism, leading market participants to ignore standard valuation metrics.
- Leverage increases as investors borrow capital to enlarge trading positions, pushing asset prices above their underlying intrinsic value.
The Contraction Phase: Fear and Panic
When market sentiment turns following a shock or valuation reset:
- Initial price drops spark anxiety among over-leveraged market participants.
- As losses accumulate, fear replaces rational calculation, prompting investors to sell holdings regardless of company fundamentals.
- Herd behaviour accelerates the decline as investors rush to exit simultaneously, causing order book imbalances and sharp market falls.
Landmark Rallies and Crashes in History
Analysing historical market cycles provides a valuable perspective on how economic structures adapt to market expansions and contractions.
| Historical Event | Key Catalyst / Driver | Impact on Markets |
|---|---|---|
| 1992 Indian Securities Scam | Banking & settlement system flaws | Sharp decline in Indian equities; the episode led to significant regulatory reforms and strengthened SEBI's role in securities market regulation. |
| 2000 Dot-Com Crash | Overvalued technology stocks | Global technology stock collapse; NASDAQ dropped roughly 78%. |
| 2008 Global Financial Crisis | US subprime mortgage crisis & global credit freeze | Nifty 50 declined over 50%; global economic recession. |
| 2020 COVID Crash | Global economic lockdowns | Nifty 50 dropped about 38% in weeks; followed by a strong liquidity-driven recovery. |
| Post-2020 Rally | Unprecedented monetary stimulus & retail SIP expansion | Historic multi-year bull run in global and Indian markets. |
The 2008 Global Financial Crisis (GFC)
The Cause: Excessive subprime mortgage lending in the United States led to widespread defaults, failures of major financial institutions, and a global credit market freeze.
The Impact: Equity markets worldwide suffered severe losses. In India, the benchmark Nifty 50 declined by more than 50% from its January 2008 high to its March 2009 low, driven largely by foreign capital outflows.
The Recovery: Coordinated global monetary stimulus, central bank liquidity support, and interest rate cuts helped stabilize international banking systems, leading to a gradual market recovery.
The 2020 COVID Market Crash and Liquidity Rally
The Cause: The arrival of the global COVID-19 pandemic triggered widespread economic lockdowns, disrupting business activity across industrial sectors worldwide.
The Impact: In March 2020, Indian equity indices experienced one of their fastest declines, with the Nifty 50 dropping roughly 38% in a matter of weeks.
The Recovery: Central banks enacted swift interest rate cuts, while governments introduced large-scale fiscal stimulus measures. Unprecedented global liquidity, combined with rising domestic retail participation through demat accounts and SIPs, supported a historic rally that took benchmark indices to new record highs over the following years.
How SEBI and Stock Exchanges Control Market Volatility
To promote orderly trading, protect market integrity, and safeguard investors during periods of extreme volatility, market regulators such as the Securities and Exchange Board of India (SEBI), together with stock exchanges such as the National Stock Exchange (NSE) and BSE Limited, enforce risk management mechanisms.
1. Index-Wide Circuit Breakers
SEBI implements compulsory index-wide circuit breakers to manage extreme market movements. These circuit filters apply to broad market benchmarks (such as the Nifty 50 and BSE Sensex) at three percentage thresholds: 10%, 15%, and 20%.
Benchmark Index Movement 10% Movement Trading Halted for 45 minutes to 1 hour 15% Movement Trading Halted for 45 minutes to 2 hours 20% Movement
Trading may be halted for the remainder of the trading day, depending on the time the threshold is breached, in accordance with SEBI's circuit breaker framework.
10% Movement: Halts trading across equity and equity derivatives markets for 45 minutes to 1 hour, depending on the time of day the threshold is breached.
15% Movement: Triggers a longer trading halt ranging from 45 minutes to 2 hours, allowing market participants time to evaluate information and process news.
20% Movement: Trading may remain suspended for the remainder of the trading day, depending on when the threshold is breached, as specified under the applicable SEBI framework.
2. Individual Stock Price Bands
For individual listed stocks not included in the equity derivatives segment, stock exchanges enforce daily price bands ranging from 2% to 20%, depending on the security. These limits help reduce excessive price volatility and discourage price manipulation in relatively illiquid stocks.
3. Dynamic Margin Requirements
During periods of elevated market volatility, stock exchanges may increase margin requirements. Higher Value at Risk (VaR) margins help reduce excessive leverage by ensuring trading members maintain adequate collateral against open positions.
Bull Markets vs. Bear Markets: Structural Differences
Understanding the differences between bull and bear market environments helps investors understand broader market dynamics.
| Metric / Dimension | Bull Market | Bear Market |
|---|---|---|
| Primary Trend | Sustained rise in benchmark asset prices over months or years. | Sustained fall in asset prices, typically 20% or more from a recent peak. |
| Investor Sentiment | High confidence, optimism, widespread retail participation. | Caution, pessimism, panic selling, institutional capital preservation. |
| Economic Backdrop | Expanding GDP, rising corporate earnings, low unemployment. | Slowing GDP growth, contracting profit margins, increased recession risk. |
| Market Valuations | P/E ratios often expand above historical averages. | P/E ratios often compress below historical averages. |
| Central Bank Policy | Generally neutral or accommodative monetary policy. | May involve tighter monetary policy during inflationary periods or accommodative policy during economic downturns. |
| Trading Volume | Heavy buying volume during upward price moves. | Heavy selling volume during downward price moves. |
Analytical Indicators for Tracking Market Valuations
Investors and analysts track key financial indicators to evaluate market cycles and identify when valuations may be reaching relatively high or low levels.
1. Price-to-Earnings (P/E) Ratio
The market P/E ratio measures the current trading price of an index relative to its aggregate earnings per share (EPS). Comparing an index's current P/E with its historical 10-year average may help indicate whether broad market equities are trading at a premium or a discount.
2. Market Capitalisation-to-GDP Ratio
Popularised by legendary investor Warren Buffett, this valuation indicator compares the total market capitalisation of all listed companies in a country with its nominal Gross Domestic Product. A ratio well above historical averages may indicate elevated market valuations.
A ratio significantly below historical trends may indicate relatively lower market valuations.
3. India VIX (Volatility Index)
The India Volatility Index (India VIX) measures market expectations of near-term volatility based on Nifty 50 options prices traded on the NSE.
Low India VIX (e.g., 10–15): Indicates relatively stable market expectations and lower expected volatility.
High India VIX (e.g., 25–40+): Indicates heightened uncertainty and expectations of higher market volatility.
Market Risk Indicators
- Low India VIX (10–15)
- Lower expected volatility
- Relatively stable market conditions
- Often observed during sustained market rallies
High India VIX (25–40+)
- Higher expected volatility
- Elevated market uncertainty
- Often observed during periods of market stress
Prop Risk Management Tips for Investors
Equities are inherently volatile. Navigating rallies and market declines requires structured asset allocation and disciplined risk management rather than emotional market timing.
1. Diversification Across Asset Classes
Capital allocation should not be confined to a single asset category. A balanced portfolio may allocate across complementary asset classes:
Equities: May support long-term capital appreciation. Fixed Income: High-quality sovereign bonds and debt funds may provide relatively stable income and diversification during market declines. Gold: Gold has historically acted as a hedge during periods of economic uncertainty and market stress.
2. Rupee Cost Averaging via SIPs
Attempting to consistently time market tops and bottoms is difficult. Maintaining regular investments through Systematic Investment Plans (SIPs) enables investors to buy more mutual fund units when prices are lower and fewer units when prices are higher, potentially reducing the average cost per unit over time.
3. Periodic Portfolio Rebalancing
Portfolio allocations naturally drift during prolonged market movements. For example, a target allocation of 60% equities may increase to 75% after a sustained rally. Periodic rebalancing restores the intended asset allocation and helps manage portfolio risk.
4. Maintaining an Adequate Emergency Fund
Maintaining liquid savings equivalent to approximately 6 to 12 months of living expenses may help reduce the need to liquidate long-term investments during periods of market stress.

Call Out
Stock market rallies and crashes are normal features of economic and market cycles. Rallies often reflect corporate earnings growth, favourable interest rate environments, and institutional capital inflows, while crashes may occur as markets adjust to valuation excesses, economic shocks, or financial stress.
Trying to consistently time short-term market movements is difficult and may increase portfolio risk. Long-term investing typically involves monitoring macroeconomic indicators, understanding valuation metrics, maintaining balanced asset allocation, and following a disciplined investment approach through different phases of the market cycle.
FAQs
What is a stock market rally?
A stock market rally is a sustained rise in stock prices driven by factors such as strong corporate earnings, favourable economic conditions, and increased investor participation.
What causes a stock market crash?
A stock market crash can be triggered by economic shocks, geopolitical events, rapid interest rate hikes, financial crises, or panic selling by investors.
What is the difference between a stock market rally and a bull market?
A rally is a period of rising prices that can be short- or long-term, whereas a bull market is a prolonged period of sustained market gains, typically supported by strong economic fundamentals.
How does the RBI influence the stock market?
The RBI influences the stock market through monetary policy, including changes in interest rates and liquidity, which can affect borrowing costs, corporate earnings, and investor sentiment.
What are SEBI circuit breakers?
SEBI circuit breakers are market-wide trading halts triggered when benchmark indices move by specified percentages, helping maintain orderly trading during periods of extreme volatility.
What is India VIX and why is it important?
India VIX measures the market's expectation of near-term volatility based on Nifty 50 options prices. A higher VIX generally indicates higher expected market volatility.
How can investors manage risk during stock market volatility?
Investors can manage risk through diversification, systematic investing (such as SIPs), periodic portfolio rebalancing, and maintaining an adequate emergency fund.
About Author
Bidita Sen
Senior Editor
Bidita Sen has spent over a decade first understanding the complex language of finance, then translating it into something humans can actually read. After a career spent chasing market trends, she now prefers chasing ghosts. When she's not working, you’ll find her reading or re-watching the Paranormal Activity series. Because, real-life math is much scarier than a haunted house.
Read more from Bidita

















Upstox is a leading Indian financial services company that offers online trading and investment services in stocks, commodities, currencies, mutual funds, and more. Founded in 2009 and headquartered in Mumbai, Upstox is backed by prominent investors including Ratan Tata, Tiger Global, and Kalaari Capital. It operates under RKSV Securities and is registered with SEBI, NSE, BSE, and other regulatory bodies, ensuring secure and compliant trading experiences.
Related articles
Share Market
What Is a Market Correction? Meaning, Causes, and Strategy15 min read | Written by Bidita Sen

Share Market
Cyclical vs Defensive Stocks: Differences, Examples and Strategy15 min read | Written by Bidita Sen

Share Market
What is Efficiency Ratio: Meaning, Types, Formula and More12 min read | Written by Sachin Gupta

Share Market
What is a Solvency Ratio: Meaning, Types, Benefits, Limitations and More12 min read | Written by Sachin Gupta
Share Market
Profitability Ratios: Meaning, Formula, Benefits, Limitations and More11 min read | Written by Sachin Gupta

Share Market
A Guide to American Depository Receipts (ADR) for Indian Investors13 min read | Written by Subhasish Mandal