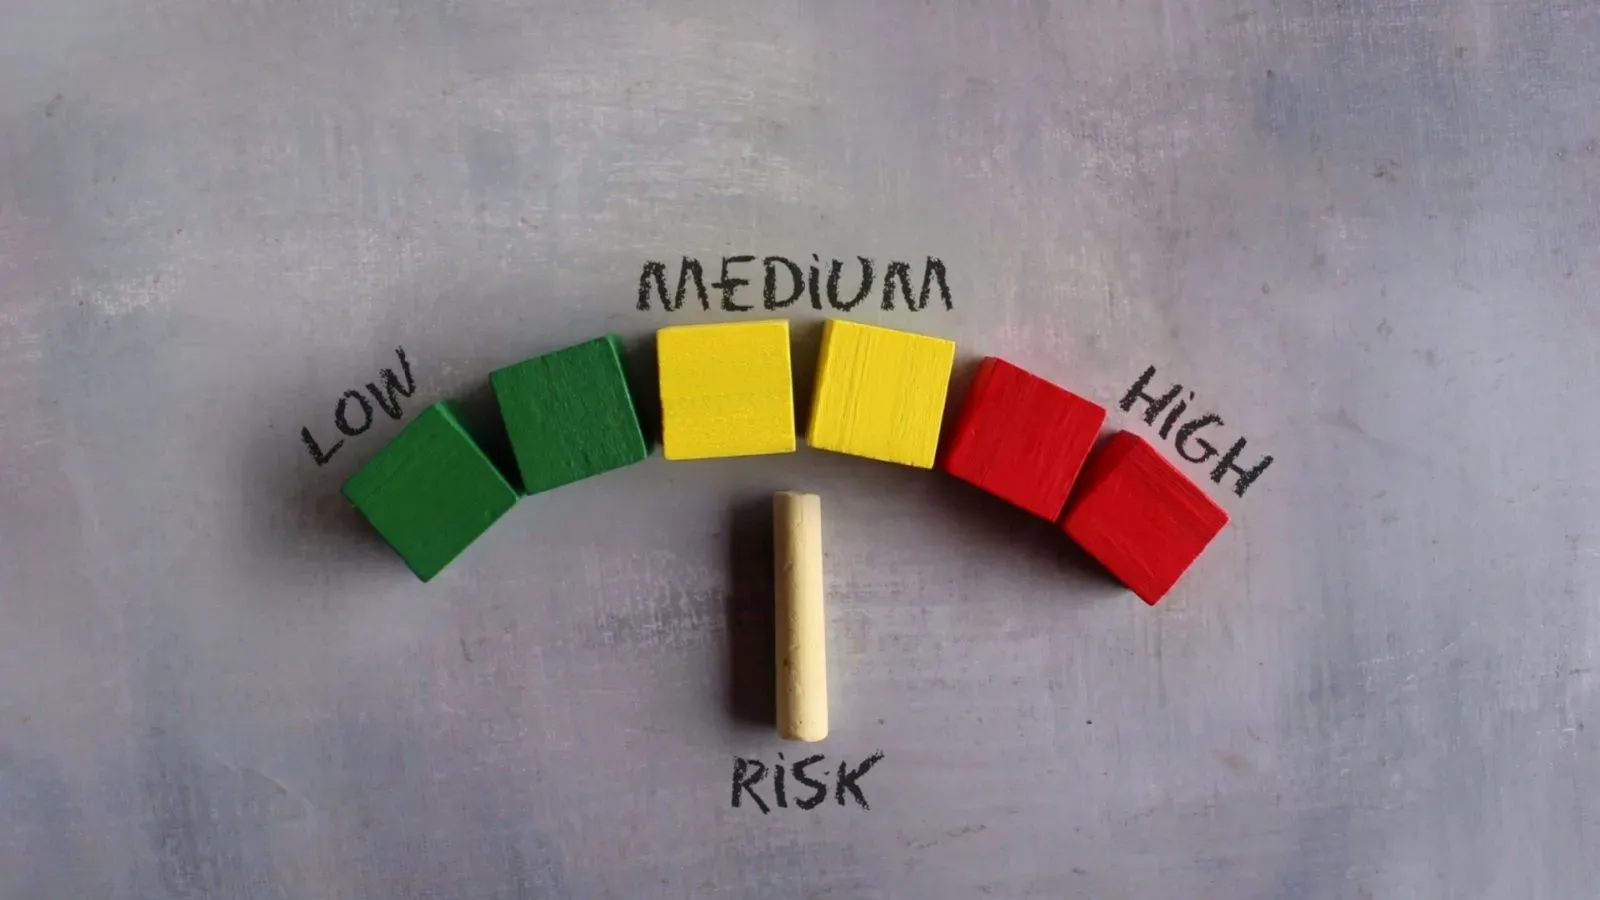
Price, Volume, Volatility and Liquidity in Intraday Trading

Written by Bidita Sen
Published on September 08, 2026 | 12 min read


Key Takeaways
- Price marks current agreement, while volume confirms institutional conviction across market moves.
- Liquidity governs order execution quality, dictating whether trades incur costly bid-ask slippage.
- Volatility reflects trading range speed, expanding during morning opening and closing hours.
- Tracking all four forces simultaneously helps traders separate genuine moves from deceptive traps.
Intraday means ‘within the day’. In the stock market, assets are traded within regular market hours, tracking daily price movements. Day traders try to gain leverage from these fluctuations to earn swift profits. They use varied strategies to enter and exit positions before the market closes.
Every day trader in India can relate to this scenario — buying a clean breakout on the Nifty 50, only to watch the market reverse immediately.
This common loss is rarely the result of a broken chart pattern. It happens when traders ignore how volume, volatility, and liquidity interact beneath the surface, tracking only price.
The Four Core Forces of Market Mechanics
According to experienced analysts, one must look beyond candlestick patterns for trading equities or index derivatives on the National Stock Exchange (NSE) and the BSE.
The matching engine operates on an electronic limit order book governed by four interdependent pillars:
- Price: It denotes momentary equilibrium and should not be mistaken for intrinsic value. It is the exact quotation where an aggressive buyer and seller execute a transaction at a given microsecond.
- Volume: The aggregate shares or derivative contracts transacted across a specified interval. Volume reveals institutional commitment backing a directional move.
- Volatility: The speed and range of price displacement. It dictates appropriate stop-loss placement and position sizing over a given timeframe.
- Liquidity: The ease of executing an order at prevailing quotes without dislodging the market. Deep books limit execution drag, whereas thin books cause severe slippage.
These four elements interact in different ways on different days. A thorough analysis of this relation differentiates an experienced trader, who reads order flow, from a reactive chart follower.
Double-Auction and Price-Time Priority
Modern Indian electronic exchanges follow a continuous double-auction limit order book to match trades. Every pending trade rests in an electronic queue governed strictly by Price-Time Priority.
- Price Priority: The highest buy quote (best bid) and lowest sell quote (best ask) always receive execution preference over inferior prices.
- Time Priority: When multiple orders rest at an identical price, the order submitted earliest to the exchange matching engine executes first.
Operational fairness across retail terminals, proprietary desks, and institutional algorithms is maintained with the help of this transparent framework. Prices pause at heavy supply zones or jump abruptly across vacant price rungs because of this priority sequence.
Passive Limit Orders versus Aggressive Market Orders
Market participants interact with the central order queue through two operational mechanisms:
- Passive Limit Orders (Liquidity Makers): Resting orders placed below the current ask to buy, or above the current bid to sell. These orders supply depth to the exchange order book, accepting execution delays in exchange for price certainty.
- Aggressive Market Orders (Liquidity Takers): Orders that cross the prevailing bid-ask spread to demand immediate execution. Market orders remove resting shares from the queue, paying an execution premium for speed.
When an institutional participant offloads 50,000 shares using an aggressive market order, the matching engine fills the volume against resting limit bids. If top bids lack sufficient depth, the market order sweeps down through consecutive price tiers, causing downward price displacement.
Order Book Depth and Level 2 Market Data
Standard trading platforms in India display Level 2 market depth, presenting the top five bids and asks alongside their respective quantities.
A deep order book features substantial share quantities resting across consecutive five-paise ticks. When large bids populate the top five tiers, incoming aggressive sell orders get absorbed without moving the market quote lower.
By the same logic, a thin order book displays sparse quantities separated by wide gaps. Even modest retail market orders consume available liquidity, creating erratic candles with disproportionately long wicks. Day traders who examine Level 2 depth before entering trades evaluate whether the order book can absorb their position size without adverse displacement.
Price and Volume Interaction Patterns
On any given day, either aggressive market orders or passive resting orders control the auction. The relationship between price movement and transacted volume indicates what will be the controlling force.
- Rising Price with Expanding Volume: Aggressive buyers consistently lift resting offers at the ask. A stock advancing through intraday resistance on twice its average volume reflects institutional buying interest, increasing the likelihood of sustainable trend continuation.
- Rising Price with Contracting Volume: Upward price drift caused by an absence of aggressive sellers rather than genuine buying enthusiasm. As quotes approach overhead resting supply, the advance halts, leaving the market vulnerable to sharp reversals.
- Falling Price with Expanding Volume: Heavy supply hitting available bids. Institutional distribution consumes passive buy orders across multiple tiers, warning traders against attempting to buy falling assets.
- Falling Price with Contracting Volume: Orderly pullbacks and routine profit booking. Devoid of institutional selling aggression, these retracements frequently stabilise near dynamic intraday support benchmarks like the Volume-Weighted Average Price.
True Cost of Execution: Bid-Ask Spreads
The bid-ask spread is the price difference between the highest price a buyer offers and the lowest price a seller accepts.
In liquid benchmark stocks, the spread usually remains anchored at the exchange minimum tick size of ₹0.05. Entering and exiting positions in these instruments incurs minimal execution friction.
In illiquid mid-cap or small-cap equities, however, the spread has a frequent tendency to widen to ₹0.50 or more. For a stock quoted with a bid at ₹400.00 and an ask at ₹402.50, buying at the market ask creates an instant loss of 0.62% upon trade entry. An intraday trader aiming for a 1.0% gain surrenders over half of their profit potential to bid-ask friction before the trade develops.
Impact Cost: The Regulatory Benchmark for Real Liquidity
Retail market participants frequently equate a tight five-paise spread with abundant liquidity. Institutional market participants, however, measure execution quality through impact cost, which is an institutional metric formally adopted by the Securities and Exchange Board of India (SEBI).
Impact cost measures the percentage execution penalty an investor incurs when transacting an order size relative to the ideal market price, defined as the midpoint of the best bid and ask.
Shallow order books impose heavy impact costs on sizable positions. Even when the visible spread is five paise, executing an order larger than top-tier quantities forces the transaction into deeper price rungs, eroding realized profits.
Step-by-Step Impact Cost Calculation on the NSE
For example, an intraday trader wants to execute a buy order of 2,000 shares in a mid-cap company on the NSE cash segment.
The prevailing market depth displays the following quotes:
- Best Bid: ₹500.00 (Quantity: 1,200)
- Best Ask: ₹500.20 (Quantity: 500)
- Second Ask: ₹500.60 (Quantity: 1,000)
- Third Ask: ₹501.00 (Quantity: 1,000)
1. Calculate the Ideal Midpoint Price: The midpoint between the best bid of ₹500.00 and the best ask of ₹500.20 is ₹500.10.
2. Calculate the Actual Execution Price for 2,000 Shares:
- The first 500 shares execute at the best ask of ₹500.20, totalling ₹2,50,100.
- The next 1,000 shares execute at the second ask of ₹500.60, totalling ₹5,00,600.
- The final 500 shares execute at the third ask of ₹501.00, totalling ₹2,50,500.
- Total capital deployed equals ₹10,01,200 for 2,000 shares.
- The weighted average execution price is ₹500.60 per share.
3. Determine the Impact Cost Percentage:
- Execution difference equals ₹500.60 minus ₹500.10, which is ₹0.50.
- Impact cost ratio: ₹0.50 divided by ₹500.10 multiplied by 100 equals approximately 0.10%.
While the screen showed an apparent spread of only 20 paise, the actual trade suffered an impact cost of 50 paise per share due to shallow depth.
The Four Volatility and Liquidity Regimes
Liquidity acts as a shock absorber against erratic price swings. Intraday market conditions oscillate across four operating environments:
- High Liquidity with Low Volatility: Tight spreads and dense order queues. This regime occurs during midday consolidation between 11:30 and 13:30 IST. Price moves within narrow, stable trading ranges.
- High Liquidity with High Volatility: Substantial order depth matched by aggressive institutional order flow. This environment usually characterises the opening 45 minutes of trading in Nifty and Bank Nifty contracts, providing momentum for breakout strategies.
- Low Liquidity with Low Volatility: Sparse order books coupled with low transaction volume. This is typical of lower-tier cash equities. Spreads are wide, and price movement remains erratic and drift-prone.
- Low Liquidity with High Volatility: This is widely considered as the most hazardous trading environment. Aggressive market orders sweep through hollow order books, creating sharp price spikes, severe slippage, and repeated stop-loss failures.
Volume-Weighted Average Price (VWAP) as Institutional Equilibrium
Intraday price action frequently appears chaotic when viewed solely through standard time-based candlestick charts. To determine fair value, institutional participants rely on the Volume-Weighted Average Price (VWAP).
VWAP is defined as the cumulative value of all transacted shares divided by the total number of shares traded from the market opening at 09:15 IST onward:
- Cumulative Value: The sum of every trade price multiplied by its exact transacted share volume across the trading session.
- Cumulative Volume: The total aggregate shares transacted since the opening bell.
Institutional execution algorithms measure performance against the day’s VWAP. This benchmark functions as an intraday fair-value baseline. When price trades above VWAP on expanding volume, buyers dominate the session. Price sustaining below VWAP signals that aggressive sellers remain in control.
Hidden Institutional Order Flow
Retail terminals display the top five resting quotes, but visible depth accounts for only a fraction of total market intent. Institutional participants actively conceal large orders to prevent market impact.
Under SEBI regulations, market participants can set a Disclosed Quantity (DQ) condition, provided the disclosed volume represents at least 10% of the total order size. When an institution wishes to accumulate 1,00,000 shares of an index constituent, exposing the entire quantity in the visible book would alert sellers and drive ask prices upward.
Instead, the institution discloses 10,000 shares. Once the visible 10,000 shares are filled by incoming sellers, the exchange matching engine immediately releases the next 10,000-share tranche at that limit price. To retail participants watching the Level 2 depth screen, the bid appears ordinary. In reality, a persistent institutional limit order absorbs all available selling pressure.
Common Intraday Market Traps
Market traps occur when price movements diverge from underlying order book liquidity:
- The Low-Volume Vacuum Trap: A stock rallies 2% across several consecutive five-minute candles with below-average volume. The advance occurs because passive ask orders are temporarily absent, not because aggressive buyers entered. Once passive sellers place fresh limit orders overhead, the rally collapses through the hollow liquidity void.
- The High-Volume Absorption Trap: An index contract tests resistance on surging volume but prints narrow candles with extended upper wicks. Aggressive retail buyers are absorbed by an institutional iceberg limit sell order. When retail buying power exhausts, price reverses downward with significant speed.
Execution Risk Management: Stop-Loss Limit versus Market Orders
Exchange order execution protocols safeguard day traders against slippage during rapid intraday moves:
-
Stop-Loss Market (SL-M): When the trigger price is touched, the broker sends an unpriced market order to the exchange. In a cascading market, this order fills at whatever bids remain. If liquidity suddenly evaporates, an exit triggered at ₹1,000 may execute at ₹992, inflicting costly execution slippage.
-
Stop-Loss Limit (SL-L): The trader specifies both a trigger price and a limit price (for instance, a trigger at ₹1,000 with a limit at ₹997). When triggered, the order enters the book as a limit order at ₹997. While this prevents slippage below ₹997, it introduces execution risk. If price gaps through ₹997 without filling, the position remains open while the market continues to drop.
Retail traders can mitigate market impact by respecting institutional participation rates. Professional execution desks rarely exceed 10% to 15% of the average volume transacted over a 15-minute candle. If an individual trade size represents a significant fraction of prevailing interval volume, splitting the order across multiple price tiers preserves edge by preventing self-inflicted execution drag.

Intraday analysis evaluates the mechanics of ongoing order matching. Price establishes the current point of agreement, volume confirms institutional participation, volatility defines viable risk boundaries, and liquidity dictates execution quality. One must align trading strategies with all four interdependent forces to differentiate sustainable institutional trends from deceptive intraday traps.
FAQs
What are the four key factors in intraday trading?
Price, volume, volatility and liquidity are four key factors that interact to influence intraday price movements and trade execution.
How does volume affect intraday price movements?
Volume indicates the level of trading activity behind a price move. Rising prices with expanding volume can indicate stronger buying participation, while price moves on contracting volume may be less supported.
What is liquidity in intraday trading?
Liquidity refers to how easily an order can be executed near prevailing market prices without significantly moving the price. Thin liquidity can increase slippage and execution costs.
What is the bid-ask spread in intraday trading?
The bid-ask spread is the difference between the highest price a buyer is willing to pay and the lowest price a seller is willing to accept. A wider spread increases the cost of entering and exiting a trade.
What is impact cost in intraday trading?
Impact cost measures the execution penalty incurred when an order is executed at prices different from the ideal market price because of limited order-book depth.
About Author
Bidita Sen
Senior Editor
Bidita Sen has spent over a decade first understanding the complex language of finance, then translating it into something humans can actually read. After a career spent chasing market trends, she now prefers chasing ghosts. When she's not working, you’ll find her reading or re-watching the Paranormal Activity series. Because, real-life math is much scarier than a haunted house.
Read more from Bidita

















Upstox is a leading Indian financial services company that offers online trading and investment services in stocks, commodities, currencies, mutual funds, and more. Founded in 2009 and headquartered in Mumbai, Upstox is backed by prominent investors including Ratan Tata, Tiger Global, and Kalaari Capital. It operates under RKSV Securities and is registered with SEBI, NSE, BSE, and other regulatory bodies, ensuring secure and compliant trading experiences.
Related articles

Intraday Trading
The 52-Week High and Low Playbook: How Indian Investors Decode Breakouts9 min read | Written by Bidita Sen
Intraday Trading
Scalp Trading, How Does Scalping trading Work?6 min read | Written by Subhasish Mandal

Intraday Trading
False Breakouts in Trading: Here’s How to Spot and Avoid Them11 min read | Written by Bidita Sen

Intraday Trading
How to Combine Multiple Indicators in Intraday Trading: A Complete Guide13 min read | Written by Sachin Gupta

Intraday Trading
How are Gains from Intraday Trading Taxed for ITR3 min read | Written by Mariyam Sara
Intraday Trading
Basics of Intraday Trading: A Guide for Investors5 min read | Written by Sachin Gupta