Logo

Ashok Leyland Share Price

NSE: ASHOKLEY
|
Automobile
₹ 164.35
-₹0.38 (-0.23%)
1D
Last updated 03 Jul, 2026, 15:59 IST

Ashok Leyland Share Price Today

As of 5 Jul 2026, Ashok Leyland share price is ₹164.35. The stock opened at ₹166.00, compared to its previous close of ₹164.73. During today's trading session, Ashok Leyland share price moved in the range of ₹163.71 to ₹167.55, with an average price of ₹165.63 for the day. Looking at its last 52-week, the stock has touched a low of ₹114.96 and a high of ₹215.42. On the performance front, Ashok Leyland share price has declined by 12.94% over the last six months and is up 31.22% on a year-on-year basis.


₹163.71
0.23% down today
₹167.55
1D LOW
1D HIGH

Ashok Leyland Returns Calculator

Open
₹166.00
High
₹167.55
Low
₹163.71
Prev. close
₹164.73

Circuit
L
H
₹147.92
₹180.78
52-week
L
H
₹114.96
₹215.42

Ashok Leyland Shareholder Returns

Ashok Leyland Share Price History

Mkt Cap Cr
96,771.80

P/E
26.03

P/B
6.79

ROE
24.37%

D/E
0.09

ROCE
12.51%

Div. Yield
2.12%

EPS(TTM)
6.07
Turnover
2.87

EV/EBITDA
13.51

Net Margin
0.00%

Op. Margin
0.00%

ROA
3.68%

Quick Ratio
0.00

Curr. Ratio
1.16
Based on fundamentals, this stock's
Step 5 of 5
Performance
Excellent
Ashok Leyland outperforming all market indices
Step 1 of 5
Valuation
Overvalued
Ashok Leyland appears overvalued compared to its peers
Step 5 of 5
Earnings
Excellent
Ashok Leyland revenue, operating profit and net profit are growing
Peer Comparison
Peer comparison — key ratios
NameMkt Cap CrP/EP/BROED/EROCEBook ValueDiv. YieldTurnoverEPS(TTM)
Maruti Suzuki4,51,199.0030.744.2113.70%0.0017.51%3,343.160.98%1.64459.46
Mahindra & Mahindra3,94,603.0021.194.2418.37%0.0214.63%597.861.01%1.82130.18
Bajaj Auto2,75,567.0022.836.3228.57%0.0128.35%7.011.71%1.55352.00
Eicher Motors1,99,072.0036.107.9321.97%0.0127.17%794.471.13%0.94183.79
TVS Motor Company1,72,335.0052.9816.6735.27%0.2717.59%14.200.36%3.6576.09
TATA MOTORS LIMITED1,62,115.0047.9511.4034.02%0.4228.42%10.841.01%3.859.13
HYUNDAI MOTOR INDIA LTD1,58,450.0029.177.9227.14%0.0633.27%238.391.08%3.1065.50
Tata Motors1,27,417.001.330.9775.90%0.232.31%4.371.01%1.9714.26
Hero MotoCorp97,378.2016.864.5126.57%0.0133.40%1,078.403.80%2.03263.34
ATHER ENERGY LIMITED43,802.20-84.6917.03-20.10%0.26-12.77%67.150.00%1.10-13.99

Ashok Leyland Financials

Full statement

Income Statement · Consolidated

Income Statement · Consolidated — all values in INR Crore
ParticularsMar 2025Mar 2024Mar 2023Mar 2022
Revenue₹42,333.28₹40,956.35₹41,672.60₹26,237.15
Other Income₹6,560.32₹4,974.87₹107.11₹86.81
Total Revenue₹48,893.60₹45,931.22₹41,779.71₹26,323.96
Total Expenses₹44,344.25₹41,757.31₹39,573.42₹26,206.92
Profit Before Tax₹4,596.33₹4,106.07₹2,264.93-₹199.59
Tax₹1,213.54₹1,409.73₹906.11₹85.86
Profit After Tax₹3,382.79₹2,696.34₹1,358.82-₹285.45
EPS - Basic₹10.58₹8.46₹4.22-₹1.22
EPS - Diluted₹10.58₹8.46₹4.21-₹1.22

Cash Flow · Consolidated

Cash Flow · Consolidated — all values in INR Crore
ParticularsMar 2025Mar 2024Mar 2023Mar 2022
Profit before tax₹3,382.79₹2,696.34₹1,361.66-₹285.45
Income before WC changes₹6,444.57₹5,561.87₹3,323.27₹1,246.32
Change in Assets-₹6,907.62-₹11,006.85-₹8,650.67-₹466.53
Change in Liabilities₹1,741.78₹53.10₹1,389.44₹2,120.99
Change in WC-₹5,165.84-₹10,953.75-₹7,261.23₹1,654.46
Cash flow from Operations₹128.47-₹6,257.98-₹4,499.26₹2,844.56
Cash flow from Investing-₹5,758.27₹1,135.38-₹2,934.96-₹1,916.67
Cash flow from Financing₹6,957.58₹8,431.59₹7,280.59-₹377.63
Total Cash Flow₹1,327.78₹3,308.99-₹153.63₹550.26
Cash (Start of the year)₹5,217.32₹1,908.58₹2,030.96₹1,481.04
Cash (End of the year)₹6,544.77₹5,217.32₹1,908.58₹2,030.96

Balance Sheet · Consolidated

Balance Sheet · Consolidated — all values in INR Crore
ParticularsMar 2025Mar 2024Mar 2023Mar 2022
Non-Current Assets₹47,474.40₹38,533.92₹30,502.57₹24,962.48
Current Assets₹34,240.24₹29,126.54₹24,243.44₹18,638.30
Total Assets₹81,714.64₹67,660.46₹54,746.01₹43,600.78
Current Liabilities₹26,551.46₹26,679.93₹22,454.95₹18,615.90
Net Current Asset₹7,688.78₹2,446.61₹1,788.49₹22.40
Non-Current Liabilities₹39,318.32₹29,165.94₹21,495.25₹16,394.72
Equity Capital₹15,844.86₹11,814.59₹10,795.81₹8,590.16
Total Equity & Liabilities₹81,714.64₹67,660.46₹54,746.01₹43,600.78

Income Statement · Standalone

Income Statement · Standalone — all values in INR Crore
ParticularsMar 2025Mar 2024Mar 2023Mar 2022
Revenue₹38,752.74₹38,367.03₹36,144.14₹21,688.29
Other Income₹250.25₹246.57₹116.14₹76.13
Total Revenue₹39,002.99₹38,613.60₹36,260.28₹21,764.42
Total Expenses₹34,758.43₹34,727.70₹34,234.49₹21,747.64
Profit Before Tax₹4,348.29₹3,792.18₹2,110.40₹527.61
Tax₹1,045.00₹1,174.31₹730.29-₹14.22
Profit After Tax₹3,303.29₹2,617.87₹1,380.11₹541.83
EPS - Basic₹11.25₹8.92₹4.70₹1.85
EPS - Diluted₹11.23₹8.90₹4.70₹1.84

Cash Flow · Standalone

Cash Flow · Standalone — all values in INR Crore
ParticularsMar 2025Mar 2024Mar 2023Mar 2022
Profit before tax₹3,303.29₹2,617.87₹1,380.11₹541.83
Income before WC changes₹5,019.47₹4,650.54₹2,962.76₹1,005.89
Change in Assets₹2,482.18-₹1,197.23-₹1,653.39-₹220.33
Change in Liabilities₹1,258.50-₹325.66₹1,226.85₹1,789.95
Change in WC₹3,740.68-₹1,522.89-₹426.54₹1,569.62
Cash flow from Operations₹7,819.42₹2,503.12₹2,136.01₹2,646.93
Cash flow from Investing-₹4,077.86₹902.13-₹1,734.53-₹1,458.91
Cash flow from Financing-₹3,023.50-₹1,917.47-₹940.17-₹723.76
Total Cash Flow₹718.06₹1,487.78-₹538.69₹464.26
Cash (Start of the year)₹1,941.87₹454.11₹994.25₹530.13
Cash (End of the year)₹2,659.82₹1,941.87₹454.11₹994.25

Balance Sheet · Standalone

Balance Sheet · Standalone — all values in INR Crore
ParticularsMar 2025Mar 2024Mar 2023Mar 2022
Non-Current Assets₹13,193.53₹11,948.66₹10,888.01₹10,826.64
Current Assets₹12,332.30₹11,663.09₹11,703.62₹9,507.14
Total Assets₹25,525.83₹23,611.75₹22,591.63₹20,333.78
Current Liabilities₹11,430.78₹12,055.20₹11,072.80₹9,547.29
Net Current Asset₹901.52-₹392.11₹630.82-₹40.15
Non-Current Liabilities₹2,576.26₹2,746.18₹3,093.03₹3,449.59
Equity Capital₹11,518.79₹8,810.37₹8,425.80₹7,336.90
Total Equity & Liabilities₹25,525.83₹23,611.75₹22,591.63₹20,333.78
* All values are in INR Crore
Qty
Bid
0
0
0
0
0
0
0
0
0
0
Ask
Qty
164.35
8818
0
0
0
0
0
0
0
0
Bid Total: 0
Ask Total: 8818
Buy orders: 0%
Sell orders: 100%

About Ashok Leyland

Ashok Leyland logo
ISIN
INE208A01029
Sector Market Cap
₹ 96,771.8 Cr

Established in: 1948

Managing director: Shenu Agarwal

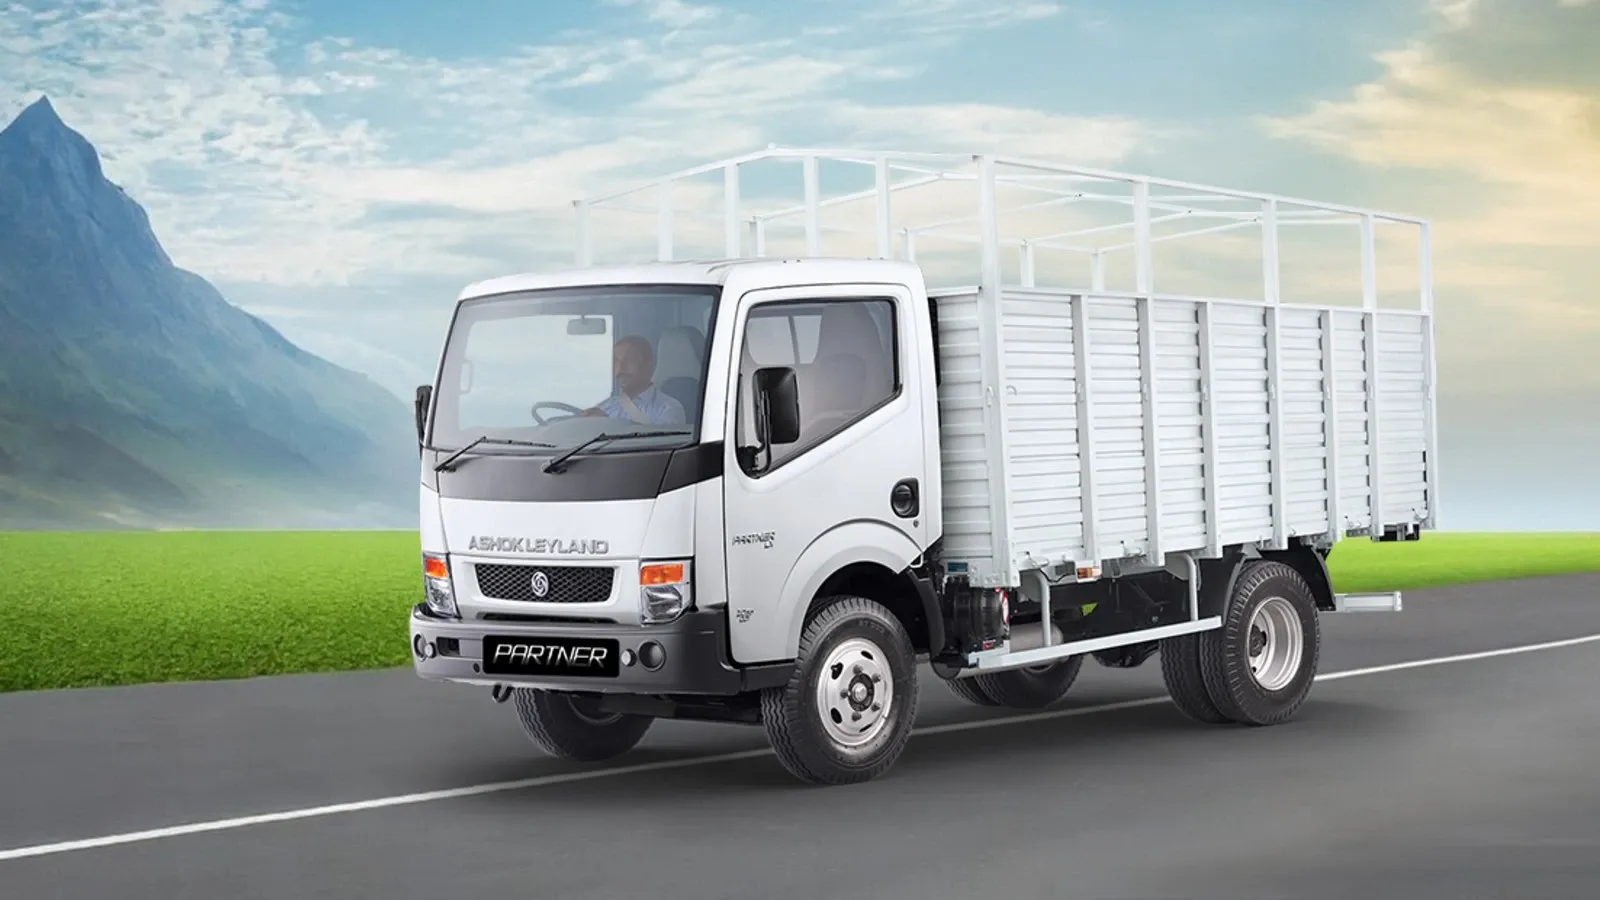
Ashok Leyland Ltd is the leading commercial vehicle manufacturer in India. It manufactures buses, trucks, engines and defence vehicles. The company’s portfolio includes exclusive models like double-decker buses, designed for computing in all types of roads.

For 18-seater minibuses to 82-seater double-decker buses and from light commercial vehicles to 49-ton trucks, Ashok Leyland offers a diverse range of products to its customers.

With a strong focus on fuel efficiency, innovation and sustainable mobility, Ashok Leyland continues to benefit from India’s infrastructure growth and rising transport demand.

History of Ashok Leyland Ltd

Ashok Leyland Ltd was established in 1948 as Ashok Motors to assemble and manufacture vehicles in India. In 1955, the company entered into a collaboration with UK-based automobile manufacturer, Leyland Motors. Later, when Leyland Motors acquired the majority stake in Ashok Motors, the company was renamed Ashok Leyland.

This marked the beginning of Ashok Leyland's entry into the manufacturing of commercial vehicles in India in 1955. Over the years, it evolved into a major commercial vehicle manufacturer, expanding its product range across trucks, buses, defence vehicles and power solutions.

In 1987, Ashok Leyland Ltd became a part of the Hinduja Group, and the company strengthened its global presence and technology capabilities, emerging as a trusted name in the commercial vehicle industry.

Business Segment of Ashok Leyland Ltd

The business of Ashok Leyland Ltd was divided into five segments.

  1. Medium and Heavy Commercial Vehicles: In this segment, the company manufactures heavy ton trucks used in logistics, construction, mining and infrastructure projects.

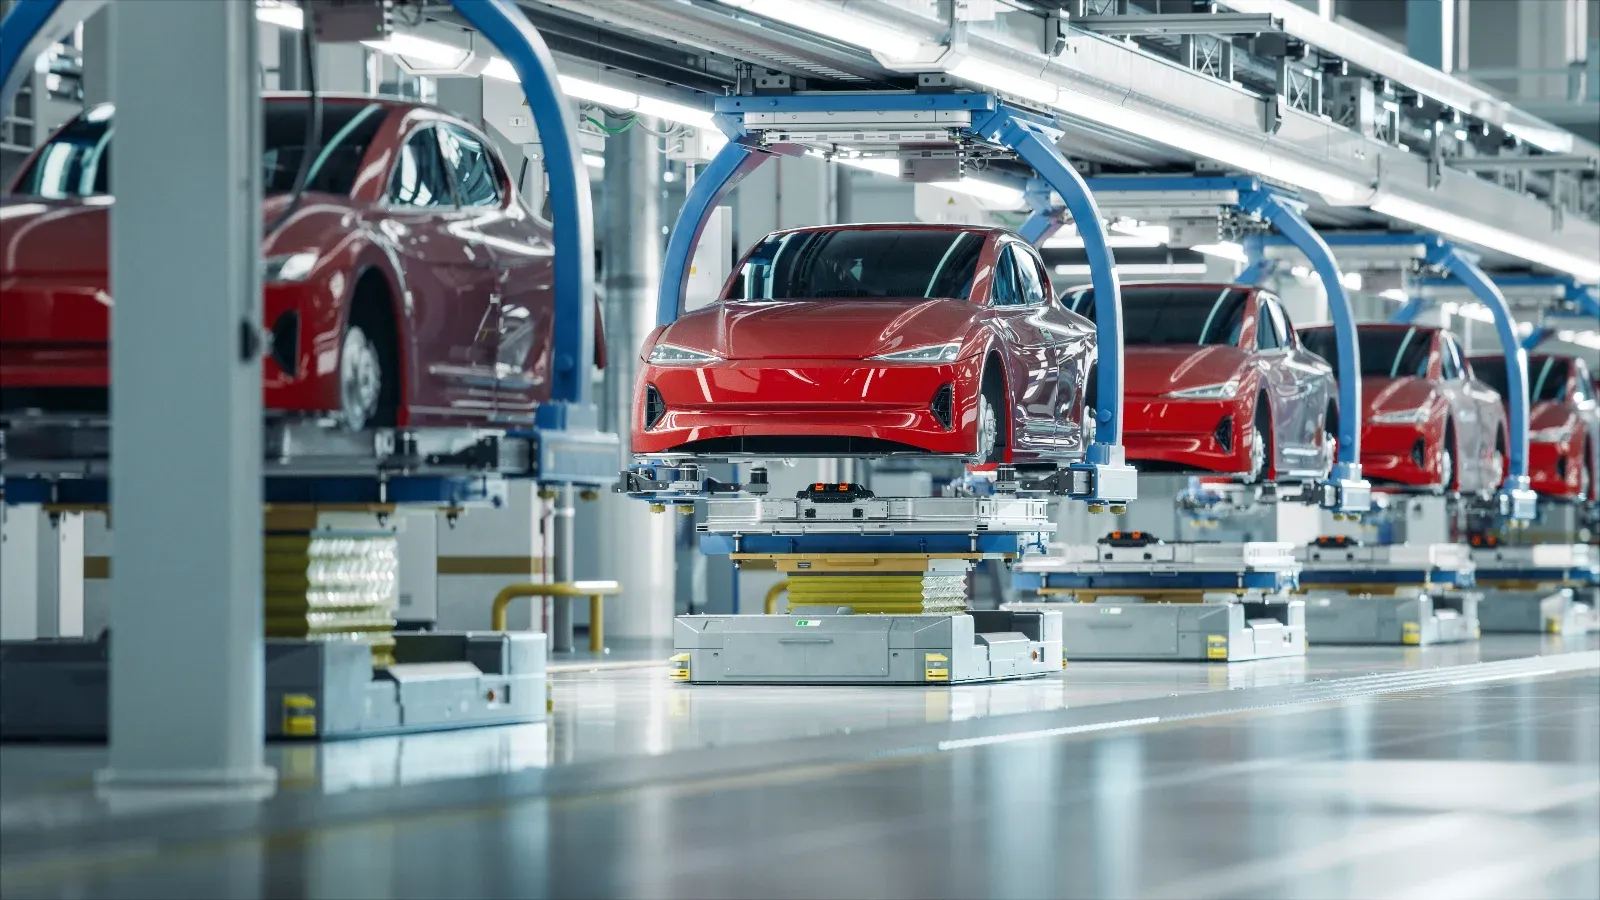
  2. Buses: The company also manufactures a variety of buses, from electric vehicles to double-decker buses, which are used for public transport purposes.

  3. Light Commercial Vehicles: This segment covers light commercial vehicles, which provide last-mile delivery to small businesses.

  4. Defence Vehicles: The company is also engaged in manufacturing military trucks, mobility systems and specialised vehicles for defence and paramilitary forces.

  5. Power Solutions and Engines: It also designs and supplies industrial engines and power solutions for marine, genset and industrial applications.

Subsidiaries of Ashok Leyland Ltd

Ashok Leyland Ltd has a diversified portfolio of subsidiaries focused on commercial vehicles, electric mobility and financial services. The key subsidiaries are:

  • Hinduja Leyland Finance Ltd
  • Switch Mobility Ltd
  • Hinduja Tech Limited
  • OHM Global Mobility Pvt Ltd
  • Lanka Ashok Leyland

Revenue Model of Ashok Leyland Ltd

Ashok Leyland Ltd earns the majority of its revenue from the sale of commercial vehicles across domestic markets and exports. A steady income comes from the sale of spare parts, after-sales services and maintenance.

The company further monetises its defence contracts, engine supplies and power solutions. Additionally, financing, leasing and service-related offerings support vehicle sales, which help to build long-term customer relationships for a sustainable revenue model.

Ashok Leyland Ltd Financial Performance (FY25 vs FY24)

Revenue: Ashok Leyland Ltd reported consolidated revenue of ₹48,893.60 crore in FY25 vs ₹45,931.22 crore in FY24. It showed an increase of 6.44% on a yearly basis, reflecting decent growth.

Operating Profit: The company reported an operating profit of ₹4,596.33 crore in FY25 vs ₹4,106.07 crore in FY24. It showed an increase of 11.93% on a year-on-year basis, indicating that the company's operating profit is growing well.

Net Profit: Ashok Leyland Ltd reported a net profit of ₹3,382.79 crore in FY25 compared to ₹2,696.34 crore in FY24. It showed an increase of 25.82% on a yearly basis, indicating an improvement in overall performance.

Ashok Leyland Financial Highlights

  • Revenue: Ashok Leyland reported revenue of ₹56,946.90 crore in FY26 vs ₹48,893.60 crore in FY25. It showed an increase of 16.47% on a yearly basis.
  • Operating Profit: Ashok Leyland reported an operating profit of ₹5,154.79 crore in FY26 vs ₹4,596.33 crore in FY25. It showed an increase of 12.15% on a year-on-year basis.
  • Net Profit: Ashok Leyland reported a net profit of ₹3,720.98 crore in FY26 vs ₹3,382.79 crore in FY25. It showed an increase of 10.00% on a yearly basis.

Ashok Leyland Quarterly Result Highlights

  • Ashok Leyland reported revenue of ₹17,417.30 crore in Mar 2026, compared with ₹15,010.65 crore in Dec 2025, representing an increase of 16.03% on a quarter-on-quarter (QoQ) basis.
  • Ashok Leyland reported an operating profit of ₹1,939.78 crore in Mar 2026, compared with ₹1,199.59 crore in Dec 2025, representing an increase of 61.70% on a quarter-on-quarter (QoQ) basis.
  • Ashok Leyland reported a profit of ₹1,381.32 crore in Mar 2026, compared with ₹862.24 crore in Dec 2025, reflecting an increase of 60.20% on a QoQ basis.
  • The earnings per share (EPS) of Ashok Leyland stood at ₹10.58 during Mar 2026.
Know more
Promoters
51.51%
FII
24.57%
Other DII
5.14%
Retail and other
10.85%
Mutual funds
7.92%
Foreign institutions - FII
Compare against other stocks
Ashok Leyland logo
Ashok Leyland
Automobile
Add Stock
Add Another

FAQs on Ashok Leyland Share Price