Established in: 1968
Managing Director: Nilesh Gupta
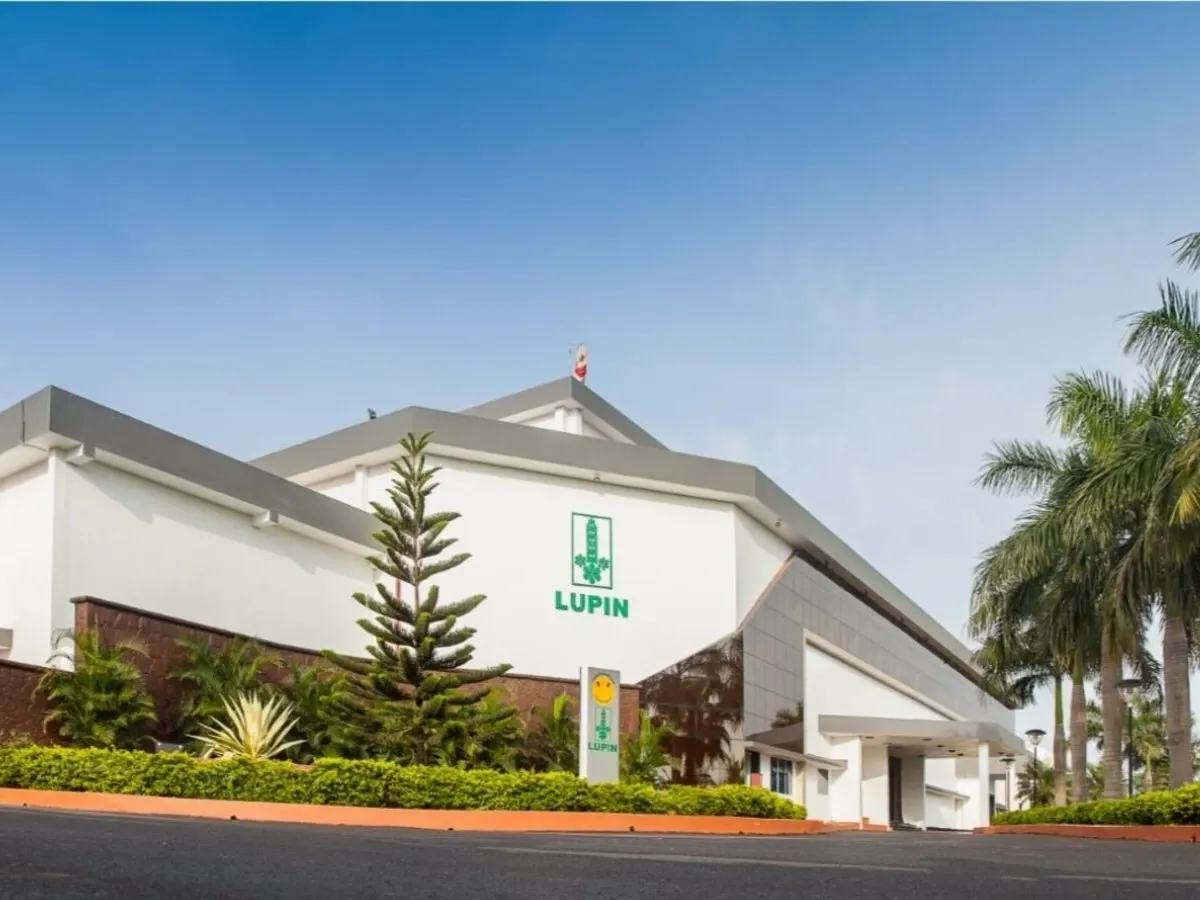
Lupin Limited is a multinational pharmaceutical company headquartered in Mumbai. The company primarily manufactures generic drugs, and covers therapeutic areas such as paediatrics, cardiovascular, anti-infectives, diabetology, asthma and anti-tuberculosis. Lupin Limited operates across multiple international markets such as the United States of America, Japan, Europe and Australia.
Lupin Limited launched its IPO and went public in 1993. The company is listed on the BSE Limited and the National Stock Exchange of India (NSE) under the ticker symbol LUPIN.
History of Lupin Limited
Lupin Limited was established by Desh Bandhu Gupta, professor of chemistry at BITS-Pilani, Rajasthan, in 1968. Desh Bandhu Gupta borrowed 5000 from his family to set up the company. Later, the company obtained funding from the Central Bank of India and established its manufacturing facilities for producing folic acid and iron tablets for the government’s mother and child health initiative.
In the following years, Lupin Limited began manufacturing anti-tuberculosis drugs, which accounted for 36% of the company’s sales. At that point in time, the company was considered the largest TB drugs manufacturer in the world.
In 2016, Lupin Limited acquired Gavis Pharmaceuticals and Novel Laboratories for $880 million. In May 2023, Lupin Limited acquired the French pharmaceutical company Medisol for over Rs 160 crore.
Business Segments of Lupin Limited
The following are the business segments of Lupin Limited.
The company develops and distributes a wide variety of generic, complex generic and over-the-counter (OTC) medicines and exports them to over 100 countries.
Lupin Limited holds a significant market share in the therapeutic sector and boasts high sales in it, especially in cardiovascular, diabetology, respiratory, paediatrics, and the Central Nervous System.
- Specialty Pharmaceuticals
The speciality pharmaceutical segment focuses on niche markets with high value, such as women’s health, rare neurological disorders and ophthalmology.
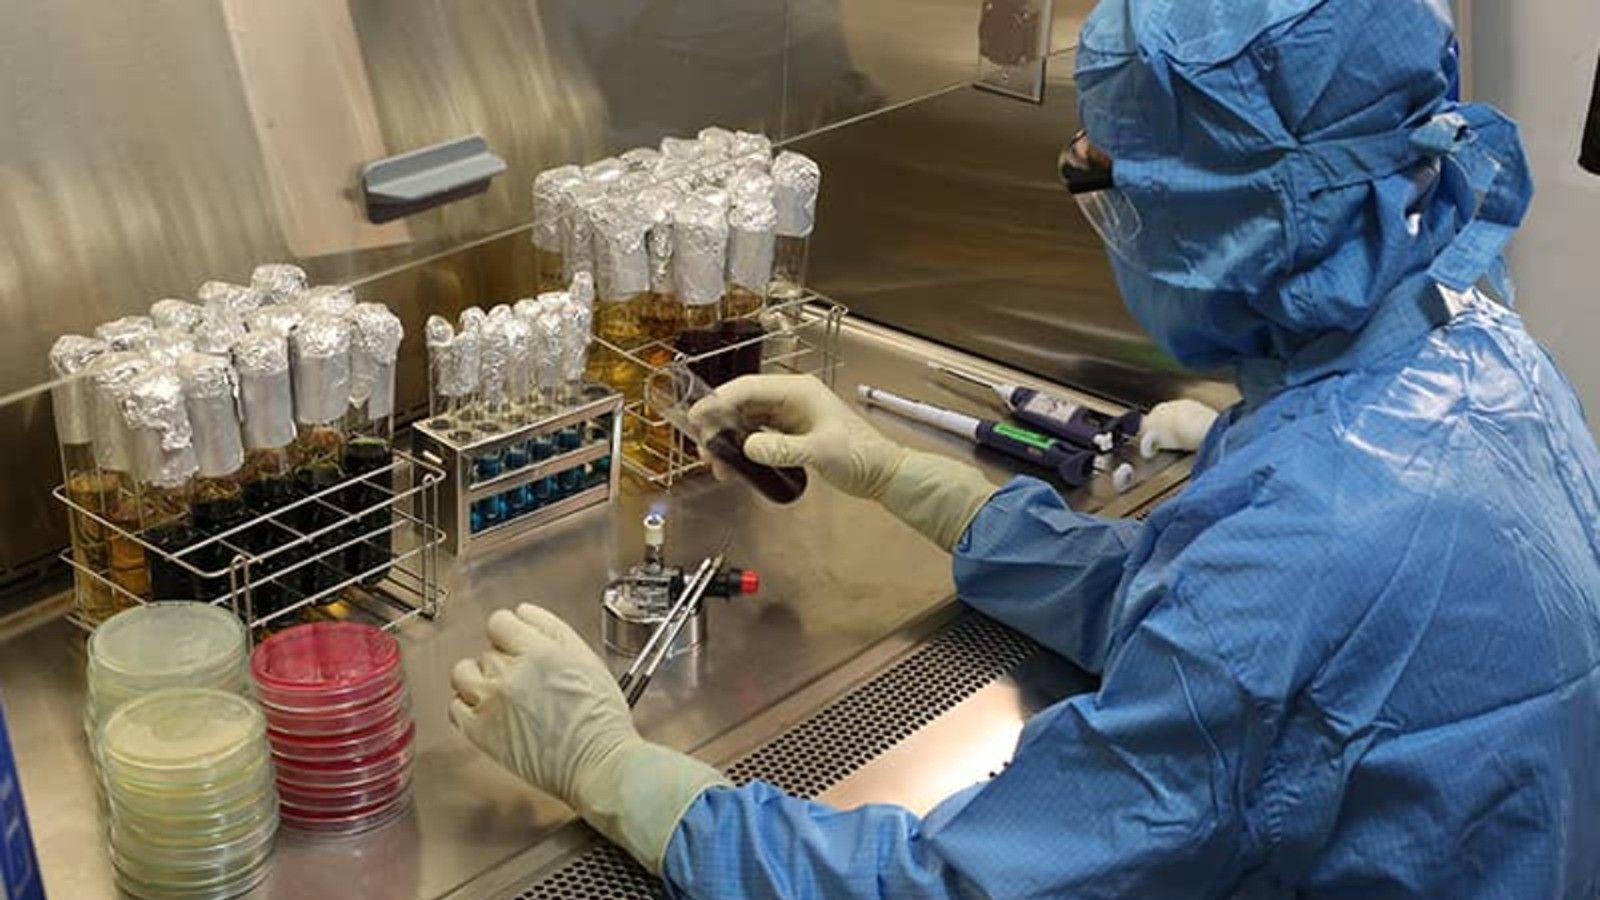
The company researches, manufactures, and distributes high-quality biological medicines through the Lupin Biotech division, aiming to make treatments affordable and accessible around the world.
- Active Pharmaceutical Ingredients (API)
Lupin Limited is a global manufacturer of APIs, serving both internal pharmaceutical formulations and external drug manufacturers.
- Global Institutional Business (GIB)
This segment offers affordable and high-quality medications for critical illnesses such as tuberculosis to underserved and impoverished sections of society and international health organisations.
The company is expanding its operations and entering into modern and adjacent healthcare segments by establishing Lupin Diagnostics, Lupin Digital Health and neuro-rehabilitation centres.
Subsidiaries of Lupin Limited
The following are the subsidiaries of Lupin Limited.
- Lupin Pharmaceuticals, Incorporated in the USA.
- Lupin Pharma Canada Limited in Canada.
- Laboratorios Grin, S.A. de C.V. in Mexico.
- Medquímica Indústria Farmacêutica LTDA in Brazil.
- Pharma Dynamics (Proprietary) Limited in South Africa.
- Nanomi B.V. in the Netherlands.
- Medisol S.A.S. in France.
- Lupin Lanka Private Limited in Sri Lanka.
Awards and Recognition Received by Lupin Limited
The following are the awards and recognitions received by Lupin Limited.
- The company received the Excellence in Patient Support Program by the India Pharma Awards
- Patient-Centric Pharmaceutical Company of the Year by IHW Patient First Awards
- Most Innovative Patient Care Initiative by Healthcare Asia Award
- Best Social Welfare Initiative of the Year by CSR Summit & Awards
- Lupin Limited won the ATD BEST Award by the Association for Talent Development
- Received Digital Pharma Marketing Excellence Award by DIGIPHARMAX Conclave
- The company won the Global Best Project Award of Merit in the Manufacturing Category by Engineering News-Record
- The company received the Gold Award from the American Society for Quality
- Lupin Limited won the India Packaging Award for Innovation in Patient Awareness & Design by UBM India
Lupin Financial Highlights
- Revenue: Lupin reported revenue of ₹28,382.48 crore in FY26 vs ₹22,903.72 crore in FY25. It showed an increase of 23.92% on a yearly basis.
- Operating Profit: Lupin reported an operating profit of ₹6,872.55 crore in FY26 vs ₹4,015.00 crore in FY25. It showed an increase of 71.17% on a year-on-year basis.
- Net Profit: Lupin reported a net profit of ₹5,355.47 crore in FY26 vs ₹3,306.26 crore in FY25. It showed an increase of 61.98% on a yearly basis.
Lupin Quarterly Result Highlights
- Lupin reported revenue of ₹7,615.37 crore in Mar 2026, compared with ₹7,282.22 crore in Dec 2025, representing an increase of 4.57% on a quarter-on-quarter (QoQ) basis.
- Lupin reported an operating profit of ₹1,928.00 crore in Mar 2026, compared with ₹1,522.04 crore in Dec 2025, representing an increase of 26.67% on a quarter-on-quarter (QoQ) basis.
- Lupin reported a profit of ₹1,468.67 crore in Mar 2026, compared with ₹1,180.51 crore in Dec 2025, reflecting an increase of 24.41% on a QoQ basis.
- The earnings per share (EPS) of Lupin stood at ₹116.75 during Mar 2026.