As of 6 Jul 2026, Sobha share price is ₹1,442.90. The stock opened at ₹1,440.00, compared to its previous close of ₹1,434.60. During today's trading session, Sobha share price moved in the range of ₹1,430.10 to ₹1,461.00, with an average price of ₹1,445.55 for the day. Looking at its last 52-week, the stock has touched a low of ₹1,130.00 and a high of ₹1,732.50. On the performance front, Sobha share price has declined by 3.20% over the last six months and is down 4.58% on a year-on-year basis.
| Name | Mkt Cap Cr | P/E | P/B | ROE | D/E | ROCE | Book Value | Div. Yield | Turnover | EPS(TTM) |
|---|---|---|---|---|---|---|---|---|---|---|
| DLF | 1,62,776.00 | 36.88 | 3.58 | 9.71% | 0.00 | 6.65% | 127.61 | 1.22% | 0.12 | 15.14 |
| Macrotech Developers | 1,00,419.00 | 29.27 | 4.40 | 14.72% | 0.48 | 15.00% | 217.92 | 0.42% | 0.55 | 29.25 |
| The Phoenix Mills | 71,909.00 | 46.20 | 6.54 | 11.14% | 0.12 | 13.99% | 153.89 | 0.12% | 0.09 | 7.57 |
| Prestige Estate | 72,132.20 | 55.25 | 4.43 | 7.35% | 0.76 | 9.65% | 277.79 | 0.12% | 0.28 | 4.25 |
| Oberoi Realty | 67,815.50 | 20.55 | 2.88 | 14.91% | 0.20 | 17.12% | 3.20 | 0.56% | 0.26 | 54.53 |
| Godrej Properties | 59,287.30 | 32.21 | 3.10 | 9.66% | 0.85 | 7.66% | 590.69 | 0.51% | 0.07 | 11.58 |
| Anant Raj | 19,334.40 | 34.71 | 3.34 | 9.59% | 0.06 | 10.33% | 140.66 | 0.19% | 0.28 | 8.50 |
| Prime Focus | 18,884.20 | 62.68 | 9.04 | 10.47% | 0.03 | 10.82% | 91.38 | 0.00% | 0.00 | -0.05 |
| Brigade Enter | 16,348.90 | 22.56 | 2.40 | 9.45% | 0.48 | 9.82% | 194.49 | 0.30% | 0.30 | 11.35 |
| Century Textiles | 15,891.50 | -138.40 | 4.29 | -8.10% | 0.89 | -3.95% | 420.15 | 0.18% | 0.03 | 31.84 |
| Particulars | Mar 2025 | Mar 2024 | Mar 2023 | Mar 2022 |
|---|---|---|---|---|
| Revenue | ₹4,038.69 | ₹3,096.95 | ₹3,310.11 | ₹2,561.26 |
| Other Income | ₹124.07 | ₹120.94 | ₹92.32 | ₹83.97 |
| Total Revenue | ₹4,162.76 | ₹3,217.88 | ₹3,402.43 | ₹2,645.23 |
| Total Expenses | ₹4,029.76 | ₹3,143.65 | ₹3,257.46 | ₹2,408.60 |
| Profit Before Tax | ₹133.00 | ₹74.23 | ₹144.98 | ₹236.63 |
| Tax | ₹38.32 | ₹25.11 | ₹40.77 | ₹63.44 |
| Profit After Tax | ₹94.69 | ₹49.11 | ₹104.21 | ₹173.19 |
| EPS - Basic | ₹9.28 | ₹5.18 | ₹10.99 | ₹18.26 |
| EPS - Diluted | ₹9.28 | ₹5.18 | ₹10.99 | ₹18.26 |
| Particulars | Mar 2025 | Mar 2024 | Mar 2023 | Mar 2022 |
|---|---|---|---|---|
| Profit before tax | ₹133.00 | ₹74.23 | ₹144.98 | ₹236.63 |
| Income before WC changes | ₹399.46 | ₹326.64 | ₹460.54 | ₹556.76 |
| Change in Assets | -₹2,270.62 | -₹728.12 | -₹781.67 | -₹84.78 |
| Change in Liabilities | ₹2,228.82 | ₹1,126.09 | ₹1,539.24 | ₹405.96 |
| Change in WC | -₹41.79 | ₹397.97 | ₹757.58 | ₹321.18 |
| Cash flow from Operations | ₹199.92 | ₹647.44 | ₹1,150.21 | ₹826.46 |
| Cash flow from Investing | -₹1,179.94 | -₹474.93 | -₹236.84 | ₹38.21 |
| Cash flow from Financing | ₹992.84 | -₹338.16 | -₹773.05 | -₹889.34 |
| Total Cash Flow | ₹12.83 | -₹165.66 | ₹140.32 | -₹24.67 |
| Cash (Start of the year) | ₹113.73 | ₹279.39 | ₹139.07 | ₹163.74 |
| Cash (End of the year) | ₹126.56 | ₹113.73 | ₹279.39 | ₹139.07 |
| Particulars | Mar 2025 | Mar 2024 | Mar 2023 | Mar 2022 |
|---|---|---|---|---|
| Non-Current Assets | ₹2,555.26 | ₹2,453.74 | ₹2,107.68 | ₹1,580.05 |
| Current Assets | ₹14,665.77 | ₹11,242.75 | ₹10,480.57 | ₹9,961.87 |
| Total Assets | ₹17,221.03 | ₹13,696.49 | ₹12,588.24 | ₹11,541.92 |
| Current Liabilities | ₹11,709.22 | ₹10,405.23 | ₹9,424.17 | ₹8,704.79 |
| Net Current Asset | ₹2,956.55 | ₹837.52 | ₹1,056.40 | ₹1,257.08 |
| Non-Current Liabilities | ₹951.31 | ₹777.19 | ₹669.40 | ₹414.22 |
| Equity Capital | ₹4,560.51 | ₹2,514.07 | ₹2,494.67 | ₹2,422.91 |
| Total Equity & Liabilities | ₹17,221.03 | ₹13,696.49 | ₹12,588.24 | ₹11,541.92 |
| Particulars | Mar 2026 | Mar 2025 | Mar 2024 | Mar 2023 |
|---|---|---|---|---|
| Revenue | ₹5,367.66 | ₹4,066.67 | ₹3,091.95 | ₹3,328.09 |
| Other Income | ₹219.32 | ₹135.81 | ₹130.70 | ₹97.78 |
| Total Revenue | ₹5,586.98 | ₹4,202.48 | ₹3,222.65 | ₹3,425.87 |
| Total Expenses | ₹5,182.58 | ₹4,048.72 | ₹3,154.28 | ₹3,294.16 |
| Profit Before Tax | ₹404.40 | ₹153.76 | ₹68.36 | ₹131.71 |
| Tax | ₹103.09 | ₹41.52 | ₹21.80 | ₹36.42 |
| Profit After Tax | ₹301.31 | ₹112.23 | ₹46.57 | ₹95.29 |
| EPS - Basic | ₹28.18 | ₹10.99 | ₹4.91 | ₹10.05 |
| EPS - Diluted | ₹28.18 | ₹10.99 | ₹4.91 | ₹10.05 |
| Particulars | Mar 2026 | Mar 2025 | Mar 2024 | Mar 2023 |
|---|---|---|---|---|
| Profit before tax | ₹404.40 | ₹153.76 | ₹68.36 | ₹131.71 |
| Income before WC changes | ₹446.55 | ₹395.75 | ₹302.18 | ₹425.36 |
| Change in Assets | -₹1,702.50 | -₹2,097.43 | -₹623.77 | -₹701.54 |
| Change in Liabilities | ₹1,965.30 | ₹2,030.85 | ₹1,075.04 | ₹1,504.60 |
| Change in WC | ₹262.80 | -₹66.58 | ₹451.27 | ₹803.05 |
| Cash flow from Operations | ₹491.83 | ₹178.46 | ₹684.05 | ₹1,172.67 |
| Cash flow from Investing | -₹179.66 | -₹1,180.90 | -₹528.46 | -₹276.40 |
| Cash flow from Financing | -₹270.26 | ₹1,010.16 | -₹323.30 | -₹758.53 |
| Total Cash Flow | ₹41.92 | ₹7.72 | -₹167.72 | ₹137.75 |
| Cash (Start of the year) | ₹112.35 | ₹104.63 | ₹272.35 | ₹134.60 |
| Cash (End of the year) | ₹154.27 | ₹112.35 | ₹104.63 | ₹272.35 |
| Particulars | Mar 2026 | Mar 2025 | Mar 2024 | Mar 2023 |
|---|---|---|---|---|
| Non-Current Assets | ₹3,135.21 | ₹2,502.90 | ₹2,421.22 | ₹2,071.50 |
| Current Assets | ₹15,494.71 | ₹14,043.58 | ₹10,765.49 | ₹10,060.47 |
| Total Assets | ₹18,629.92 | ₹16,546.48 | ₹13,186.70 | ₹12,131.97 |
| Current Liabilities | ₹13,447.50 | ₹11,223.44 | ₹10,111.27 | ₹9,188.92 |
| Net Current Asset | ₹2,047.21 | ₹2,820.14 | ₹654.22 | ₹871.55 |
| Non-Current Liabilities | ₹493.18 | ₹901.14 | ₹717.51 | ₹601.98 |
| Equity Capital | ₹4,689.23 | ₹4,421.90 | ₹2,357.93 | ₹2,341.07 |
| Total Equity & Liabilities | ₹18,629.92 | ₹16,546.48 | ₹13,186.70 | ₹12,131.97 |
Sobha Limited is a multinational real estate developer based in Dubai, UAE. It has a corporate office in Bengaluru, India. The company is focused on developing a diverse range of properties such as corporate offices, IT parks, hotels, hostels, convention centres, multiplexes, training centres, academic institutions and food courts.
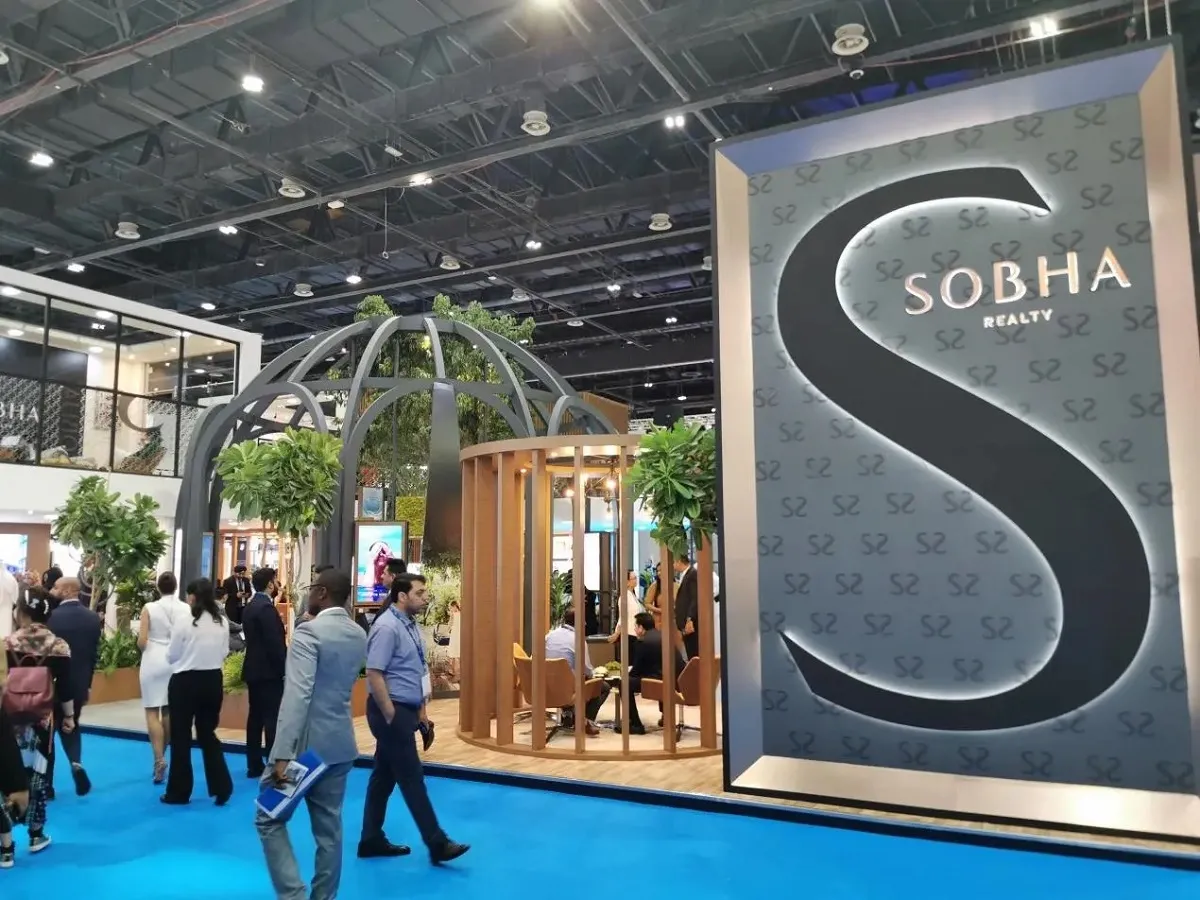
The market capitalisation of Sobha Limited is over ₹12,200 crore as of January 9, 2023. Sobha Limited share price has gained over 170% in the last three years.

Sobha Limited focuses on several key business verticals including real estate, where it specialises in developing residential and commercial properties. Its contractual division deals with EPC (engineering, procurement and construction) contracts, specifically catering to external institutional clients. In the manufacturing division, the real estate company contributes significantly to the construction industry by offering various production capabilities such as concrete, glazing and interiors.
Primarily a construction company, Sobha Limited has ventured into other verticals as well. It manufactures concrete products such as blocks, pavers, kerb stones, water drainage channels, paving slabs, elite landscape items, and glass fiber reinforced concrete (GFRC) products.
Sobha Limited's business operations comprises various divisions: Sobha Interiors Division, Sobha Glazing and Metal Works Division, Sobha Concrete Products, Sobha Projects & Trade Division, Sobha Renaissance Information Technology, S & T Group - Oman, Indeset - UAE and Gulf International Construction & Interiors Company (GICI) - Qatar. It also has a retail division including Sobha Restoplus- Spring Mattress and Sobha Modular Office Furniture.
The company has completed projects spanning 128 million square feet across 27 cities in 14 states, with an additional 35.84 million square feet currently under development. Over the past five years, Sobha Limited's has consistently maintained a strong delivery pace, averaging 5 million square feet annually. The company is a leader in real estate having completed 191 real estate developments totalling 70.34 million square feet across 7 cities as of March 31, 2023.
Among its corporate clients are popular names such as Infosys, LuLu, Biocon, Syngene, Dell, HP, Timken, Taj, Bayer Material Science, HCL, Bharat Forge, ITC, Bosch, GMR and Huawei Technologies.
Sobha Limited is also the only real estate company in India with complete backward integration, covering all in-house capabilities from design to delivery, supported by proficient technicians and an extensive manufacturing setup. Its manufacturing division operates four primary factories in Bengaluru, spanning 25 acres with a shop floor footprint of approximately 1.13 million square feet.
Sobha also runs a glazing and metal works division that operates a cutting-edge facility dedicated to delivering high-quality products to enhance the aesthetics and functionality of projects. Specialising in unitised panels, the division can produce 360 square metres of panels daily, with an output rate of 80 panels per day.
Sobha share price is ₹1,442.90 as on 03 Jul, 2026, 15:46 IST.
In the last 1 year, Sobha delivered a return of -4.58%. The Sobha share price hit a high of ₹1,732.50 and low of ₹1,130.00.
The Mutual Fund Shareholding in Sobha was 24.51% at the end of Mar 2026.
The 52-week high and low of Sobha share is ₹1,732.50 and ₹1,130.00 as of 03 Jul, 2026.
The market capitalisation of Sobha is ₹15,359.30 Crores as on 03 Jul, 2026.
The stock symbol of Sobha is SOBHA on the NSE, 532784 on the BSE, and the ISIN is INE671H01015.
Sobha shares closed yesterday at ₹1,434.60 on NSE & ₹1,436.35 on BSE
To buy Sobha shares, open a demat account with Upstox and complete the KYC process. Once your account is set up, search for the stock and place your order.
No, shares of Sobha or any other publicly traded company cannot be bought or sold on holidays when the stock exchanges are closed. You can only buy or sell Sobha shares on days when the stock exchanges are open for trading. It's important to check the NSE & BSE holidays calendar, before placing any trades to avoid any inconvenience.
The PE and PB ratio of Sobha is 65.56 and 2.69 respectively, as on 03 Jul, 2026, 15:46 IST.