HEG Share Price

₹ 277.85

-₹2.80 (-1%)
1D
Last updated 13 Nov, 2026, 15:57 IST

HEG Share Price Today

As of 14 Nov 2026, HEG share price is ₹277.85. The stock opened at ₹280.65, compared to its previous close of ₹280.65. During today's trading session, HEG share price moved in the range of ₹274.52 to ₹282.75, with an average price of ₹278.63 for the day. Looking at its last 52-week, the stock has touched a low of ₹191.71 and a high of ₹753.90.

Share price over the last 1 day rose from 276.27 to 279.94, ranging between 275.95 and 281.93.

₹274.52
1.00% down today
₹282.75
1D LOW
1D HIGH

HEG Stock Insights

Latest Earning
Op Profit TrendUp by 202.42% QoQ
Latest Earning
Net Profit TrendUp by 97.03% QoQ
Latest Earning
Revenue TrendUp by 68.61% QoQ
Stock Performance
OutperformingBeat Nifty by 10.68 % in last 1 month
Shareholding Pattern
PromoterPromoter increased stake by 7.90%
Shareholding Pattern
DIIDII increased stake by 389.02%
Shareholding Pattern
FIIFII decreased stake by 57.42%
HEG stock performance
Open₹280.65
High₹282.75
Low₹274.52
Prev. close₹280.65
HEG trading activity
Volume11,71,198
Average traded price₹279.00
Last traded time03:57:57 13 Nov
Last traded quantity201

Circuit
L
H
₹222.28
₹333.42
52-week
L
H
₹191.71
₹753.90
Mkt Cap Cr
9,254.16

P/E
16.53

P/B
3.66

ROA
12.5%
ROE
14.43%

ROCE
14.58%

Quick Ratio
1.34

EV/EBITDA
10.51

Based on fundamentals, this stock's

Performance: 5 out of 5, Excellent
Performance
Excellent
HEG Advanced Materials outperforming all market indices
Valuation: 3 out of 5, Fairly Valued
Valuation
Fairly Valued
HEG Advanced Materials appears to be fairly valued compared to its peers
Earnings: 5 out of 5, Excellent
Earnings
Excellent
HEG Advanced Materials revenue, operating profit and net profit are growing
Peer Comparison
Peer comparison — key ratios
NameMkt Cap CrP/EP/BROAROEROCEQuick RatioEV/EBITDA
Adani Power3,97,071.8621.295.1711.26%23.74%16.45%1.2315.9
NTPC3,09,129.7210.151.455.28%13.92%8.49%0.669.26
Power Grid Corp2,40,699.6314.82.245.37%15.17%8.63%0.5910.62
Adani Green2,31,757.69103.0810.731.19%8.68%6.96%0.5625.44
Adani Energy Solution1,74,882.4945.075.613.77%11.85%10.64%1.1119.68
Tata Power1,11,261.7219.652.683.11%10.4%9.45%0.6510.26
JSW Energy94,057.6633.882.562.02%6.32%6.89%0.7114.6
NHPC76,241.8116.221.743.66%9.89%5.86%1.0214.89
NTPC GREEN ENERGY LIMITED69,913.26106.373.60.98%3.38%3.36%0.2331.87
Torrent Power61,599.6924.782.934.24%11.52%9.97%0.913.51

Auto-generated based on historical fundamentals; not a recommendation to buy/sell.

HEG Company Background

ISIN
INE545A01024
Sector Market Cap
₹ 9,254.16 Cr

Established in: 1972

Managing Director: Ravi Jhunjhunwala

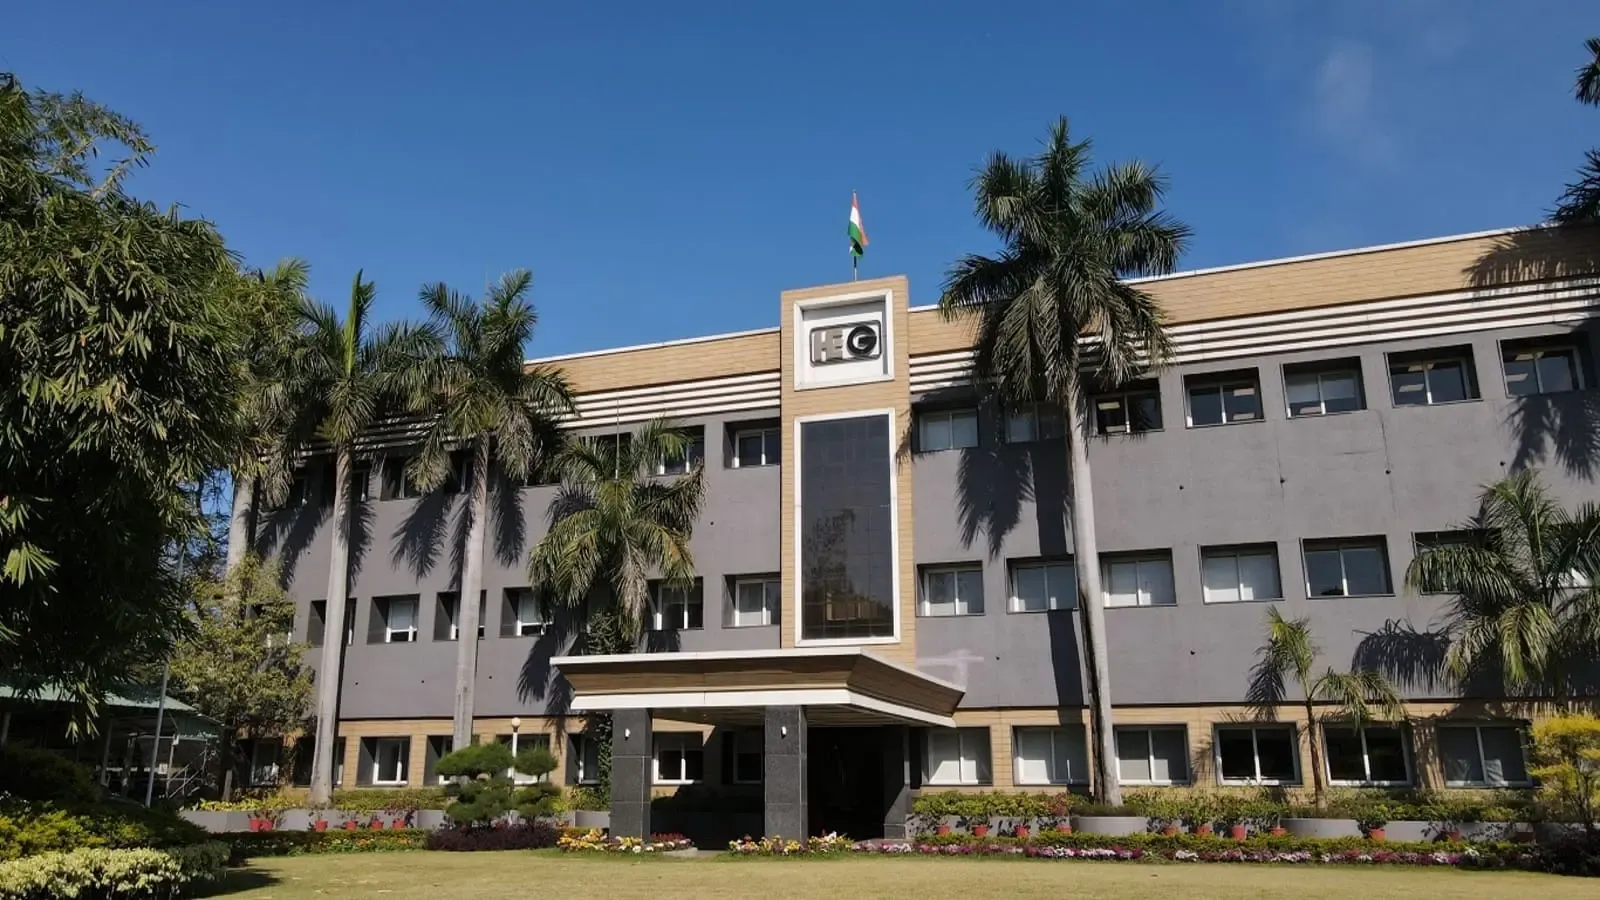
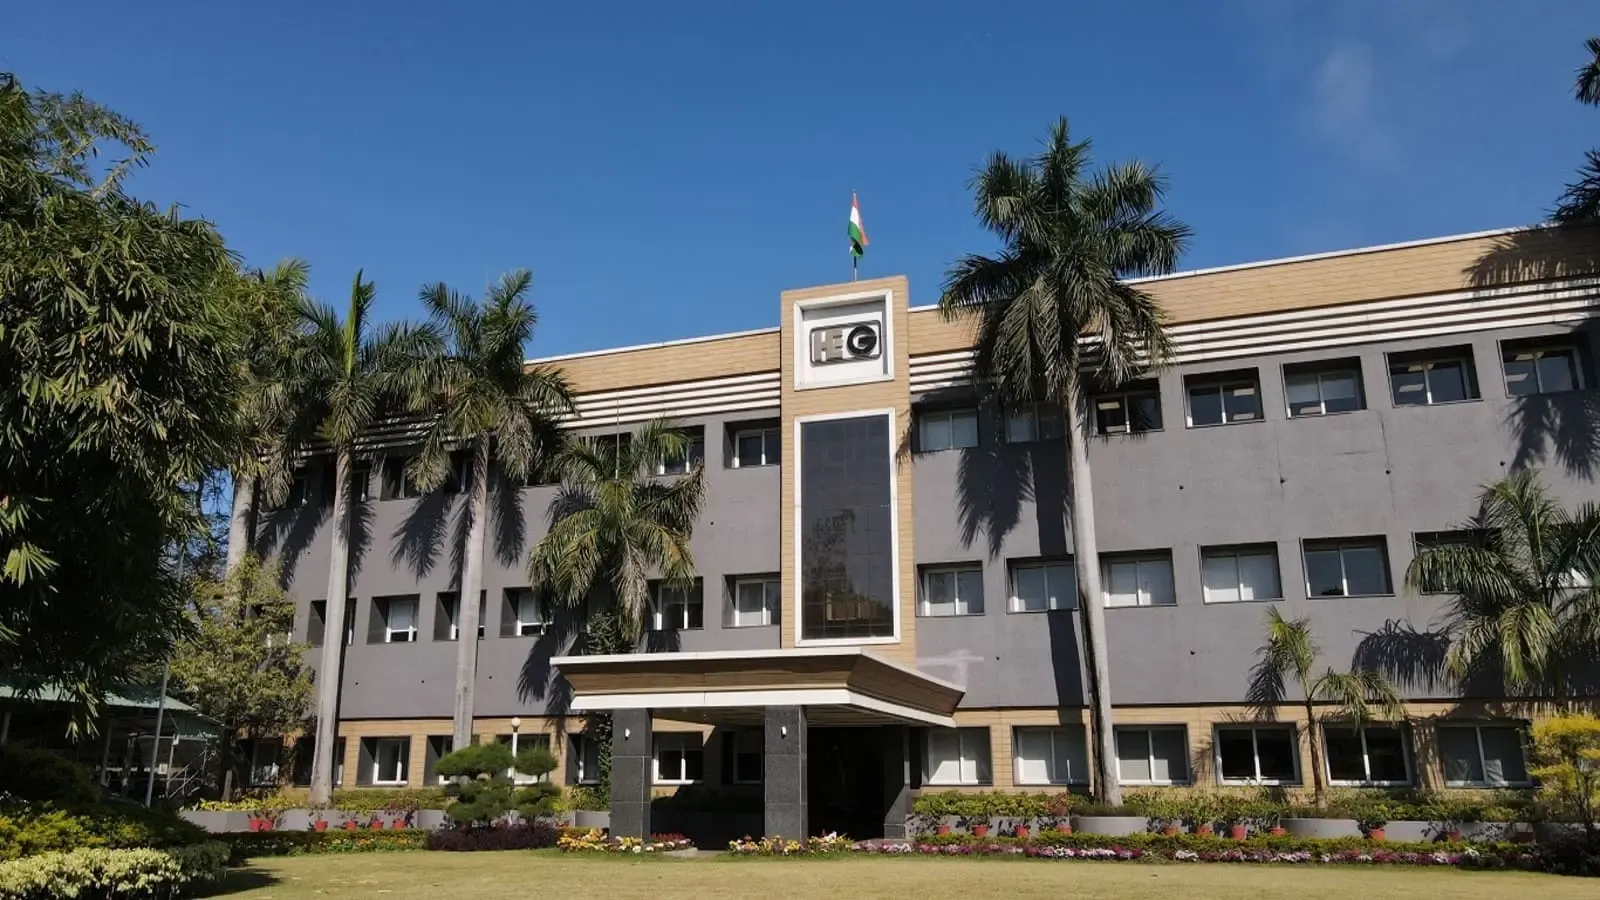
HEG Limited is a leading manufacturer and exporter of graphite electrodes in India. The company is a flagship company of the LNJ Bhilwara Group and is involved in supplying essential components for steel production.

The company produces up to 1,00,000 metric tonnes of Ultra-High Power (UHP) grade graphite electrodes annually, specialising in UHP, Super-High Power (SHP), and High Power (HP) electrodes. HEG Limited exports around 70% of its production to 30+ countries in the world and has global giants such as ArcelorMittal, POSCO, Thyssenkrupp, US Steel, and Nucor as its clients.

HEG Limited launched its IPO and went public, listing on both BSE and the NSE, trading under the ticker symbols 509631 and HEG, respectively.

History of HEG Limited

The company was initially established as Hindustan Electro-Graphites Limited in 1972 and received technical and financial assistance from a French company called La Société des Électrodes et Réfractoires Savoie, which was a subsidiary of Pechiney, to start operations.

In the 1990s, Hindustan Electro-Graphites Limited became a premier global player in the graphite electrodes industry and shifted its focus to producing Ultra High Power (UHP) grades and supplying them to global steel producers.

On 30 October 1991, Hindustan Electro-Graphites Limited officially changed its name to HEG Limited and continued to grow, becoming one of the leading companies in the industry.

Business Segment of HEG Limited

The following are the business segments of HEG Limited.

  • Graphite Electrodes Segment

Producing Graphite Electrodes is the core business operation of HEG Limited, accounting for a significant portion of the company’s revenue. The business segment involves manufacturing and exporting Graphite Electrodes of Ultra High Power (UHP) and High Power (HP) grades along with carbon specialities, mini-rods, and other components. These products are used in Electric Arc Furnaces (EAF) used in steel manufacturing.

HEG Limited operates the world’s largest single-site integrated graphite electrodes plant in Mandideep, Madhya Pradesh and heavily exports a major portion of its production to various countries. Power Generation Segment

The company operates a captive and commercial power segment, which includes two thermal power plants in Mandideep with a total capacity of 63 MW. The company also operates a 13.5 MW hydroelectric power plant at Tawa Nagar. HEG Limited uses these plants to generate power for internal manufacturing processes and external commercial sale.

Subsidiaries of HEG Limited

The following are the subsidiaries of HEG Limited.

  • TACC Limited

TACC Limited is a wholly owned subsidiary of HEG Limited and focuses on producing graphite-based anode materials for lithium-ion and sodium-ion batteries and develops Graphene Nanoplatelets (GNP), Graphene Oxide (GO), and Reduced Graphene Oxide (rGO).

  • HEG Graphite Limited

HEG Graphite Limited is a wholly owned subsidiary that focuses on the manufacture, design, and supply of graphite electrodes.

  • Bhilwara Infotechnology Limited

This subsidiary specialises in designing end-to-end IT solutions aimed to solve complex technology challenges and enable digital transformation.

Awards and Recognition Received by HEG Limited

The following are the awards and recognitions received by HEG Limited.

  • The company received the Highest Export Award by CAPEXIL.
  • The company won the Top Export Award by CAPEXIL.
  • The company received the Rajiv Gandhi National Quality Commendation Award by the Bureau of Indian Standards.
  • HEG Limited received the National Export Award by the Ministry of Commerce, Government of India.
  • The company won the Greentech Environment Excellence Award.

HEG Financial Highlights

  • Revenue: HEG reported revenue of ₹1,115.24 crore in FY26 vs ₹2,280.28 crore in FY25. It showed a decrease of 51.09% on a yearly basis.
  • Operating Profit: HEG reported an operating profit of ₹522.87 crore in FY26 vs ₹165.11 crore in FY25. It showed an increase of 216.68% on a year-on-year basis.
  • Net Profit: HEG reported a net profit of ₹521.91 crore in FY26 vs ₹115.06 crore in FY25. It showed an increase of 353.60% on a yearly basis.

HEG Quarterly Result Highlights

  • HEG reported revenue of ₹546.59 crore in Sep 2026, compared with ₹324.18 crore in Jun 2026, representing an increase of 68.61% on a quarter-on-quarter (QoQ) basis.
  • HEG reported an operating profit of ₹278.53 crore in Sep 2026, compared with ₹92.10 crore in Jun 2026, representing an increase of 202.42% on a quarter-on-quarter (QoQ) basis.
  • HEG reported a profit of ₹306.07 crore in Sep 2026, compared with ₹155.34 crore in Jun 2026, reflecting an increase of 97.03% on a QoQ basis.
  • The earnings per share (EPS) of HEG stood at ₹17.69 during Sep 2026.

Data Source: BSE, Company announcements

Securities shown are illustrative, not recommendations. Past performance does not guarantee future results.

Promoters
60.72%
FII
3.61%
Other DII
8.22%
Retail and other
22.71%
Mutual funds
4.74%
Foreign Institutional Investor (FII)
FII shareholding by period
Dec 20258.53%
Mar 202610.24%
Jun 20268.47%
Sep 20263.61%

HEG Investment Returns

1 day
--

1 week
--

1 month
--

1 year
--

3 years
--

5 years
--

HEG Share Price History

HEG share price history by day, showing open and close prices and the percentage change
Day
Open / Close
Change %
13 Nov 26
₹280.65 / ₹277.85
-1.00%
12 Nov 26
₹295.00 / ₹280.65
-3.00%
11 Nov 26
₹296.40 / ₹289.34
+0.06%
09 Nov 26
₹295.00 / ₹289.18
-1.42%
Show more

HEG Financials

Full statement

Income Statement · Consolidated

Income Statement · Consolidated — all values in INR Crore
ParticularsMar 2026Mar 2025Mar 2024Mar 2023
Revenue₹2,568.50₹2,152.71₹2,394.90₹2,467.24
Other Income₹140.98₹127.57₹141.67₹109.14
Total Revenue₹2,709.49₹2,280.28₹2,536.57₹2,576.38
Total Expenses₹2,420.61₹2,132.65₹2,222.86₹1,977.15
Profit Before Tax₹404.38₹165.10₹395.38₹677.37
Tax₹66.41₹46.50₹83.70₹144.96
Profit After Tax₹337.98₹118.60₹311.68₹532.41
EPS - Basic₹17.69₹5.96₹16.15₹137.95
EPS - Diluted₹17.69₹5.96₹16.15₹137.95

Cash Flow · Consolidated

Cash Flow · Consolidated — all values in INR Crore
ParticularsMar 2026Mar 2025Mar 2024Mar 2023
Profit before tax₹293.76₹142.89₹313.71₹599.22
Income before WC changes₹536.80₹398.15₹414.84₹651.25
Change in Assets-₹323.75-₹71.17₹178.29-₹350.33
Change in Liabilities₹22.44-₹2.55₹54.52-₹39.59
Change in WC-₹301.31-₹73.73₹232.81-₹389.92
Cash flow from Operations₹213.20₹279.71₹612.22₹113.32
Cash flow from Investing-₹320.26-₹208.45-₹184.34-₹21.11
Cash flow from Financing₹96.89-₹159.15-₹324.12-₹99.96
Total Cash Flow-₹10.18-₹87.89₹103.76-₹7.75
Cash (Start of the year)₹50.76₹137.05₹33.29₹41.04
Cash (End of the year)₹40.59₹50.76₹137.05₹33.29

Balance Sheet · Consolidated

Balance Sheet · Consolidated — all values in INR Crore
ParticularsMar 2026Mar 2025Mar 2024Mar 2023
Non-Current Assets₹3,272.40₹3,191.61₹3,071.53₹2,839.50
Current Assets₹2,893.35₹2,456.55₹2,629.83₹2,852.46
Total Assets₹6,165.76₹5,648.16₹5,701.37₹5,691.96
Current Liabilities₹1,310.02₹1,085.49₹1,167.56₹1,316.09
Net Current Asset₹1,583.33₹1,371.07₹1,462.27₹1,536.37
Non-Current Liabilities₹97.81₹108.91₹107.86₹94.93
Equity Capital₹4,757.92₹4,453.77₹4,425.94₹4,280.94
Total Equity & Liabilities₹6,165.76₹5,648.16₹5,701.37₹5,691.96

Income Statement · Standalone

Income Statement · Standalone — all values in INR Crore
ParticularsMar 2026Mar 2025Mar 2024Mar 2023
Revenue₹2,568.50₹2,152.71₹2,394.90₹2,467.24
Other Income₹91.96₹126.68₹141.67₹109.14
Total Revenue₹2,660.47₹2,279.39₹2,536.57₹2,576.38
Total Expenses₹2,414.07₹2,131.57₹2,221.33₹1,975.90
Profit Before Tax₹246.40₹147.81₹315.24₹600.48
Tax₹65.68₹46.50₹83.70₹144.96
Profit After Tax₹180.72₹101.31₹231.54₹455.51
EPS - Basic₹9.36₹5.25₹12.00₹118.02
EPS - Diluted₹9.36₹5.25₹12.00₹118.02

Cash Flow · Standalone

Cash Flow · Standalone — all values in INR Crore
ParticularsMar 2026Mar 2025Mar 2024Mar 2023
Profit before tax₹246.40₹147.81₹315.24₹600.48
Income before WC changes₹528.41₹399.82₹416.37₹652.50
Change in Assets-₹164.25-₹34.31₹209.89-₹347.81
Change in Liabilities₹11.07-₹1.10₹24.03-₹42.20
Change in WC-₹153.18-₹35.41₹233.91-₹390.01
Cash flow from Operations₹354.87₹319.00₹614.85₹114.48
Cash flow from Investing-₹453.39-₹246.37-₹205.02-₹31.11
Cash flow from Financing₹96.89-₹159.14-₹324.12-₹99.96
Total Cash Flow-₹1.63-₹86.50₹85.70-₹16.58
Cash (Start of the year)₹23.65₹110.15₹24.45₹41.04
Cash (End of the year)₹22.02₹23.65₹110.15₹24.45

Balance Sheet · Standalone

Balance Sheet · Standalone — all values in INR Crore
ParticularsMar 2026Mar 2025Mar 2024Mar 2023
Non-Current Assets₹3,164.19₹2,980.31₹2,816.87₹2,644.52
Current Assets₹2,529.35₹2,365.51₹2,599.99₹2,843.63
Total Assets₹5,693.54₹5,345.82₹5,416.86₹5,488.15
Current Liabilities₹1,295.14₹1,081.13₹1,165.39₹1,316.00
Net Current Asset₹1,234.21₹1,284.37₹1,434.60₹1,527.63
Non-Current Liabilities₹95.23₹105.16₹106.39₹94.93
Equity Capital₹4,303.17₹4,159.53₹4,145.08₹4,077.22
Total Equity & Liabilities₹5,693.54₹5,345.82₹5,416.86₹5,488.15
* All values are in INR Crore
HEG market depth
Bid quantityBid priceAsk priceAsk quantity
3248277.8500
0000
0000
0000
0000
Total bid quantity3,248
Total ask quantity0
HEG technical summary
Bearish indicators1
Neutral indicators6
Bullish indicators1
OverallNeutral
by SEBI experts

Expert Pick

EXPPICK
Stop-loss
Stop-loss is locked. Sign in to view.
Entry price
Entry price is locked. Sign in to view.
Target
Target is locked. Sign in to view.
Indicator
Value
Verdict

RSI (14)
53.44
Neutral

ATR (14)
19.15
Neutral

STOCH(9,6)
49.55
Neutral

STOCH RSI (14)
74.38
Neutral

ADX(9)
43.48
Bearish

UO(9)
35.49
Neutral

ROC(12)
21.47
Bullish

WillR(14)
-34.96
Neutral
Period
Simple value
Exponential vaue

5D
286.08
282.14

10D
279.46
275.23

20D
249.15
265.75

50D
271.72
312.62

100D
451.57
393.84
Volume trend — traded volume by day
13 Nov11L
12 Nov29L
11 Nov45L
9 Nov17L
8 Nov34L
Average27L

Technical indicators used here are for indicative purposes only. Kindly do not treat it as an investment or trading advice

Compare against other stocks

HEG
Welding Equipment
Add Stock
Add Another

HEG Returns Calculator

Ex-date: 22 Jul 2026

HEG Latest News

1 month ago
Cello World, Star Health, HEG Advanced Materials shares surge amid spike in volumes

1 month ago
Welspun Corp, Concord, HEG among buzzing stocks as SENSEX soars 600 pts; NIFTY trades above 23,400
1 month ago
HEG shares hit 5% upper circuit after ₹217 crore lithium-ion battery order from Indus Towers
1 month ago
HEG Advanced Materials arm bags ₹218 crore supply order from Indus Towers; check details

2 months ago
HEG Advanced Materials, ESDS, Maruti Suzuki, Zydus Wellness among buzzing stocks as NIFTY, SENSEX down 0.6%

3 months ago
NTPC Green, CIE Automotive, HEG shares spurt amid heavy volumes; check full list
3 months ago
Eternal, IndusInd Bank, NTPC Green Energy among buzzing stocks as SENSEX falls 500 pts, NIFTY below 23,850
3 months ago
HEG shares surge 13% as net profit grows 16%; everything investors need to know from Q1 FY27 earnings
Showing news item 1 of 8

HEG Share Price FAQs


Please be aware that HEG stock prices are subject to continuous fluctuations due to various factors.