As of 6 Jul 2026, NTPC share price is ₹356.65. The stock opened at ₹356.00, compared to its previous close of ₹356.45. During today's trading session, NTPC share price moved in the range of ₹354.65 to ₹357.40, with an average price of ₹356.02 for the day. Looking at its last 52-week, the stock has touched a low of ₹315.55 and a high of ₹414.40. On the performance front, NTPC share price has increased by 1.24% over the last six months and is up 6.53% on a year-on-year basis.
| Name | Mkt Cap Cr | P/E | P/B | ROE | D/E | ROCE | Book Value | Div. Yield | Turnover | EPS(TTM) |
|---|---|---|---|---|---|---|---|---|---|---|
| Adani Power | 4,33,134.00 | 22.60 | 4.68 | 21.39% | 0.85 | 16.60% | 5.69 | 0.00% | 0.43 | 5.67 |
| Power Grid Corp | 2,68,043.00 | 16.82 | 2.67 | 15.85% | 1.48 | 8.81% | 107.44 | 4.69% | 0.17 | 17.12 |
| Adani Green | 2,56,185.00 | 80.44 | 6.89 | 13.72% | 1.85 | 7.96% | 8.92 | 0.00% | 0.59 | 3.59 |
| Adani Energy Solution | 1,86,980.00 | 49.17 | 4.49 | 10.08% | 0.46 | 9.53% | 5.37 | 0.00% | 0.11 | 4.75 |
| Tata Power | 1,19,905.00 | 32.28 | 3.12 | 13.59% | 1.26 | 9.58% | 6.82 | 0.66% | 0.32 | 3.52 |
| SIEMENS ENERGY INDIA LTD | 1,26,384.00 | 93.81 | 25.29 | 25.11% | 0.03 | 31.50% | 123.03 | 0.13% | 0.86 | 30.89 |
| JSW Energy | 1,03,674.00 | 37.05 | 2.76 | 9.51% | 0.53 | 8.34% | 3.51 | 0.42% | 0.09 | 4.92 |
| NHPC | 80,892.70 | 19.19 | 1.95 | 9.09% | 1.11 | 5.23% | 39.79 | 2.00% | 0.12 | 3.60 |
| NTPC GREEN ENERGY LIMITED | 81,280.40 | 155.58 | 4.29 | 2.76% | 0.48 | 2.95% | 22.42 | 0.00% | 0.06 | 0.48 |
| Torrent Power | 70,219.00 | 28.44 | 3.68 | 12.67% | 0.44 | 12.11% | 378.40 | 1.46% | 0.74 | 51.10 |
| Particulars | Mar 2025 | Mar 2024 | Mar 2023 | Mar 2022 |
|---|---|---|---|---|
| Revenue | ₹188,138.06 | ₹178,524.80 | ₹176,207.18 | ₹132,669.28 |
| Other Income | ₹2,724.39 | ₹2,641.06 | ₹1,769.21 | ₹2,325.03 |
| Total Revenue | ₹190,862.45 | ₹181,165.86 | ₹177,976.39 | ₹134,994.31 |
| Total Expenses | ₹164,579.75 | ₹155,660.01 | ₹154,425.57 | ₹115,493.53 |
| Profit Before Tax | ₹28,496.41 | ₹27,141.45 | ₹24,330.59 | ₹20,520.91 |
| Tax | ₹8,245.18 | ₹6,809.20 | ₹6,796.12 | ₹5,047.10 |
| Profit After Tax | ₹20,251.23 | ₹20,332.25 | ₹17,534.47 | ₹15,473.81 |
| EPS - Basic | ₹24.16 | ₹21.46 | ₹17.44 | ₹17.20 |
| EPS - Diluted | ₹24.16 | ₹21.46 | ₹17.44 | ₹17.20 |
| Particulars | Mar 2025 | Mar 2024 | Mar 2023 | Mar 2022 |
|---|---|---|---|---|
| Profit before tax | ₹32,991.00 | ₹28,355.84 | ₹23,824.79 | ₹22,311.38 |
| Income before WC changes | ₹56,771.78 | ₹53,448.20 | ₹50,772.18 | ₹41,947.18 |
| Change in Assets | -₹4,226.55 | -₹8,786.19 | -₹3,006.03 | -₹1,783.31 |
| Change in Liabilities | ₹2,204.94 | -₹919.96 | ₹3,461.28 | ₹3,697.41 |
| Change in WC | -₹2,021.61 | -₹9,706.15 | ₹455.25 | ₹1,914.10 |
| Cash flow from Operations | ₹50,435.95 | ₹40,099.19 | ₹47,151.78 | ₹41,788.23 |
| Cash flow from Investing | -₹45,799.73 | -₹31,455.97 | -₹26,145.13 | -₹22,890.92 |
| Cash flow from Financing | -₹4,073.00 | -₹8,245.53 | -₹21,216.77 | -₹19,171.56 |
| Total Cash Flow | ₹563.22 | ₹397.69 | -₹210.12 | -₹274.25 |
| Cash (Start of the year) | ₹863.34 | ₹465.65 | ₹675.77 | ₹950.02 |
| Cash (End of the year) | ₹1,426.56 | ₹863.34 | ₹465.65 | ₹675.77 |
| Particulars | Mar 2025 | Mar 2024 | Mar 2023 | Mar 2022 |
|---|---|---|---|---|
| Non-Current Assets | ₹431,272.95 | ₹397,161.04 | ₹378,127.31 | ₹358,343.70 |
| Current Assets | ₹92,891.64 | ₹83,035.53 | ₹69,785.94 | ₹58,252.71 |
| Total Assets | ₹524,164.59 | ₹480,196.57 | ₹447,913.25 | ₹416,596.41 |
| Current Liabilities | ₹101,073.16 | ₹98,404.34 | ₹85,820.13 | ₹76,671.79 |
| Net Current Asset | -₹8,181.52 | -₹15,368.81 | -₹16,034.19 | -₹18,419.08 |
| Non-Current Liabilities | ₹231,968.75 | ₹216,669.95 | ₹211,139.50 | ₹200,790.47 |
| Equity Capital | ₹191,122.68 | ₹165,122.28 | ₹150,953.62 | ₹139,134.15 |
| Total Equity & Liabilities | ₹524,164.59 | ₹480,196.57 | ₹447,913.25 | ₹416,596.41 |
| Particulars | Mar 2025 | Mar 2024 | Mar 2023 | Mar 2022 |
|---|---|---|---|---|
| Revenue | ₹170,037.37 | ₹162,008.95 | ₹163,769.77 | ₹121,174.55 |
| Other Income | ₹4,376.12 | ₹3,698.32 | ₹3,954.64 | ₹3,575.11 |
| Total Revenue | ₹174,413.49 | ₹165,707.27 | ₹167,724.41 | ₹124,749.66 |
| Total Expenses | ₹150,777.09 | ₹142,996.65 | ₹143,657.32 | ₹105,424.33 |
| Profit Before Tax | ₹23,636.40 | ₹23,545.17 | ₹24,067.09 | ₹19,325.33 |
| Tax | ₹7,299.69 | ₹6,600.03 | ₹6,279.27 | ₹4,457.77 |
| Profit After Tax | ₹16,336.71 | ₹16,945.14 | ₹17,787.82 | ₹14,867.56 |
| EPS - Basic | ₹20.26 | ₹18.64 | ₹17.73 | ₹16.79 |
| EPS - Diluted | ₹20.26 | ₹18.64 | ₹17.73 | ₹16.79 |
| Particulars | Mar 2025 | Mar 2024 | Mar 2023 | Mar 2022 |
|---|---|---|---|---|
| Profit before tax | ₹27,650.43 | ₹24,919.55 | ₹23,350.86 | ₹21,024.45 |
| Income before WC changes | ₹47,985.81 | ₹45,687.65 | ₹45,681.93 | ₹37,533.80 |
| Change in Assets | -₹2,869.26 | -₹6,694.16 | -₹3,469.38 | ₹265.91 |
| Change in Liabilities | ₹109.56 | -₹961.00 | ₹3,875.07 | ₹1,797.33 |
| Change in WC | -₹2,759.70 | -₹7,655.16 | ₹405.69 | ₹2,063.24 |
| Cash flow from Operations | ₹41,318.27 | ₹34,756.47 | ₹42,351.34 | ₹37,898.21 |
| Cash flow from Investing | -₹20,545.69 | -₹15,043.72 | -₹14,100.69 | -₹18,080.05 |
| Cash flow from Financing | -₹20,967.59 | -₹19,518.72 | -₹28,365.00 | -₹19,877.37 |
| Total Cash Flow | -₹195.01 | ₹194.03 | -₹114.35 | -₹59.21 |
| Cash (Start of the year) | ₹197.16 | ₹3.13 | ₹117.48 | ₹176.69 |
| Cash (End of the year) | ₹2.15 | ₹197.16 | ₹3.13 | ₹117.48 |
| Particulars | Mar 2025 | Mar 2024 | Mar 2023 | Mar 2022 |
|---|---|---|---|---|
| Non-Current Assets | ₹331,770.69 | ₹320,938.39 | ₹317,861.92 | ₹319,940.05 |
| Current Assets | ₹76,146.97 | ₹72,356.14 | ₹65,812.53 | ₹51,200.39 |
| Total Assets | ₹407,917.66 | ₹393,294.53 | ₹383,674.45 | ₹371,140.44 |
| Current Liabilities | ₹79,461.40 | ₹78,304.16 | ₹72,118.27 | ₹65,949.72 |
| Net Current Asset | -₹3,314.43 | -₹5,948.02 | -₹6,305.74 | -₹14,749.33 |
| Non-Current Liabilities | ₹166,815.71 | ₹165,105.35 | ₹172,666.30 | ₹176,523.20 |
| Equity Capital | ₹161,640.55 | ₹149,885.02 | ₹138,889.88 | ₹128,667.52 |
| Total Equity & Liabilities | ₹407,917.66 | ₹393,294.53 | ₹383,674.45 | ₹371,140.44 |
Incorporated in: 1975 Managing Director: Gurdeep Singh Parent: Government of India
NTPC Limited is India’s largest power generation company, which plays a crucial role in the country’s energy infrastructure. As a Maharatna PSU, NTPC has a power-generating capacity of 71,594 MW. It contributes over 25% of the nation’s total power generation.
NTPC is fulfilling India’s growing electricity demand through its diversified portfolio of thermal power, hydroelectric, wind and solar power.
The company has a strong focus on operational efficiency, sustainability and clean energy transition. NTPC supports power supply across states while steadily expanding its renewable energy footprint.
NTPC Limited’s journey began in 1975, when it was set up by the Government of India, with a mission to accelerate power development and bring energy security.
NTPC started with coal-based projects and slowly built world-class infrastructure for large-scale power generation. Over the decades, the company expanded its business segments into hydroelectric power, gas, nuclear and renewables.
In 2010, NTPC earned the Maharatna status reflecting its scale and strategic importance. Today, NTPC is not just a power producer but a key driver of India’s clean energy ambitions.
NTPC's revenue model is diversified with various business segments.
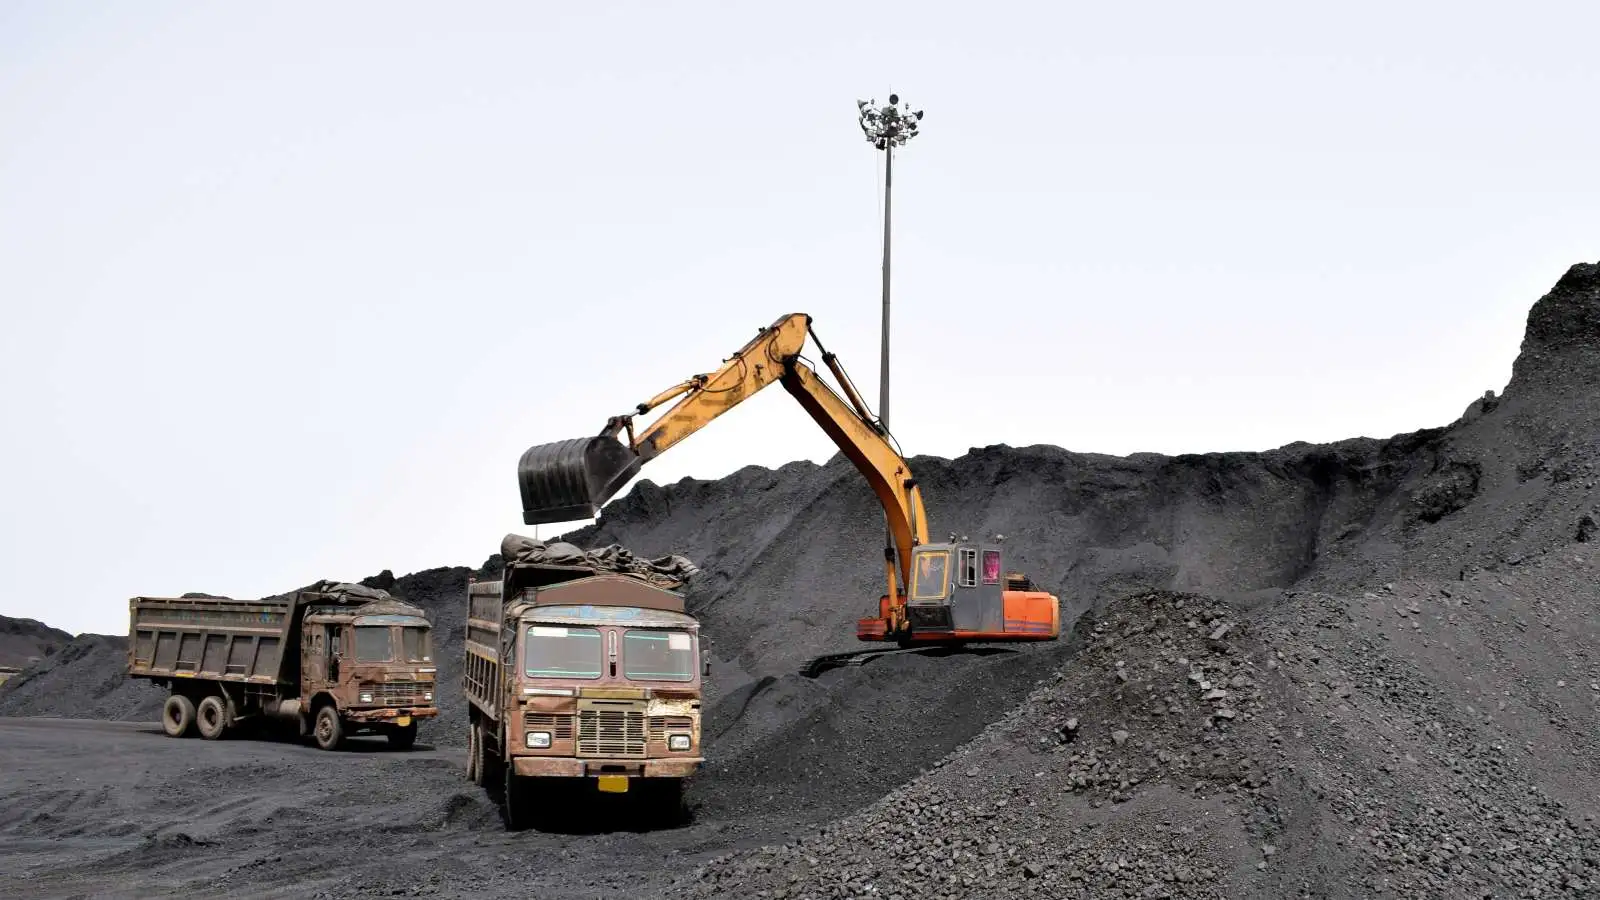
Thermal Power Generation: The company’s backbone is still coal-based power generation, supplying reliable and affordable electricity to multiple states across India.
Renewable Energy: NTPC is now rapidly scaling its solar and wind power projects, aligning its growth with India’s clean energy and net-zero goals.

Hydro Power: With the help of large and small hydro projects, NTPC adds stability to its power generation capacity and supports during the peak demand periods.

Gas Power: NTPC also operates gas power plants that help to balance a sudden rise in energy demand during peak season.
Power Trading and Distribution: NTPC do power trading and provides advisory services, helping states to manage the electricity demand efficiently.
NTPC is focusing on increasing non-fossil power generation capacity as it aims to diversify its fuel mix and lower its carbon footprint.
The company kept a target of generating 60 GW of energy through renewable sources by 2030. Also, NTPC is implementing waste-saving strategies, reducing consumption, and promoting reuse.
NTPC is actively planting 40 million+ trees, restoring degraded land, and promoting ecological balance.
NTPC had successfully installed cutting-edge emission systems, reducing pollutants and improving the air quality.
NTPC is working for a sustainable future by converting waste into energy, reducing landfill waste and promoting sustainable waste management.
Revenue: NTPC reported a consolidated revenue of ₹1,90,862.45 crore in FY25 vs ₹1,81,165.86 crore in FY24. It showed an increase of 5.35% on a yearly basis, reflecting decent growth.
Operating Profit: The company reported an operating profit of ₹28,496.41 crore in FY25 vs ₹27,141.45 crore in FY24. It showed an increase of 4.99% on a year-on-year basis, indicating that the company's operating profit is growing well.
Net Profit: NTPC reported a net profit of ₹23,953.15 crore in FY25 compared to ₹21,332.45 crore in FY24. It showed an increase of 12.28% on a yearly basis, indicating an improvement in overall performance.
NTPC share price is ₹356.65 as on 06 Jul, 2026, 11:00 IST.
In the last 1 year, NTPC delivered a return of 6.53%. The NTPC share price hit a high of ₹414.40 and low of ₹315.55.
The Mutual Fund Shareholding in NTPC was 17.83% at the end of Mar 2026.
The 52-week high and low of NTPC share is ₹414.40 and ₹315.55 as of 06 Jul, 2026.
The market capitalisation of NTPC is ₹3,47,480.00 Crores as on 06 Jul, 2026.
The stock symbol of NTPC is NTPC on the NSE, 532555 on the BSE, and the ISIN is INE733E01010.
NTPC shares closed yesterday at ₹356.45 on NSE & ₹356.30 on BSE
To buy NTPC shares, open a demat account with Upstox and complete the KYC process. Once your account is set up, search for the stock and place your order.
No, shares of NTPC or any other publicly traded company cannot be bought or sold on holidays when the stock exchanges are closed. You can only buy or sell NTPC shares on days when the stock exchanges are open for trading. It's important to check the NSE & BSE holidays calendar, before placing any trades to avoid any inconvenience.
The PE and PB ratio of NTPC is 12.61 and 1.71 respectively, as on 06 Jul, 2026, 11:00 IST.