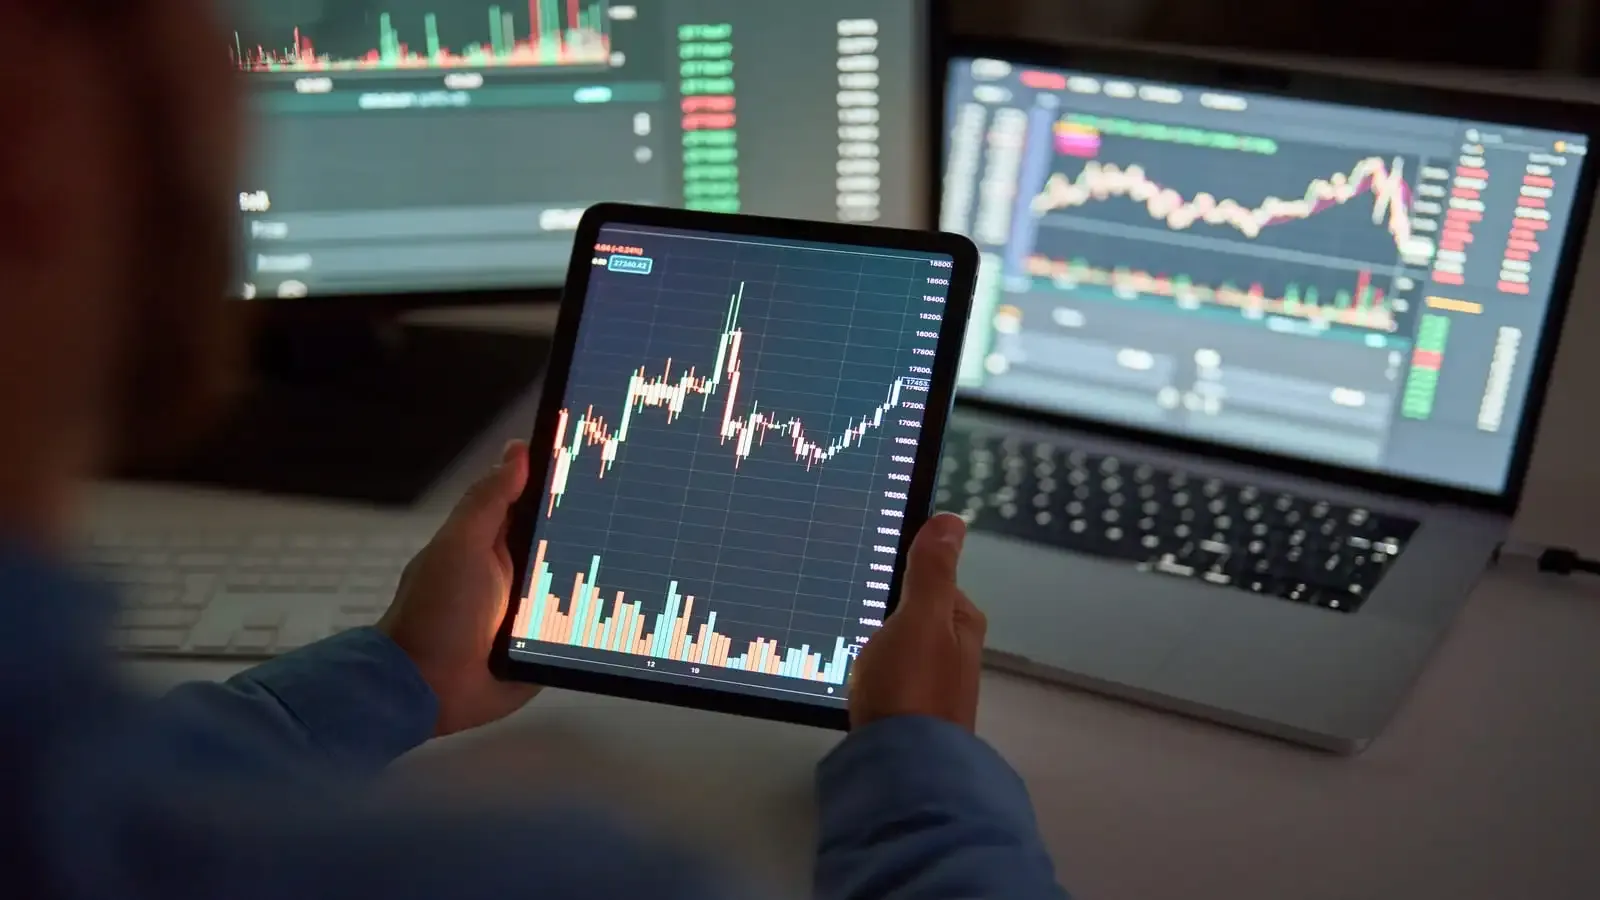
As of 22 Jul 2026, Century Enka share price is ₹540.20. The stock opened at ₹547.75, compared to its previous close of ₹549.40. During today's trading session, Century Enka share price moved in the range of ₹540.20 to ₹553.95, with an average price of ₹547.08 for the day. Looking at its last 52-week, the stock has touched a low of ₹371.20 and a high of ₹622.00. On the performance front, Century Enka share price has increased by 24.88% over the last six months and is up 4.00% on a year-on-year basis.
| Name | Mkt Cap Cr | P/E | P/B | ROE | D/E | ROCE | Book Value | Div. Yield | Turnover | EPS(TTM) |
|---|---|---|---|---|---|---|---|---|---|---|
| Grasim Industries | 2,16,170.00 | 20.77 | 2.07 | 4.80% | 0.23 | 6.76% | 812.27 | 0.32% | 0.60 | 5.13 |
| Vardhman Textiles | 18,242.80 | 24.02 | 1.72 | 7.09% | 0.18 | 8.46% | 351.94 | 0.79% | 0.82 | 25.58 |
| Welspun India | 15,667.80 | 73.58 | 3.19 | 4.16% | 0.29 | 5.87% | 42.51 | 0.06% | 1.41 | 2.56 |
| Arvind | 13,906.60 | 32.58 | 3.44 | 10.24% | 0.44 | 12.86% | 117.16 | 0.85% | 1.96 | 11.36 |
| Trident | 12,887.70 | 30.46 | 2.81 | 9.41% | 0.38 | 11.05% | 7.98 | 1.99% | 0.89 | 0.74 |
| Swan Energy | 9,717.16 | 36.06 | 1.30 | 3.64% | 0.08 | 4.48% | 146.56 | 0.05% | 0.05 | 0.88 |
| Indo Count Industries | 7,849.88 | 61.35 | 3.30 | 5.38% | 0.36 | 8.01% | 116.96 | 0.38% | 1.20 | 7.30 |
| Garware Tech Fibres | 7,691.12 | 38.90 | 5.70 | 14.67% | 0.02 | 20.05% | 133.71 | 0.13% | 1.02 | 21.28 |
| Alok Industries | 6,107.25 | -8.55 | -0.26 | 3.46% | -1.24 | -2.85% | -39.63 | 0.00% | 0.57 | -1.57 |
| KUSUMGAR LIMITED | 0.00 | 67.71 | 10.08 | 25.88% | 0.57 | 23.74% | 56.33 | 0.00% | 1.06 | 9.68 |
| Particulars | Mar 2025 | Mar 2024 | Mar 2023 |
|---|---|---|---|
| Revenue | ₹2,001.69 | ₹1,744.15 | ₹2,072.05 |
| Other Income | ₹37.32 | ₹33.49 | ₹19.04 |
| Total Revenue | ₹2,039.01 | ₹1,777.64 | ₹2,091.09 |
| Total Expenses | ₹1,946.44 | ₹1,716.97 | ₹1,973.29 |
| Profit Before Tax | ₹91.94 | ₹57.53 | ₹117.68 |
| Tax | ₹25.47 | ₹14.78 | ₹27.36 |
| Profit After Tax | ₹66.47 | ₹42.75 | ₹90.32 |
| EPS - Basic | ₹30.42 | ₹19.56 | ₹41.34 |
| EPS - Diluted | ₹30.42 | ₹19.56 | ₹41.34 |
| Particulars | Mar 2025 | Mar 2024 | Mar 2023 |
|---|---|---|---|
| Profit before tax | ₹91.94 | ₹57.53 | ₹117.68 |
| Income before WC changes | ₹123.16 | ₹84.24 | ₹144.63 |
| Change in Assets | -₹35.83 | -₹15.47 | ₹113.47 |
| Change in Liabilities | ₹49.83 | ₹26.52 | -₹8.29 |
| Change in WC | ₹14.00 | ₹11.05 | ₹105.18 |
| Cash flow from Operations | ₹117.87 | ₹88.06 | ₹219.27 |
| Cash flow from Investing | -₹75.84 | -₹46.98 | -₹251.34 |
| Cash flow from Financing | -₹41.95 | -₹42.91 | ₹29.18 |
| Total Cash Flow | ₹0.08 | -₹1.83 | -₹2.89 |
| Cash (Start of the year) | ₹0.87 | ₹2.70 | ₹5.59 |
| Cash (End of the year) | ₹0.95 | ₹0.87 | ₹2.70 |
| Particulars | Mar 2025 | Mar 2024 | Mar 2023 |
|---|---|---|---|
| Non-Current Assets | ₹884.82 | ₹889.66 | ₹802.19 |
| Current Assets | ₹896.92 | ₹794.59 | ₹820.42 |
| Total Assets | ₹1,781.74 | ₹1,684.25 | ₹1,622.61 |
| Current Liabilities | ₹220.84 | ₹174.02 | ₹151.08 |
| Net Current Asset | ₹676.08 | ₹620.57 | ₹669.34 |
| Non-Current Liabilities | ₹143.35 | ₹145.85 | ₹149.82 |
| Equity Capital | ₹1,417.55 | ₹1,364.38 | ₹1,321.71 |
| Total Equity & Liabilities | ₹1,781.74 | ₹1,684.25 | ₹1,622.61 |
| Particulars | Mar 2025 | Mar 2024 | Mar 2023 | Mar 2022 |
|---|---|---|---|---|
| Revenue | ₹2,001.69 | ₹1,744.15 | ₹2,072.05 | ₹2,097.83 |
| Other Income | ₹37.32 | ₹33.49 | ₹19.04 | ₹20.63 |
| Total Revenue | ₹2,039.01 | ₹1,777.64 | ₹2,091.09 | ₹2,118.46 |
| Total Expenses | ₹1,946.44 | ₹1,716.97 | ₹1,973.29 | ₹1,874.40 |
| Profit Before Tax | ₹92.57 | ₹60.67 | ₹117.80 | ₹244.06 |
| Tax | ₹25.47 | ₹14.78 | ₹27.36 | ₹59.90 |
| Profit After Tax | ₹67.10 | ₹45.89 | ₹90.44 | ₹184.16 |
| EPS - Basic | ₹30.71 | ₹21.00 | ₹41.39 | ₹84.28 |
| EPS - Diluted | ₹30.71 | ₹21.00 | ₹41.39 | ₹84.28 |
| Particulars | Mar 2025 | Mar 2024 | Mar 2023 | Mar 2022 |
|---|---|---|---|---|
| Profit before tax | ₹92.57 | ₹60.67 | ₹117.80 | ₹244.06 |
| Income before WC changes | ₹123.16 | ₹84.24 | ₹144.63 | ₹268.47 |
| Change in Assets | -₹35.83 | -₹15.47 | ₹113.47 | -₹151.62 |
| Change in Liabilities | ₹49.83 | ₹26.52 | -₹8.29 | -₹1.48 |
| Change in WC | ₹14.00 | ₹11.05 | ₹105.18 | -₹153.10 |
| Cash flow from Operations | ₹117.87 | ₹88.06 | ₹219.27 | ₹55.56 |
| Cash flow from Investing | -₹75.84 | -₹46.98 | -₹251.34 | -₹41.28 |
| Cash flow from Financing | -₹41.95 | -₹42.91 | ₹29.18 | -₹16.95 |
| Total Cash Flow | ₹0.08 | -₹1.83 | -₹2.89 | -₹2.67 |
| Cash (Start of the year) | ₹0.87 | ₹2.70 | ₹5.59 | ₹8.26 |
| Cash (End of the year) | ₹0.95 | ₹0.87 | ₹2.70 | ₹5.59 |
| Particulars | Mar 2025 | Mar 2024 | Mar 2023 | Mar 2022 |
|---|---|---|---|---|
| Non-Current Assets | ₹888.71 | ₹892.92 | ₹802.31 | ₹596.85 |
| Current Assets | ₹896.92 | ₹794.59 | ₹820.42 | ₹925.74 |
| Total Assets | ₹1,785.63 | ₹1,687.51 | ₹1,622.73 | ₹1,522.59 |
| Current Liabilities | ₹220.84 | ₹174.02 | ₹151.08 | ₹172.04 |
| Net Current Asset | ₹676.08 | ₹620.57 | ₹669.34 | ₹753.70 |
| Non-Current Liabilities | ₹143.35 | ₹145.85 | ₹149.82 | ₹99.87 |
| Equity Capital | ₹1,421.44 | ₹1,367.64 | ₹1,321.83 | ₹1,250.68 |
| Total Equity & Liabilities | ₹1,785.63 | ₹1,687.51 | ₹1,622.73 | ₹1,522.59 |
Century Enka Limited is engaged in the manufacturing and selling of synthetic yarn and related products. The Company manufactures Nylon Tyre Cord Fabric (NTCF) and Nylon Filament Yarn (NFY). Its NFY products include Partially Oriented Yarn (POY), Drawn Yarn FDY, Draw Wound Yarn, One-Step Yarn Hoy/Ces (Century Enka Special), Draw Textured Yarn, Air Textured Yarn, Tow, Colored Yarn, and Draw Beams. Its NTCF products include High Tenacity Industrial Yarn, Greige Fabric, and Dipped Fabric. NFY offers nylon filament yarn, a long continuous lustrous fiber, which is used to produce a range of textile fabrics, such as sarees, draperies, furnishings and upholstery, sportswear, mosquito nets and also for embroidery. NTCF provides quality nylon tire cord fabrics for reinforcement of tires, which are used in motorcycles, scooters, light commercial vehicles (LMVs), heavy commercial vehicles (HCVs) and off-the-road (OTR). The Company’s manufacturing sites are located at Pune and Gujarat.
Century Enka share price is ₹540.20 as on 21 Jul, 2026, 15:29 IST.
In the last 1 year, Century Enka delivered a return of 4.00%. The Century Enka share price hit a high of ₹622.00 and low of ₹371.20.
The Mutual Fund Shareholding in Century Enka was 9.85% at the end of Jun 2026.
The 52-week high and low of Century Enka share is ₹622.00 and ₹371.20 as of 21 Jul, 2026.
The market capitalisation of Century Enka is ₹1,188.64 Crores as on 21 Jul, 2026.
The stock symbol of Century Enka is CENTENKA on the NSE, 500280 on the BSE, and the ISIN is INE485A01015.
Century Enka shares closed yesterday at ₹549.40 on NSE & ₹549.00 on BSE
To buy Century Enka shares, open a demat account with Upstox and complete the KYC process. Once your account is set up, search for the stock and place your order.
No, shares of Century Enka or any other publicly traded company cannot be bought or sold on holidays when the stock exchanges are closed. You can only buy or sell Century Enka shares on days when the stock exchanges are open for trading. It's important to check the NSE & BSE holidays calendar, before placing any trades to avoid any inconvenience.
The PE and PB ratio of Century Enka is 11.9 and 0.8 respectively, as on 21 Jul, 2026, 15:29 IST.