Logo

HAL Share Price

NSE: HAL
|
Airlines
₹ 4,428.90
-₹5.10 (-0.12%)
1D
Last updated 03 Jul, 2026, 15:56 IST

HAL Share Price Today

As of 6 Jul 2026, HAL share price is ₹4,428.90. The stock opened at ₹4,456.20, compared to its previous close of ₹4,434.00. During today's trading session, HAL share price moved in the range of ₹4,421.30 to ₹4,502.40, with an average price of ₹4,461.85 for the day. Looking at its last 52-week, the stock has touched a low of ₹3,479.10 and a high of ₹5,065.00. On the performance front, HAL share price has increased by 0.25% over the last six months and is down 10.19% on a year-on-year basis.


₹4,421.30
0.12% down today
₹4,502.40
1D LOW
1D HIGH

HAL Returns Calculator

Open
₹4,456.20
High
₹4,502.40
Low
₹4,421.30
Prev. close
₹4,434.00

Circuit
L
H
₹3,986.10
₹4,871.70
52-week
L
H
₹3,479.10
₹5,065.00

HAL Shareholder Returns

HAL Share Price History

Mkt Cap Cr
2,96,515.00

P/E
32.53

P/B
7.22

ROE
22.21%

D/E
0.00

ROCE
14.09%

Div. Yield
0.79%

EPS(TTM)
135.71
Turnover
0.38

EV/EBITDA
18.53

Net Margin
0.00%

Op. Margin
0.00%

ROA
6.88%

Quick Ratio
0.00

Curr. Ratio
2.61
Based on fundamentals, this stock's
Step 5 of 5
Performance
Excellent
Hind.Aeronautics outperforming all market indices
Step 1 of 5
Valuation
Overvalued
Hind.Aeronautics appears overvalued compared to its peers
Step 5 of 5
Earnings
Excellent
Hind.Aeronautics revenue, operating profit and net profit are growing
Peer Comparison
Peer comparison — key ratios
NameMkt Cap CrP/EP/BROED/EROCEBook ValueDiv. YieldTurnoverEPS(TTM)
BEL3,03,502.0050.0812.6525.27%0.0033.35%32.420.60%1.108.27
Solar Industries (India)1,68,695.0097.1426.8726.72%0.0429.10%467.100.06%1.21135.01
MAZAGON DOCK SHIPBUIL LTD1,03,029.0039.9610.5626.48%0.0032.01%219.230.71%1.2460.38
Bharat Dynamics50,746.90120.7011.979.91%0.007.22%115.700.35%0.3111.47
Cochin Shipyard39,967.2055.776.8112.20%0.2714.45%223.990.10%0.6624.44
Garden Reach Ship & Eng31,749.2042.4512.0928.48%0.0138.21%229.250.71%2.5265.29
ITI28,885.1098.6515.16-8.20%0.411.44%19.230.00%1.073.04
Data Patterns India26,056.3096.0215.0115.63%0.0021.41%310.080.21%0.5248.47
MTAR Technologies22,768.10242.1327.6811.43%0.4612.93%268.430.00%0.8530.99
Astra Microwave17,049.3088.3712.9714.68%0.2218.89%135.950.13%0.8018.73

HAL Financials

Full statement

Income Statement · Consolidated

Income Statement · Consolidated — all values in INR Crore
ParticularsMar 2025Mar 2024Mar 2023Mar 2022
Revenue₹30,980.95₹30,381.08₹26,927.46₹24,620.02
Other Income₹2,561.69₹1,896.60₹1,670.12₹984.93
Total Revenue₹33,542.64₹32,277.68₹28,597.58₹25,604.95
Total Expenses₹22,721.92₹22,079.30₹22,090.95₹20,380.19
Profit Before Tax₹10,867.26₹10,224.88₹6,509.50₹5,224.53
Tax₹2,503.21₹2,603.93₹681.77₹144.65
Profit After Tax₹8,364.05₹7,620.95₹5,827.73₹5,079.88
EPS - Basic₹125.07₹113.95₹87.14₹151.92
EPS - Diluted₹125.07₹113.95₹87.14₹151.92

Cash Flow · Consolidated

Cash Flow · Consolidated — all values in INR Crore
ParticularsMar 2025Mar 2024Mar 2023Mar 2022
Profit before tax₹8,364.05₹7,620.95₹5,827.73₹5,079.88
Income before WC changes₹12,425.98₹13,317.28₹11,133.88₹9,611.18
Change in Assets-₹15,332.32-₹5,906.86-₹1,457.18₹1,025.60
Change in Liabilities₹20,087.95₹2,781.73₹1,908.72₹563.80
Change in WC₹4,755.63-₹3,125.13₹451.54₹1,589.40
Cash flow from Operations₹13,643.46₹8,222.82₹8,829.72₹10,173.13
Cash flow from Investing-₹10,771.09-₹6,410.05-₹5,728.02-₹12,785.23
Cash flow from Financing-₹2,578.51-₹1,998.85-₹1,731.30-₹1,463.68
Total Cash Flow₹293.86-₹186.08₹1,370.40-₹4,075.78
Cash (Start of the year)₹4,254.69₹4,440.77₹3,070.37₹7,146.15
Cash (End of the year)₹4,548.55₹4,254.69₹4,440.77₹3,070.37

Balance Sheet · Consolidated

Balance Sheet · Consolidated — all values in INR Crore
ParticularsMar 2025Mar 2024Mar 2023Mar 2022
Non-Current Assets₹16,172.25₹15,077.69₹15,326.87₹13,407.07
Current Assets₹90,094.60₹63,017.49₹51,876.93₹44,984.91
Total Assets₹106,266.85₹78,095.18₹67,203.80₹58,391.98
Current Liabilities₹44,095.25₹36,324.33₹30,827.27₹25,022.54
Net Current Asset₹45,999.35₹26,693.16₹21,049.66₹19,962.37
Non-Current Liabilities₹27,186.43₹12,629.04₹12,800.64₹14,052.56
Equity Capital₹34,985.17₹29,141.81₹23,575.89₹19,316.88
Total Equity & Liabilities₹106,266.85₹78,095.18₹67,203.80₹58,391.98

Income Statement · Standalone

Income Statement · Standalone — all values in INR Crore
ParticularsMar 2025Mar 2024Mar 2023Mar 2022
Revenue₹30,980.92₹30,380.84₹26,927.85₹24,620.21
Other Income₹2,565.53₹1,898.54₹1,671.80₹986.34
Total Revenue₹33,546.45₹32,279.38₹28,599.65₹25,606.55
Total Expenses₹22,732.33₹22,080.41₹22,106.71₹20,375.40
Profit Before Tax₹10,820.01₹10,198.97₹6,492.94₹5,231.15
Tax₹2,503.21₹2,603.93₹681.77₹144.65
Profit After Tax₹8,316.80₹7,595.04₹5,811.17₹5,086.50
EPS - Basic₹124.36₹113.57₹173.79₹152.11
EPS - Diluted₹124.36₹113.57₹173.79₹152.11

Cash Flow · Standalone

Cash Flow · Standalone — all values in INR Crore
ParticularsMar 2025Mar 2024Mar 2023Mar 2022
Profit before tax₹8,316.80₹7,595.04₹5,811.17₹5,086.50
Income before WC changes₹12,416.73₹13,317.08₹11,135.62₹9,834.32
Change in Assets-₹15,326.03-₹5,904.62-₹1,454.39₹759.66
Change in Liabilities₹20,092.57₹2,782.61₹1,909.97₹499.28
Change in WC₹4,766.54-₹3,122.01₹455.58₹1,258.94
Cash flow from Operations₹13,645.12₹8,225.74₹8,835.50₹10,040.08
Cash flow from Investing-₹10,773.84-₹6,411.73-₹5,734.34-₹12,763.37
Cash flow from Financing-₹2,578.51-₹1,998.85-₹1,731.30-₹1,349.05
Total Cash Flow₹292.77-₹184.84₹1,369.86-₹4,072.34
Cash (Start of the year)₹4,254.16₹4,439.00₹3,069.14₹7,141.48
Cash (End of the year)₹4,546.93₹4,254.16₹4,439.00₹3,069.14

Balance Sheet · Standalone

Balance Sheet · Standalone — all values in INR Crore
ParticularsMar 2025Mar 2024Mar 2023Mar 2022
Non-Current Assets₹16,030.80₹14,967.96₹15,239.18₹13,321.98
Current Assets₹90,082.32₹63,015.75₹51,878.20₹44,999.01
Total Assets₹106,113.12₹77,983.71₹67,117.38₹58,320.99
Current Liabilities₹44,096.02₹36,323.23₹30,825.42₹25,019.85
Net Current Asset₹45,986.30₹26,692.52₹21,052.78₹19,979.16
Non-Current Liabilities₹27,174.25₹12,614.06₹12,785.79₹14,037.14
Equity Capital₹34,842.85₹29,046.42₹23,506.17₹19,264.00
Total Equity & Liabilities₹106,113.12₹77,983.71₹67,117.38₹58,320.99
* All values are in INR Crore
Qty
Bid
3
4428.9
0
0
0
0
0
0
0
0
Ask
Qty
0
0
0
0
0
0
0
0
0
0
Bid Total: 3
Ask Total: 0
Buy orders: 100%
Sell orders: 0%
Bearish
1
Neutral
6
Bullish
1
Neutral
by SEBI experts
Expert Pick
EXPPICK
Stop-loss
Entry price
Target
Indicator
Value
Verdict

RSI (14)
55.13
Neutral

ATR (14)
107.38
Neutral

STOCH(9,6)
59.98
Neutral

STOCH RSI (14)
55.01
Neutral

ADX(9)
20.39
Bearish

UO(9)
47.52
Neutral

ROC(12)
4.07
Bullish

WillR(14)
-31.92
Neutral
Period
Simple value
Exponential vaue

5D
4404.26
4416.98

10D
4418.24
4401.14

20D
4344.87
4378.2

50D
4397
4335.85

100D
4198.02
4318.59

About HAL

HAL logo
ISIN
INE066F01020
Sector Market Cap
₹ 2,96,515 Cr

Hindustan Aeronautics Limited (HAL) is a state-owned aerospace and defence company based in Bengaluru. It is a public sector undertaking operating under the Ministry of Defence.

Hindustan Aircraft Limited was founded by Walchand Hirachand in December 1940. The government acquired a one-third stake in HAL in 1941. The HT-2 Trainer aircraft, manufactured by HAL, took its first flight in August 1951. The government established Aeronautics India Limited (AIL) in August 1963 to start the production of MiG-21 aircraft. In October 1964, Hindustan Aircraft Limited merged with Aeronautics India Limited, leading to the formation of HAL as it is known today.

HAL was listed on BSE and National Stock Exchange (NSE) on March 28, 2018. The market capitalisation of Hindustan Aeronautics Limited stood at over ₹1.8 lakh crore as of December 21, 2023. HAL share price has gained 238% in the last three years.

Business operations

The leading defence sector PSU primarily focuses on aerospace services, specialising in the manufacturing and development of aircraft, helicopters, jet engines and components. It operates across multiple locations in India including Bengaluru, Kanpur, Nasik, Koraput, Korwa, Lucknow, Kasaragod and Hyderabad.

HAL's customers include the biggest names in the defence, aerospace and civil aviation sectors. Some of them are the Indian Air Force (IAF), Indian Army, Indian Navy, Indian Coast Guard, Indian Space Research Organisation (ISRO), Defence Research & Development Organisation (DRDO), Border Security Force, Oil & Natural Gas Cooperation (ONGC) and Bharat Heavy Electricals Ltd (BHEL).

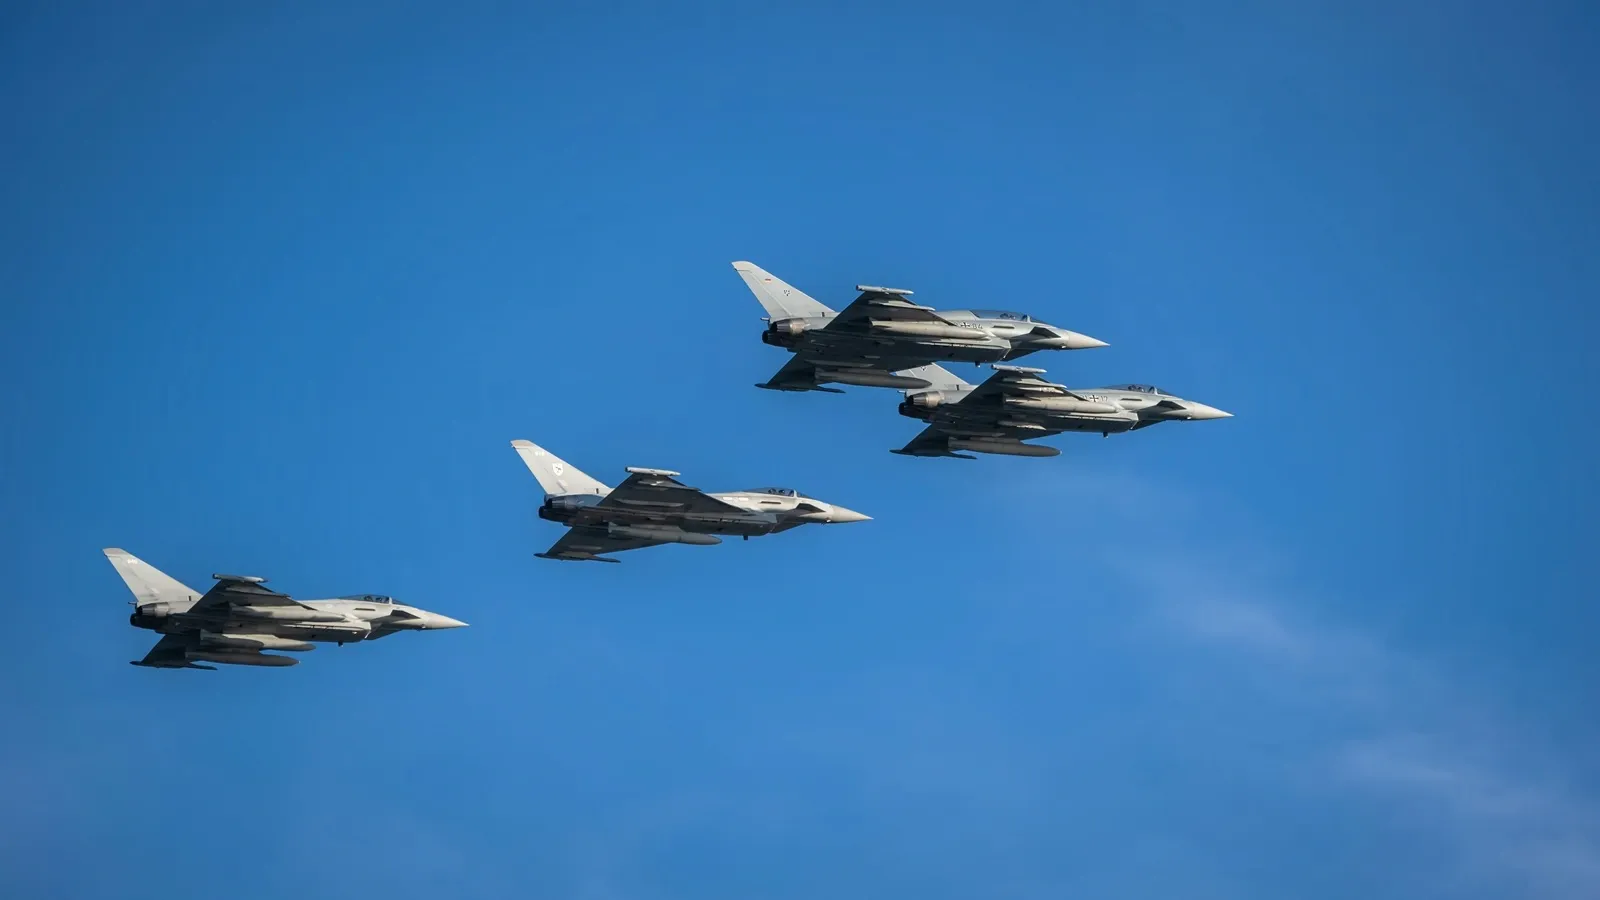
HAL has manufactured many products across different categories. Some of the fighter jets built by HAL include the Tejas light combat aircraft, SU-30 MKI, MiG-21 and MiG-27. HAL has also developed Dhruv, Rudra, Cheetah, Chetak, Lancer, Cheetal, LCH and LUH helicopters for IAF and Indian Army.

In FY23, HAL manufactured 22 new aircraft and helicopters which included models such as LCA Tejas, Dornier Do-228, ALH Dhruv, Light Combat Helicopter (LCH) and Light Utility Helicopter (LUH). It also produced 51 new engines and accessories across its different divisions. The company conducted overhauls on 216 aircraft/helicopters and 536 engines within the same period.

The President of India inaugurated HAL's Integrated Cryogenic Engine Manufacturing Facility (ICMF) in Bengaluru on September 27, 2022. ICMF is a central hub for the complete manufacturing of rocket engines for ISRO under one roof. It also signifies a significant step in the Atmanirbhar Bharat Abhiyan and in the production of high-thrust Rocket engines.

Hindustan Aeronautics Limited also has a learning & development centre called the HAL Management Academy (HMA). Established in 1969, HMA has played a significant role in advancing aerospace technology and management. In 2020, it got approval from the All India Council for Technical Education (AICTE) to conduct full-time 24-month post postgraduate diplomas in Aviation Management and Production Management.

HAL Financial Highlights

  • Revenue: HAL reported revenue of ₹36,787.95 crore in FY26 vs ₹33,542.64 crore in FY25. It showed an increase of 9.68% on a yearly basis.
  • Operating Profit: HAL reported an operating profit of ₹12,151.93 crore in FY26 vs ₹10,867.26 crore in FY25. It showed an increase of 11.82% on a year-on-year basis.
  • Net Profit: HAL reported a net profit of ₹9,115.52 crore in FY26 vs ₹8,364.05 crore in FY25. It showed an increase of 8.98% on a yearly basis.

HAL Quarterly Result Highlights

  • HAL reported revenue of ₹15,092.97 crore in Mar 2026, compared with ₹8,612.60 crore in Dec 2025, representing an increase of 75.24% on a quarter-on-quarter (QoQ) basis.
  • HAL reported an operating profit of ₹5,583.83 crore in Mar 2026, compared with ₹2,486.81 crore in Dec 2025, representing an increase of 124.54% on a quarter-on-quarter (QoQ) basis.
  • HAL reported a profit of ₹4,196.04 crore in Mar 2026, compared with ₹1,866.66 crore in Dec 2025, reflecting an increase of 124.79% on a QoQ basis.
  • The earnings per share (EPS) of HAL stood at ₹125.07 during Mar 2026.
Know more
Promoters
71.64%
FII
10.20%
Other DII
4.69%
Retail and other
7.65%
Mutual funds
5.81%
Foreign institutions - FII
Compare against other stocks
HAL logo
HAL
Airlines
Add Stock
Add Another

FAQs on HAL Share Price