Established in: 1970
Managing director: Cmde A. Madhavarao
Bharat Dynamics Limited (BDL) is a famous name in the defence industry, a public sector undertaking working under the Ministry of Defence. It’s a defence manufacturer with a focus on manufacturing guided missile systems, underwater weapons, and allied defence equipment for the Indian Armed Forces.
The company also manufactures the heavyweight torpedo and the lightweight torpedo developed by the Naval Science & Technological Laboratory (NSTL), DRDO. The lightweight torpedo is also part of the company's export portfolio.
BDL has four manufacturing units, three situated in Telangana (Hyderabad, Bhanur and Ibrahimpatnam) and one in Andhra Pradesh (Visakhapatnam).
Bharat Dynamics has been expanding its operations by establishing a unit in Amravati, Maharashtra, to meet the escalating demands of the armed forces.
History of Bharat Dynamics Limited
Bharat Dynamics Limited was established in 1970 to strengthen India’s defence manufacturing industry. BDL was initially set up to produce guided missile systems but gradually expanded its operations through technology transfer and collaboration with DRDO.
Over the years, BDL developed expertise in producing missiles, torpedoes, and countermeasure systems for the Indian Army, Navy and Air Force.
Currently, Bharat Dynamics is among the select global companies equipped with cutting-edge facilities for producing and supplying guided missiles, underwater weapons, airborne products and allied defence gear.
The company also provides product life cycle support and handles the refurbishment or extension of life for vintage missiles.
Business Segment of Bharat Dynamics Limited
Bharat Dynamics Limited's business is divided into four major segments.
-
Missile Systems: In this segment, BDL manufactures a wide range of guided missile systems for the Indian Army, Navy and Air Force, fulfilling the defence needs.
-
Underwater Weapons: BDL is also involved in producing torpedoes and underwater mines, mainly fulfilling the needs of the Indian Navy.
-
Countermeasure and Defence Equipment: BDL develops and supplies countermeasure dispensing systems and allied defence equipment used for protection against enemy threats.
-
Life Cycle Support and Spares: The company also provides maintenance, repairs, upgrades and spare parts.
Products manufactured by Bharat Dynamics:
- Surface-to-air missiles
- Anti-tank guided missiles
- Underwater weapons
- Launchers
- Countermeasures dispensing system
- Test equipment
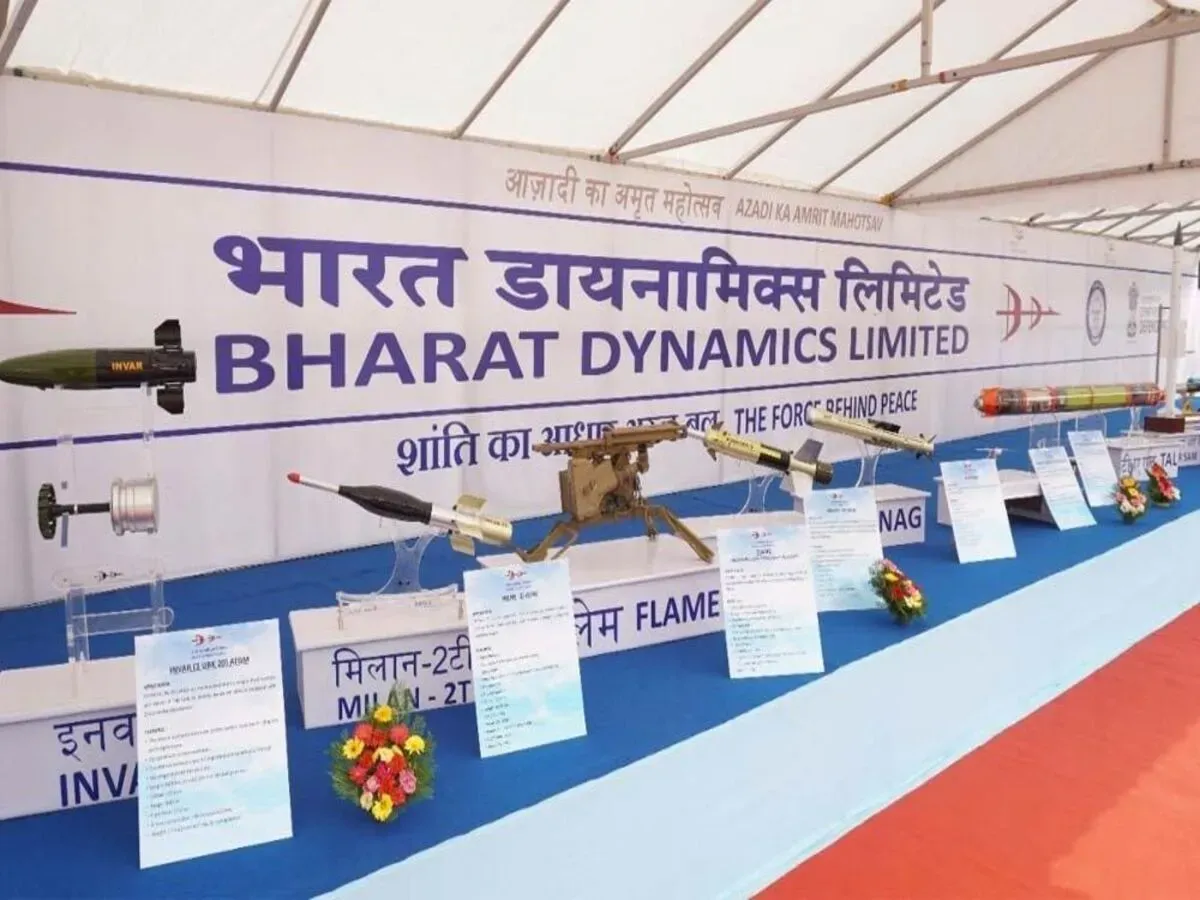
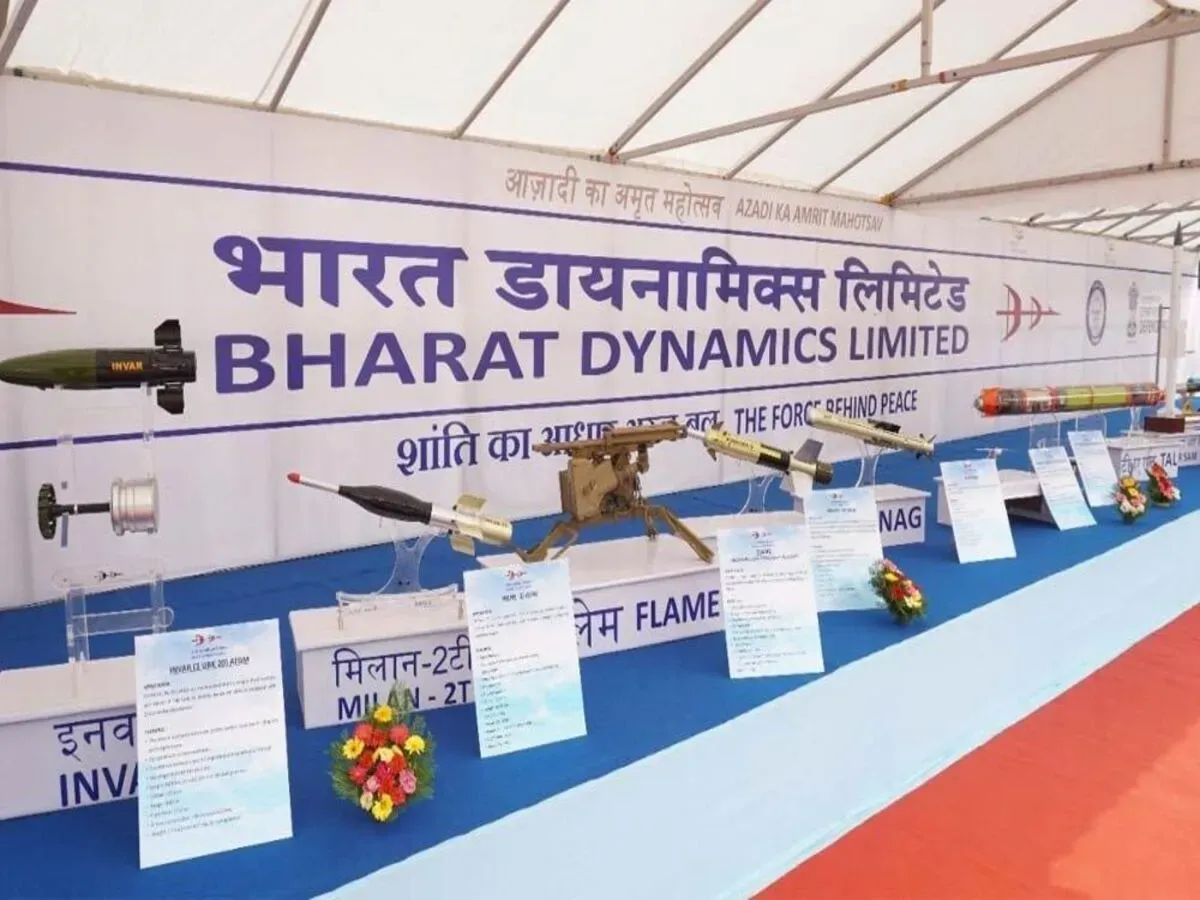
Bharat Dynamics is the only manufacturer in India of surface-to-air missiles, torpedoes and anti-tank guided missiles. The company is currently the exclusive supplier of surface-to-air missiles and anti-tank guided missiles to the Indian Armed Forces.
Its product portfolio also includes missiles like Akash Missile Systems, Milan 2T anti-tank guided missiles, lightweight torpedoes and C-303 anti-torpedo systems, among others.
The company's continuous efforts in R&D have led to the launch of new products like the Dishani and Garudastra underwater weapons and advancements in missile technology like ASTRA MK-1.
Revenue Model of Bharat Dynamics Limited
Bharat Dynamics earns revenue through long-term contracts and purchase orders from the government. A large portion of the revenue comes from the supply of missile systems and defence equipment to the Indian Armed Forces.
Apart from this, BDL earns steady revenue from servicing, life-cycle support and spare parts. BDL also exports its products to foreign nations, which also contributes a small share in overall revenue.
Bharat Dynamics Limited Financial Performance (FY25 vs FY24)
Revenue: Bharat Dynamics Limited reported consolidated revenue of ₹3,695.45 crore in FY25 vs ₹2,731.11 crore in FY24. It showed an increase of 35.30% on a yearly basis, reflecting decent growth.
Operating Profit: The company reported an operating profit of ₹748.76 crore in FY25 vs ₹828.24 crore in FY24. It showed a decline of -9.59% on a year-on-year basis, indicating that the company's operating profit remained under pressure.
Net Profit: Bharat Dynamics Limited reported a net profit of ₹549.65 crore in FY25 compared to ₹612.72 crore in FY24. It showed a decrease of -10.29% on a yearly basis, indicating a mild negative performance.
Bharat Dynamics Financial Highlights
- Revenue: Bharat Dynamics reported revenue of ₹2,865.56 crore in FY26 vs ₹3,695.45 crore in FY25. It showed a decrease of 22.46% on a yearly basis.
- Operating Profit: Bharat Dynamics reported an operating profit of ₹567.82 crore in FY26 vs ₹748.76 crore in FY25. It showed a decrease of 24.17% on a year-on-year basis.
- Net Profit: Bharat Dynamics reported a net profit of ₹420.34 crore in FY26 vs ₹549.65 crore in FY25. It showed a decrease of 23.53% on a yearly basis.
Bharat Dynamics Quarterly Result Highlights
- Bharat Dynamics reported revenue of ₹675.68 crore in Jun 2026, compared with ₹599.36 crore in Mar 2026, representing an increase of 12.73% on a quarter-on-quarter (QoQ) basis.
- Bharat Dynamics reported an operating profit of ₹165.63 crore in Jun 2026, compared with ₹153.89 crore in Mar 2026, representing an increase of 7.63% on a quarter-on-quarter (QoQ) basis.
- Bharat Dynamics reported a profit of ₹118.79 crore in Jun 2026, compared with ₹113.18 crore in Mar 2026, reflecting an increase of 4.96% on a QoQ basis.
- The earnings per share (EPS) of Bharat Dynamics stood at ₹11.47 during Jun 2026.
Data Source: BSE, Company announcements
Securities shown are illustrative, not recommendations. Past performance does not guarantee future results.