ATHER ENERGY LIMITED Share Price

ATHER ENERGY LIMITED Share Price Today

As of 31 Jul 2026, ATHER ENERGY LIMITED share price is ā¹1,240.90. The stock opened at ā¹1,253.00, compared to its previous close of ā¹1,246.10. During today's trading session, ATHER ENERGY LIMITED share price moved in the range of ā¹1,232.50 to ā¹1,265.90, with an average price of ā¹1,249.20 for the day. Looking at its last 52-week, the stock has touched a low of ā¹336.35 and a high of ā¹1,345.00. On the performance front, ATHER ENERGY LIMITED share price has increased by 99.74% over the last six months and is up 258.85% on a year-on-year basis.
ATHER ENERGY LIMITED Returns Calculator
ATHER ENERGY LIMITED Shareholder Returns
ATHER ENERGY LIMITED Share Price History
| Name | Mkt Cap Cr | P/E | P/B | ROE | D/E | ROCE | Book Value | Div. Yield | Turnover | EPS(TTM) |
|---|---|---|---|---|---|---|---|---|---|---|
| Maruti Suzuki | 4,38,348.00 | 29.86 | 4.09 | 13.70% | 0.00 | 17.51% | 3,343.16 | 1.00% | 1.64 | 459.46 |
| Mahindra & Mahindra | 4,00,808.00 | 19.32 | 3.55 | 21.89% | 0.02 | 15.27% | 4.78 | 1.08% | 1.82 | 130.18 |
| Bajaj Auto | 3,11,358.00 | 26.95 | 8.02 | 27.67% | 0.00 | 24.52% | 1,272.54 | 1.35% | 1.32 | 352.00 |
| Eicher Motors | 2,13,598.00 | 38.73 | 8.51 | 21.97% | 0.01 | 27.17% | 794.47 | 1.05% | 0.78 | 183.79 |
| TVS Motor Company | 1,93,417.00 | 53.71 | 20.16 | 31.56% | 0.33 | 16.64% | 237.06 | 0.29% | 1.97 | 76.09 |
| HYUNDAI MOTOR INDIA LTD | 1,61,866.00 | 29.80 | 8.09 | 27.14% | 0.06 | 33.27% | 238.39 | 1.05% | 3.10 | 65.50 |
| TATA MOTORS LIMITED | 1,51,506.00 | 47.95 | 11.40 | 34.02% | 0.42 | 28.42% | 10.84 | 1.01% | 3.85 | 9.13 |
| Tata Motors | 1,21,470.00 | 1.33 | 0.97 | 75.90% | 0.23 | 2.31% | 4.37 | 1.01% | 1.97 | 14.26 |
| Hero MotoCorp | 1,02,968.00 | 17.64 | 4.69 | 28.25% | 0.01 | 34.30% | 4.69 | 3.66% | 2.03 | 263.34 |
| Ashok Leyland | 92,865.60 | 26.08 | 6.36 | 28.11% | 0.11 | 13.77% | 6.91 | 2.27% | 2.87 | 6.07 |
ATHER ENERGY LIMITED Financials
Income Statement Ā· Standalone
| Particulars | Mar 2026 | Mar 2025 | Mar 2024 | Mar 2023 |
|---|---|---|---|---|
| Revenue | ā¹3,671.76 | ā¹2,255.01 | ā¹1,753.80 | ā¹1,780.90 |
| Other Income | ā¹151.32 | ā¹50.21 | ā¹35.30 | ā¹20.90 |
| Total Revenue | ā¹3,823.08 | ā¹2,305.22 | ā¹1,789.10 | ā¹1,801.80 |
| Total Expenses | ā¹4,335.21 | ā¹3,117.50 | ā¹2,674.20 | ā¹2,666.30 |
| Profit Before Tax | -ā¹517.17 | -ā¹812.28 | -ā¹1,059.70 | -ā¹864.50 |
| Tax | ā¹0.00 | ā¹0.00 | ā¹0.00 | ā¹0.00 |
| Profit After Tax | -ā¹517.17 | -ā¹812.28 | -ā¹1,059.70 | -ā¹864.50 |
| EPS - Basic | -ā¹13.99 | -ā¹32.24 | -ā¹47.00 | -ā¹12,580.00 |
| EPS - Diluted | -ā¹13.99 | -ā¹32.24 | -ā¹47.00 | -ā¹12,580.00 |
Cash Flow Ā· Standalone
| Particulars | Mar 2026 | Mar 2025 | Mar 2024 | Mar 2023 |
|---|---|---|---|---|
| Profit before tax | -ā¹517.17 | -ā¹812.28 | -ā¹1,059.70 | -ā¹864.50 |
| Income before WC changes | -ā¹292.07 | -ā¹427.50 | -ā¹703.80 | -ā¹494.40 |
| Change in Assets | -ā¹99.41 | -ā¹310.43 | ā¹293.90 | -ā¹683.50 |
| Change in Liabilities | ā¹423.13 | ā¹19.48 | ā¹142.40 | ā¹308.00 |
| Change in WC | ā¹323.72 | -ā¹290.95 | ā¹436.30 | -ā¹375.50 |
| Cash flow from Operations | ā¹31.89 | -ā¹720.70 | -ā¹267.60 | -ā¹871.20 |
| Cash flow from Investing | -ā¹2,526.51 | -ā¹378.16 | -ā¹228.10 | -ā¹135.10 |
| Cash flow from Financing | ā¹2,496.53 | ā¹702.89 | ā¹633.20 | ā¹1,317.40 |
| Total Cash Flow | ā¹1.91 | -ā¹395.97 | ā¹137.50 | ā¹311.10 |
| Cash (Start of the year) | ā¹69.80 | ā¹227.90 | ā¹82.60 | ā¹57.40 |
| Cash (End of the year) | ā¹111.94 | ā¹110.03 | ā¹506.00 | ā¹368.50 |
Balance Sheet Ā· Standalone
| Particulars | Mar 2026 | Mar 2025 | Mar 2024 | Mar 2023 |
|---|---|---|---|---|
| Non-Current Assets | ā¹1,346.61 | ā¹943.75 | ā¹684.10 | ā¹668.50 |
| Current Assets | ā¹3,374.90 | ā¹1,156.86 | ā¹1,229.40 | ā¹1,308.30 |
| Total Assets | ā¹4,721.51 | ā¹2,100.61 | ā¹1,913.50 | ā¹1,976.80 |
| Current Liabilities | ā¹1,395.24 | ā¹1,173.18 | ā¹1,076.40 | ā¹1,019.50 |
| Net Current Asset | ā¹1,979.66 | -ā¹16.32 | ā¹153.00 | ā¹288.80 |
| Non-Current Liabilities | ā¹753.64 | ā¹434.44 | ā¹291.20 | ā¹343.60 |
| Equity Capital | ā¹2,572.63 | ā¹492.99 | ā¹545.90 | ā¹613.70 |
| Total Equity & Liabilities | ā¹4,721.51 | ā¹2,100.61 | ā¹1,913.50 | ā¹1,976.80 |
About ATHER ENERGY LIMITED
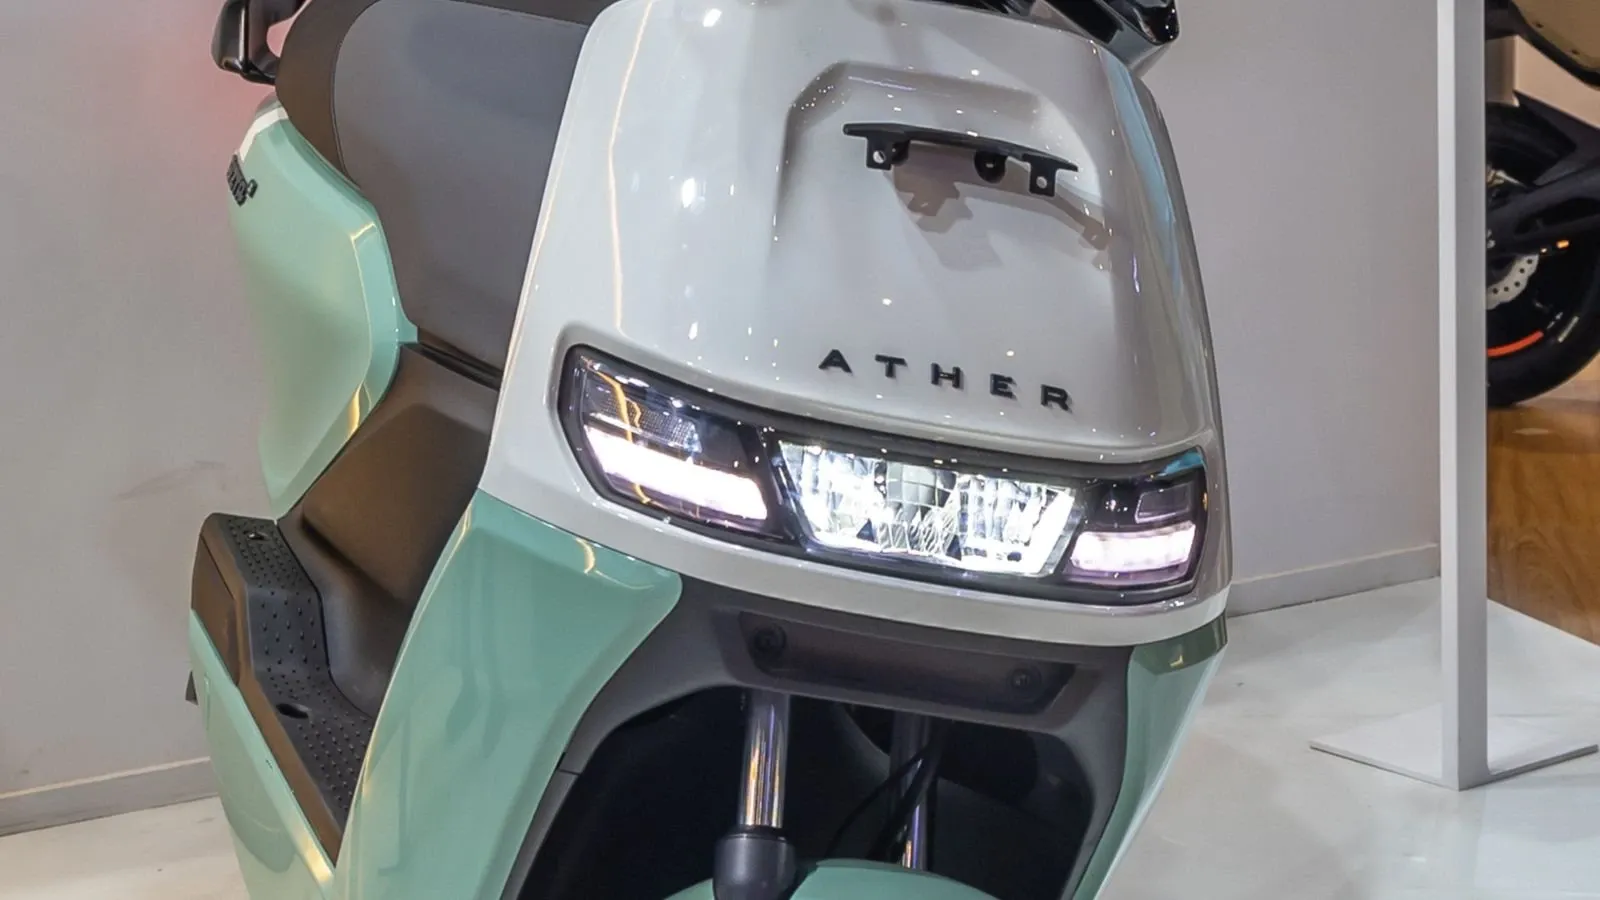
Ather Energy Limited is an India-based pure play electric vehicle (EV) company. The Company specializes in Indian electric two-wheeler (E2W) market. The Company sells E2Ws and the associated product ecosystem, comprised of its software, charging infrastructure and smart accessories, all of which are conceptualized and designed by it in India. Its E2W portfolio comprises two product lines: the Ather 450 line, which caters to customers seeking performance scooters, and the Ather Rizta line, which is targeted at customers seeking convenience scooters for their family. The Companyās software, Atherstack, is developed in-house and powers all Ather products. Atherstack offers approximately 69 features related to navigation, analytics, ride assistance, safety and productivity, as well as integration with its charging infrastructure and smart accessories. Upon purchase of an E2W, its customers have the option to purchase advanced Atherstack software features through the Atherstack Pro.
ATHER ENERGY LIMITED Financial Highlights
- Revenue: ATHER ENERGY LIMITED reported revenue of ā¹3,823.08 crore in FY26 vs ā¹2,305.22 crore in FY25. It showed an increase of 65.84% on a yearly basis.
- Operating Profit: ATHER ENERGY LIMITED reported an operating loss of ā¹517.17 crore in FY26 vs ā¹812.28 crore in FY25. It showed an increase of 36.33% on a year-on-year basis.
- Net Profit: ATHER ENERGY LIMITED reported a net loss of ā¹517.17 crore in FY26 vs ā¹812.28 crore in FY25. It showed an increase of 36.33% on a yearly basis.
ATHER ENERGY LIMITED Quarterly Result Highlights
- ATHER ENERGY LIMITED reported revenue of ā¹1,213.77 crore in Mar 2026, compared with ā¹995.73 crore in Dec 2025, representing an increase of 21.90% on a quarter-on-quarter (QoQ) basis.
- ATHER ENERGY LIMITED reported an operating loss of ā¹100.23 crore in Mar 2026, compared with ā¹84.64 crore in Dec 2025, representing a decrease of 18.42% on a quarter-on-quarter (QoQ) basis.
- ATHER ENERGY LIMITED reported a loss of ā¹100.23 crore in Mar 2026, compared with ā¹84.64 crore in Dec 2025, reflecting a decrease of 18.42% on a QoQ basis.
- The earnings per share (EPS) of ATHER ENERGY LIMITED stood at ā¹13.99 during Mar 2026.
Similar Stocks
FAQs on ATHER ENERGY LIMITED Share Price
What is ATHER ENERGY LIMITED share price today?
ATHER ENERGY LIMITED share price is ā¹1,240.90 as on 30 Jul, 2026, 15:56 IST.
How has the ATHER ENERGY LIMITED share price performed in the past?
In the last 1 year, ATHER ENERGY LIMITED delivered a return of 258.85%. The ATHER ENERGY LIMITED share price hit a high of ā¹1,345.00 and low of ā¹336.35.
How much is the Mutual Fund shareholding in ATHER ENERGY LIMITED shares?
The Mutual Fund Shareholding in ATHER ENERGY LIMITED was 21.05% at the end of Jul 2026.
What is the the 52-week high and low of ATHER ENERGY LIMITED shares ?
The 52-week high and low of ATHER ENERGY LIMITED share is ā¹1,345.00 and ā¹336.35 as of 30 Jul, 2026.
What is the market cap of ATHER ENERGY LIMITED?
The market capitalisation of ATHER ENERGY LIMITED is ā¹49,115.90 Crores as on 30 Jul, 2026.
What are the stock symbols of ATHER ENERGY LIMITED?
The stock symbol of ATHER ENERGY LIMITED is ATHERENERG on the NSE, 544397 on the BSE, and the ISIN is INE0LEZ01016.
How to buy ATHER ENERGY LIMITED shares?
To buy ATHER ENERGY LIMITED shares, open a demat account with Upstox and complete the KYC process. Once your account is set up, search for the stock and place your order.
What was yesterday's closing price of ATHER ENERGY LIMITED shares ?
ATHER ENERGY LIMITED shares closed yesterday at ā¹1,246.10 on NSE & ā¹1,246.20 on BSE
Can I buy ATHER ENERGY LIMITED shares on Holidays?
No, shares of ATHER ENERGY LIMITED or any other publicly traded company cannot be bought or sold on holidays when the stock exchanges are closed. You can only buy or sell ATHER ENERGY LIMITED shares on days when the stock exchanges are open for trading. It's important to check the NSE & BSE holidays calendar, before placing any trades to avoid any inconvenience.