Established in: 1911
Managing Director: Sudarshan Venu
TVS Motor Company Limited is a multinational motorcycle manufacturing company, headquartered in Chennai. It was founded in 1911 by T. V. Sundram Iyengar. The company is the third-largest motorcycle company in India based on revenue, boasting annual sales of in millions with an annual production capacity of over four million vehicles. It is the second-largest two-wheeler exporter in India, exporting vehicles to over 60+ countries in the world.
TVS Motor Company Limited is a flagship company of the TVS Group that boasts high market valuation and turnover. The company launched its IPO and went public in 1997. It is listed on the BSE and NSE, trading under the ticker symbols 532343 and TVSMOTOR, respectively.
History of TVS Motor Company Limited
TVS was founded by T. V. Sundram Iyengar, who started Madurai’s first bus service in 1911. The company started as a transportation business with a large number of trucks and buses.
TVS expanded from a regional transport operator into a conglomerate and entered the auto component manufacturing in 1962. With the launch of TVS 50 in 1980, the company entered the two-wheeler industry.
TVS founded Sundaram Clayton in agreement with a UK firm to manufacture brakes, compressors and auto parts. Later, the company set up a Hosur manufacturing plant and introduced the TVS 50, which was India’s first two-seater moped.
In 1982, the TVS group partnered with Japan's Suzuki Motor Corporation to produce motorcycles, eventually launching iconic models like the TVS Suzuki Shogun, Samurai, and Fiero. When their joint venture ended in 2001, TVS bought out Suzuki's stake and was subsequently incorporated as TVS Motor Company.
Business Segments of TVS Motor Company Limited
The following are the business segments of TVS Motor Company Limited.
- Automotive Vehicles and Components
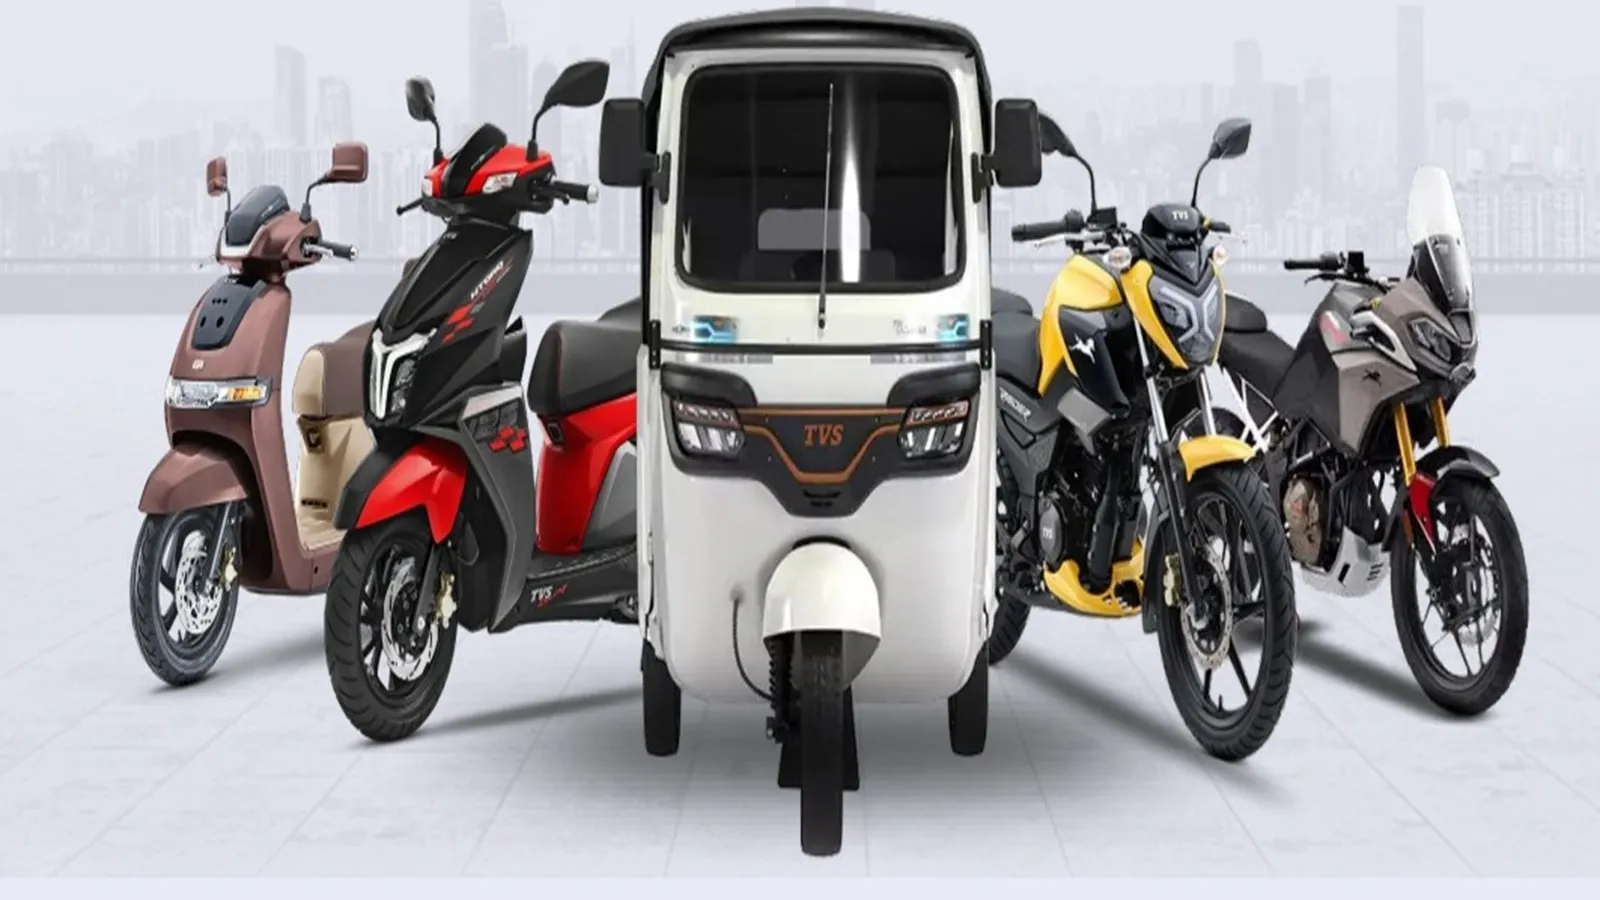
This is the primary revenue-generator segment of the company. It involves producing, marketing and selling two-wheelers such as motorcycles, scooters, electric vehicles, mopeds, and three-wheelers globally.
The company also offers financial services such as vehicle financing to its customers, insurance distribution and mobility support services.
Future Plans of TVS Motor Company Limited
The following are the future plans of TVS Motor Company Limited.
- Manufacturing Capacity Expansion
TVS Motor Company Limited is currently constructing a new manufacturing plant, which is expected to be completed by 2028. This new facility will add up to 2.5 million units of capacity and help the company hit their 100 million target.
The company has invested significantly in expanding its production capacity, strengthening R&D and launching new products for the internal combustion and EV portfolio. The company is expanding its manufacturing capacities in India and Indonesia and is currently establishing a Global Capacity Centre in Dubai to grow its market presence in the Middle East and Africa.
The company is planning to introduce new and more affordable variants and entry-level models to increase its sustainable footprint. The company has partnered with Hyundai Motor Company to co-develop and commercialise electric three-wheelers. The company is producing select Norton Motorcycles models in India and is working on expanding its product portfolio with sub-500cc and adventure-style bikes such as RTX 300.
TVS Motor Company Limited has entered into a joint venture with ALA group to enter the aerospace and defence supply chain market with the aim of securing ₹2,000 crore in revenue by 2031. The company is also integrating AI-driven battery management, navigational assists, and virtual modelling into both their product offerings and manufacturing operations
TVS Motor Company Financial Highlights
- Revenue: TVS Motor Company reported revenue of ₹56,091.53 crore in FY26 vs ₹44,158.57 crore in FY25. It showed an increase of 27.02% on a yearly basis.
- Operating Profit: TVS Motor Company reported an operating profit of ₹4,821.74 crore in FY26 vs ₹3,505.35 crore in FY25. It showed an increase of 37.55% on a year-on-year basis.
- Net Profit: TVS Motor Company reported a net profit of ₹3,186.43 crore in FY26 vs ₹2,379.81 crore in FY25. It showed an increase of 33.89% on a yearly basis.
TVS Motor Company Quarterly Result Highlights
- TVS Motor Company reported revenue of ₹16,453.72 crore in Jun 2026, compared with ₹15,059.38 crore in Mar 2026, representing an increase of 9.26% on a quarter-on-quarter (QoQ) basis.
- TVS Motor Company reported an operating profit of ₹1,545.19 crore in Jun 2026, compared with ₹1,298.13 crore in Mar 2026, representing an increase of 19.03% on a quarter-on-quarter (QoQ) basis.
- TVS Motor Company reported a profit of ₹1,057.61 crore in Jun 2026, compared with ₹819.55 crore in Mar 2026, reflecting an increase of 29.05% on a QoQ basis.
- The earnings per share (EPS) of TVS Motor Company stood at ₹63.53 during Jun 2026.