What Is a Bear Market? A Complete Investor Guide to Market Crashes

Written by Bidita Sen
Published on July 28, 2026 | 17 min read

Key Takeaways
- Bear markets occur when stock indices drop 20% or more from recent peaks.
- Corrections are short-term drops, while bear markets reflect more prolonged declines often associated with macroeconomic or systemic stress.
- Historical Indian equity crashes have been followed by subsequent economic and market recoveries.
- Disciplined regular investing and asset diversification may help investors manage risk during deep market downturns.
Watching your equity portfolio turn red can trigger immediate anxiety. However, periodic market declines are natural parts of the wealth creation cycle. A good understanding of the mechanics of a bear market can help investors better understand market behaviour during prolonged declines.
What is a Bear Market in the Stock Market?
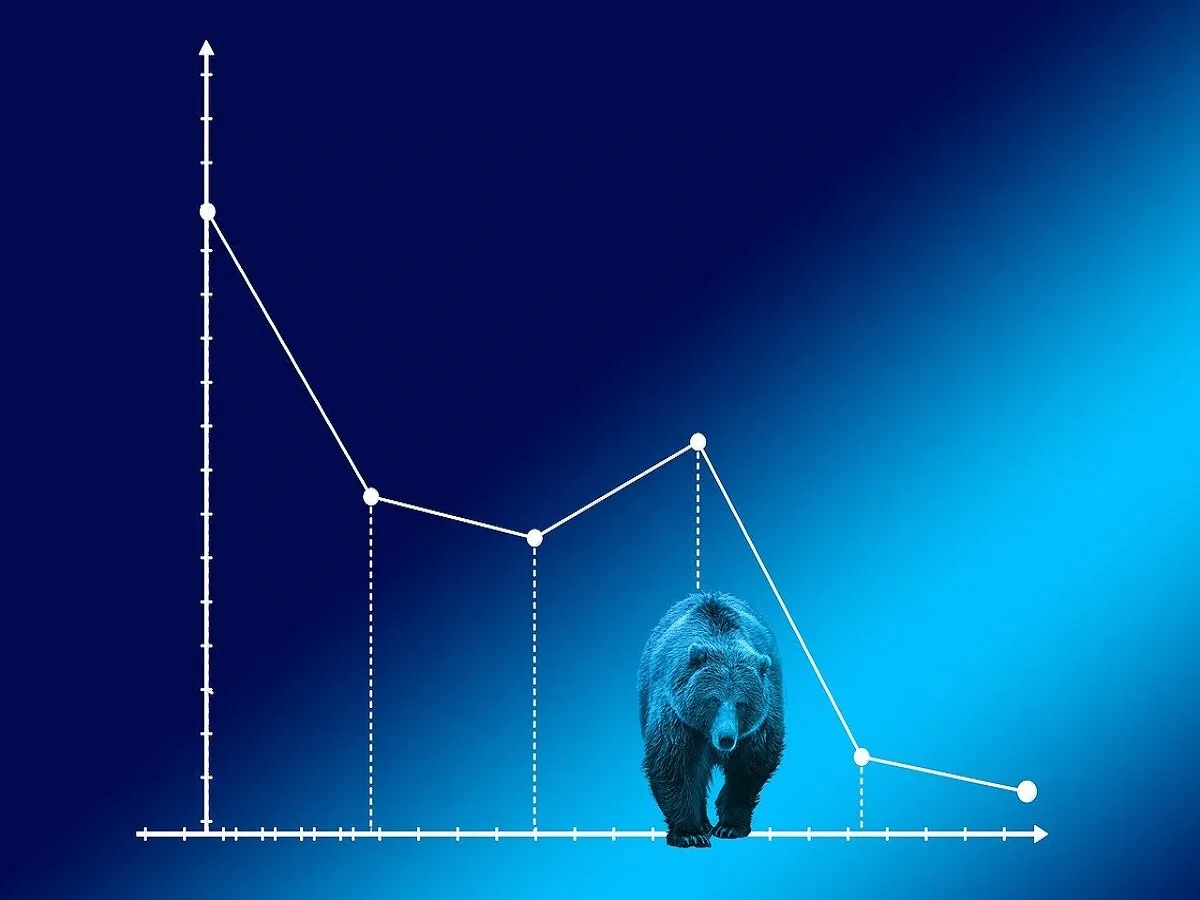
In financial markets, a bear market represents a prolonged period of falling asset prices. Analysts generally define a bear market as a sustained price decline of 20% or more from a recent peak in a major stock index, such as the BSE Sensex or the Nifty 50.
This 20% threshold is widely used as a market convention to indicate a significant decline, where investor optimism may weaken and negative sentiment becomes more widespread.
Unlike short-term market dips, a bear market is characterised by its duration and depth. It involves a prolonged downward trajectory over several months or even years. During these phases, negative economic indicators, declining corporate profits, and geopolitical tensions can contribute to sustained selling pressure.
The Origin of the Term
The terms 'bull' and 'bear' reflect how these animals attack their opponents. A bull thrusts its horns upward into the air, symbolising rising market prices. Conversely, a bear swipes its paws downward, representing falling market prices.
Historically, the term 'bear' is commonly linked to bear-skin jobbers, who were said to sell bearskins before obtaining them, speculating on future price movements. This practice is widely believed to have influenced the modern definition of short-selling, cementing the bear as the ultimate symbol of market declines.
When a bear market takes hold, the psychological impact on retail participants can be immense. Fear replaces greed. Every minor rally may be met with selling pressure as some investors look for exit opportunities. This behaviour can depress asset valuations, often pushing stock prices below estimates of their intrinsic value.
Difference Between Stock Market Correction and Bear Market
Many retail investors use the terms 'correction' and 'bear market' interchangeably, but these terms represent fundamentally different market phenomena.
Market Correction
A market correction is a decline of 10% or more, but less than 20%, from a recent peak. Corrections are common, and many market participants consider them a normal part of market cycles.
They act as a pressure-release valve for overvalued markets. Historically, a typical correction in the Indian equity market lasts anywhere from a few weeks to three months.
During a correction, the underlying macroeconomic fundamentals may remain intact. Corporate earnings may continue to grow, and consumer demand may remain stable. The drop may represent a temporary repricing of assets that have run ahead of their valuations.
Bear Market
A bear market is a structural contraction where the decline exceeds 20%. The drop is often, but not always, accompanied by an economic recession, rising unemployment, or systemic financial stress.
Bear markets have historically lasted anywhere from several months to more than two years, although the duration varies significantly across market cycles.
In a bear market, the broader economic foundation may weaken. Central banks may hike interest rates rapidly to curb inflation, which in turn may squeeze corporate profit margins and reduce consumer spending. Valuation multiples may contract as investors demand higher risk premiums to hold equities.
| Metric | Market Correction | Bear Market |
|---|---|---|
| Percentage Decline | 10% to 20% from the peak | 20% or more from the peak |
| Average Duration | Usually a few weeks to several months | Several months to over two years |
| Economic Context | Healthy growth may continue | Often associated with recession, high inflation, or economic slowdown |
| Investor Sentiment | Temporary caution | Deep fear and risk aversion |
| Recovery Time | Varies depending on market conditions | Varies depending on economic and market conditions |
| Systemic Risk | Low | High |
History of Bear Markets in India: Key Lessons for Investors
To understand the modern Indian investment ecosystem, one must analyse its historical crashes.
The Indian equity market has matured from a speculative trading ring into a highly regulated, institutionalised market.
Historical market data and regulatory developments help trace how major domestic indices have navigated past crises.
| Crisis | Index Drop (%) | Duration |
|---|---|---|
| 1992 Harshad Mehta Scam | Sensex: -54.0% | Approximately 360 days |
| 2000 Dot-com Bust | Nifty 50: -50.1% | Around 550 days |
| 2008 Global Financial Crash | Nifty 50: -59.9% | Close to 293 days |
| 2020 COVID-19 Shock | Nifty 50: -38.4% | Roughly 69 days |
1. The Harshad Mehta Scam Aftermath (1992) The 1992 banking system scam exposed major structural vulnerabilities in the Indian financial sector. Before the scam was revealed, the BSE Sensex had risen to historically elevated levels. Following the exposure of irregularities involving the misuse of bank receipts and the securities settlement system, the market declined sharply.
The Sensex fell by over 54% from its peak in April 1992, entering a bear market that lasted for nearly a year. This crisis also contributed to the Indian government granting statutory powers to SEBI in 1992, establishing a modern securities market regulatory framework.
2. The Dot-com Bust (2000–2001) The turn of the millennium saw a global speculative bubble in technology, media, and telecommunications (TMT) stocks. Companies with limited revenues but strong growth narratives achieved extremely high valuations. When the bubble burst in the United States, the impact extended to Indian IT companies.
The Nifty 50 lost over 50% of its value between February 2000 and September 2001. This bear market highlighted that valuation metrics, such as Price-to-Earnings (P/E) ratios, remain important even in high-growth sectors.
3. The Global Financial Crisis (2008) The collapse of the US subprime housing market triggered a global liquidity freeze. Foreign Institutional Investors (FIIs) faced margin calls in their home markets, leading to significant capital outflows from emerging markets like India.
The Nifty 50 fell from its peak of 6,288 points in January 2008 to a low of 2,524 points in October 2008—a peak-to-trough decline of approximately 59.9%. Despite the sharp decline, the domestic economy remained relatively resilient, allowing the index to complete a full recovery cycle by late 2010.
4. The COVID-19 Pandemic Crash (2020) The sudden onset of the global COVID-19 pandemic and subsequent lockdowns caused an unprecedented liquidity and economic shock. In March 2020, the Nifty 50 declined by 38.4% in approximately 69 trading days.
This was one of the fastest bear markets in Indian history. However, unprecedented global liquidity support by central banks and policy measures, including rate cuts by the Reserve Bank of India (RBI), supported a V-shaped recovery, with the Nifty 50 reclaiming its pre-crash highs within about eight months.
What Causes a Bear Market? Macroeconomic and Global Triggers
Bear markets do not occur in a vacuum. They are often the outcome of deteriorating macroeconomic conditions, corporate underperformance, and structural imbalances. Understanding these triggers helps investors better understand signs of market distress.
1. Tight Monetary Policy and Interest Rate Hikes
When inflation surges, central banks like the RBI or the US Federal Reserve may raise benchmark interest rates. Higher interest rates increase the cost of borrowing for companies and consumers. This can have several negative effects on stock prices:
Earnings Compression: Companies may face higher interest expenses, reducing their net profit margins.
Valuation Rerating: Discount rates used in equity valuation models may increase, reducing the present value of future cash flows.
Asset Allocation Shift: Fixed-income instruments may become more attractive, prompting some institutional investors to shift capital from equities to government bonds and other fixed-income assets.
2. Economic Recession
A technical recession—commonly defined as two consecutive quarters of negative Gross Domestic Product (GDP) growth—may impair corporate earnings. As consumer demand weakens, companies may report lower revenues. This may lead investors to reassess earnings expectations and equity valuations.
3. Geopolitical Crises and Commodity Shocks
India is a major importer of crude oil and industrial commodities. Geopolitical conflicts that disrupt supply chains can cause crude oil prices to surge. For an economy like India, high crude prices may widen the current account deficit, weaken the Indian Rupee (INR), and increase imported inflation. This chain reaction can contribute to FII selling in Indian equities.
4. Bursting of Asset Bubbles
When a specific asset class or sector experiences rapid, speculative price appreciation detached from fundamental realities, it creates a bubble. When the capital flows supporting the bubble dry up, the subsequent collapse can affect broader indices. The 2000 dot-com bust and the 2008 global financial crisis are classic examples.
The Four Phases of a Bear Market: Investor Psychology and Market Behaviour
A bear market is as much a psychological phenomenon as an economic one. Market cycles reflect the collective emotions of millions of participants. Market commentators often describe a bear market as progressing through four distinct phases, each with unique price patterns and investor sentiment.
| Phase | What Happens | Key Characteristics |
|---|---|---|
| Phase 1: Recognition | Investors begin recognising that market conditions are weakening after a prolonged uptrend. | High valuations, slowing economic indicators, weakening earnings expectations, rising risks, and cautious sentiment |
| Phase 2: Panic | Selling accelerates as fear spreads across the market. | Sharp price declines, heavy selling, margin calls, high volatility, and widespread pessimism |
| Phase 3: Stabilisation | The market starts finding a temporary floor, but uncertainty remains. | Dead cat bounces, sideways movement, lower trading volumes, consolidation, and mixed investor sentiment |
| Phase 4: Accumulation | Long-term investors gradually begin buying fundamentally strong stocks at attractive valuations. | Selective buying, improving valuations, institutional accumulation, confidence slowly returns, and lays the foundation for the next market cycle |
Phase 1: High Prices and Latent Risks (Recognition)
At the peak of a bull market, investor sentiment is highly optimistic. Equity valuations are often elevated, and retail participation may be high. However, institutional investors and other market participants may begin identifying underlying risks, such as decelerating earnings growth or tightening central bank liquidity.
Volume may start to thin, and index gains may become concentrated in a few heavyweight stocks. Although prices remain near historical highs, upward momentum may slow.
Phase 2: Sharp Sell-offs and Panic (Panic)
This phase begins when a specific negative catalyst—such as a major regulatory shift, a corporate default, or a global shock—reduces market confidence. Stock prices begin to decline rapidly. As losses mount, retail investors who entered late may face margin calls on leveraged positions.
FIIs may execute large-scale exit orders, creating selling pressure. Volatility indices, such as the India VIX, may rise sharply. Panic selling may increase as some investors liquidate holdings to raise cash.
Phase 3: Dead Cat Bounces and Consolidation (Stabilisation)
After a prolonged decline, stocks may appear oversold. Speculative traders may attempt to buy after the decline, and short-sellers may cover their positions. This can create sudden, sharp upward rallies known as 'dead cat bounces'.
These rallies can sometimes mislead retail investors into believing the bottom has formed. However, if the underlying macroeconomic issues remain unresolved, these bounces may not be sustained. The market may then consolidate at lower levels.
Phase 4: Rock-Bottom Valuations (Accumulation)
This is the final phase of many bear markets, characterised by weak investor sentiment. Trading volumes may drop to multi-year lows, and financial media coverage may remain pessimistic.
However, lower market prices may result in valuation multiples like Price-to-Book (P/B) and P/E ratios becoming relatively more attractive. Long-term institutional investors and promoters may gradually accumulate fundamentally strong companies at lower valuations. Over time, this can contribute to the beginning of the next market cycle.
SEBI Circuit Breakers: How the Indian Market Halts Panic Selling
To help maintain orderly markets during periods of extreme volatility, SEBI has implemented a structured system of index-based circuit breakers. These rules operate similarly to electrical circuit breakers by temporarily halting trading when market movements exceed pre-determined thresholds.
The circuit breaker system applies to both the BSE Sensex and the Nifty 50. If either index hits a specified threshold, trading across equity and equity derivatives segments nationwide is temporarily halted.
| Trigger Level | Time of Trigger | Halt Duration | Re-Open Time |
|---|---|---|---|
| 10% Decline | Before 1:00 PM | 45 minutes | 15 minutes |
| 10% Decline | Between 1:00 PM and 2:00 PM | 15 minutes | 15 minutes |
| 10% Decline | At or after 2:00 PM | No halt | Not applicable |
| 15% Decline | Before 1:00 PM | 1 hour 45 minutes | 15 minutes |
| 15% Decline | Between 1:00 PM and 2:00 PM | 45 minutes | 15 minutes |
| 15% Decline | At or after 2:00 PM | Full-day halt | Not applicable |
| 20% Decline | Any time during market hours | Full-day halt | Not applicable |
These halts allow market participants to digest information, assess market conditions, and place more informed orders. For example, during the COVID-19 market decline in March 2020, the 10% lower circuit was triggered, temporarily halting trading. Once trading resumed, market participants continued trading under normal exchange rules.
How to Invest During a Bear Market: A Step-by-Step Guide for Indian Investors
A bear market can test investor discipline. While the natural human instinct is to move away from falling prices, history shows that bear markets have often been followed by market recoveries over the long term, although past performance does not guarantee future outcomes.
1. Maintain Your SIPs
Many retail investors stop their Systematic Investment Plans (SIPs) when they see their portfolio values declining. This may affect the long-term benefits of a disciplined investment approach. One feature of an SIP is rupee cost averaging. When the Net Asset Value (NAV) declines, a fixed investment amount purchases more mutual fund units. If markets subsequently recover, these additional units may contribute to long-term portfolio growth.
The Math of Rupee Cost Averaging Imagine you invest ₹10,000 monthly in an equity mutual fund scheme: Month 1 (Market Peak): Net Asset Value (NAV) is ₹100. Your ₹10,000 purchases 100 units. Month 2 (Market Drop): The NAV drops to ₹50 due to a bear market. Your ₹10,000 purchases 200 units. Month 3 (Recovery Begins): The NAV recovers partially to ₹80.
If you had invested a lump sum of ₹20,000 in Month 1, your portfolio value in Month 3 would be:
Lump Sum Portfolio Value = 200 units × ₹80 = ₹16,000 (representing a 20% decline from the total amount invested).
By investing through an SIP, you acquired 300 units in total. Your portfolio value in Month 3 is:
SIP Portfolio Value = 300 units × ₹80 = ₹24,000 (representing a 20% increase over the total amount invested through the SIP in this illustrative example).
This illustration demonstrates how rupee cost averaging works under the stated assumptions. Actual investment outcomes will vary depending on market performance and investment timing.
2. Focus on Strong Balance Sheets
During a bull market, even companies with high debt levels may see their stock prices rise due to favourable market sentiment. A bear market can change this dynamic. Higher interest rates and weaker demand may place additional pressure on highly leveraged businesses.
When evaluating individual stocks or sector mutual funds during a market downturn, investors may consider factors such as:
Low Debt-to-Equity Ratios: Lower leverage may indicate a stronger ability to service debt obligations.
High Free Cash Flows: Positive cash flows may support business operations during periods of weaker economic activity.
Strong Competitive Advantages (Moats): Established competitive advantages may help companies remain resilient under changing market conditions.
3. Rebalance Your Asset Allocation
Over the course of a long bull market, the equity portion of your portfolio may grow larger than your target asset allocation. For example, a target portfolio of 60% equity and 40% debt may shift to 80% equity and 20% debt during a prolonged market rally.
A bear market may provide an opportunity for investors to review whether their asset allocation remains aligned with their financial goals and risk profile. Rebalancing involves adjusting the portfolio to restore the desired asset allocation.
4. Consider Dynamic Asset Allocation Funds
If you find the emotional stress of rebalancing manually difficult, some investors choose Dynamic Asset Allocation Funds, commonly known as Balanced Advantage Funds (BAFs). These mutual funds typically use quantitative models to adjust their equity exposure based on market valuation metrics such as P/E and P/B ratios.
When markets are expensive, BAFs may reduce their equity allocation. When valuations become relatively lower, these funds may increase their equity exposure, depending on their investment strategy and scheme objectives.

A bear market is a recurring feature of long-term market cycles. Historically, the Indian equity market has experienced several deep contractions, and major indices such as the Nifty 50 and BSE Sensex have recovered from past bear markets, although future market performance cannot be predicted based on historical trends alone.
By understanding the macroeconomic triggers of these downturns, being aware of SEBI's regulatory safeguards, and following a disciplined investment approach that aligns with individual financial goals and risk tolerance, investors can better navigate periods of market volatility.
FAQs
How long does a bear market last?
A bear market can last anywhere from a few months to over two years, depending on economic conditions. Recovery timelines also vary, but historically, markets have recovered after previous bear markets, although future recoveries are not guaranteed.
Is a bear market a good time to invest?
Bear markets may present opportunities for some investors to invest at lower valuations. However, any investment decision should be based on individual financial goals, risk tolerance, and investment horizon.
Which sectors perform better during a bear market?
Defensive sectors such as healthcare, pharmaceuticals, consumer staples, and utilities have historically tended to perform relatively better than some cyclical sectors during economic slowdowns, although performance varies across market cycles.
What is the difference between a bear market and a stock market crash?
A stock market crash is a sudden and sharp fall in prices over a short period. A bear market is a prolonged decline of 20% or more from recent highs and typically lasts for several months or longer.
Can you lose all your money in a bear market?
A diversified portfolio does not typically lose its entire value solely because of a bear market. However, investments can decline significantly, and losses may become permanent if a company fails or if investments are sold at depressed prices.
How do you know if the market has entered a bear market?
A bear market is generally identified when a major stock index falls 20% or more from its recent peak. It is often accompanied by weak economic growth, falling corporate earnings, and negative investor sentiment.
About Author
Bidita Sen
Senior Editor
Bidita Sen has spent over a decade first understanding the complex language of finance, then translating it into something humans can actually read. After a career spent chasing market trends, she now prefers chasing ghosts. When she's not working, you’ll find her reading or re-watching the Paranormal Activity series. Because, real-life math is much scarier than a haunted house.
Read more from Bidita



















Upstox is a leading Indian financial services company that offers online trading and investment services in stocks, commodities, currencies, mutual funds, and more. Founded in 2009 and headquartered in Mumbai, Upstox is backed by prominent investors including Ratan Tata, Tiger Global, and Kalaari Capital. It operates under RKSV Securities and is registered with SEBI, NSE, BSE, and other regulatory bodies, ensuring secure and compliant trading experiences.
Related articles
Share Market
What Is a Market Correction? Meaning, Causes, and Strategy15 min read | Written by Bidita Sen

Share Market
Cyclical vs Defensive Stocks: Differences, Examples and Strategy15 min read | Written by Bidita Sen

Share Market
What is Efficiency Ratio: Meaning, Types, Formula and More12 min read | Written by Sachin Gupta

Share Market
What is a Solvency Ratio: Meaning, Types, Benefits, Limitations and More12 min read | Written by Sachin Gupta
Share Market
Profitability Ratios: Meaning, Formula, Benefits, Limitations and More11 min read | Written by Sachin Gupta
Share Market
A Guide to American Depository Receipts (ADR) for Indian Investors13 min read | Written by Subhasish Mandal