As of 6 Jul 2026, Vedanta share price is ₹282.00. The stock opened at ₹281.95, compared to its previous close of ₹280.40. During today's trading session, Vedanta share price moved in the range of ₹278.55 to ₹282.85, with an average price of ₹280.70 for the day. Looking at its last 52-week, the stock has touched a low of ₹268.70 and a high of ₹795.00. On the performance front, Vedanta share price has increased by 21.52% over the last six months and is up 63.59% on a year-on-year basis.

| Name | Mkt Cap Cr | P/E | P/B | ROE | D/E | ROCE | Book Value | Div. Yield | Turnover | EPS(TTM) |

|---|---|---|---|---|---|---|---|---|---|---|
| Hindustan Zinc | 2,26,794.00 | 15.34 | 9.38 | 76.94% | 0.55 | 66.34% | 9.44 | 1.99% | 1.26 | 32.45 |
| Hindalco Industries | 2,14,082.00 | 14.66 | 1.44 | 12.97% | 0.21 | 12.68% | 2.56 | 0.56% | 1.20 | 45.40 |
| VEDANTA ALUMINIUM METAL L | 1,80,679.00 | 0.00 | 462.15 | 49.39% | -0.84 | -158.42% | 1.00 | 0.00% | 0.00 | -3.66 |
| National Aluminium | 63,859.70 | 11.02 | 2.96 | 26.83% | 0.00 | 35.20% | 119.04 | 3.02% | 0.76 | 31.67 |
| Hindustan Copper | 48,283.50 | 52.56 | 14.45 | 27.48% | 0.03 | 34.56% | 34.62 | 0.57% | 0.86 | 9.52 |
| Gravita India | 12,723.50 | 33.63 | 5.19 | 15.45% | 0.18 | 14.84% | 250.22 | 0.37% | 1.87 | 40.25 |
| JAIN RESOURCE RECYCLING L | 12,580.10 | 36.20 | 8.06 | 22.25% | 0.81 | 19.98% | 44.71 | 0.00% | 5.78 | 10.37 |
| Precision Wires India | 168.14 | 10.92 | 0.86 | 8.93% | 0.38 | 16.76% | 42.25 | 0.39% | 5.66 | 8.58 |
| KSH INTERNATIONAL LIMITED | 5,747.04 | 52.20 | 7.11 | 13.63% | 0.40 | 16.82% | 119.27 | 0.00% | 3.67 | 18.38 |
| Shivalik Bimetal Con | 4,567.15 | 47.65 | 9.49 | 19.91% | 0.09 | 23.82% | 78.00 | 0.50% | 0.99 | 14.20 |
| Particulars | Mar 2026 | Mar 2025 | Mar 2024 | Mar 2023 |
|---|---|---|---|---|
| Revenue | ₹78,437.00 | ₹62,717.00 | ₹143,727.00 | ₹147,308.00 |
| Other Income | ₹1,550.00 | ₹1,830.00 | ₹2,550.00 | ₹2,851.00 |
| Total Revenue | ₹79,987.00 | ₹64,547.00 | ₹146,277.00 | ₹150,159.00 |
| Total Expenses | ₹62,880.00 | ₹52,569.00 | ₹128,717.00 | ₹129,666.00 |
| Profit Before Tax | ₹17,126.00 | ₹11,628.00 | ₹20,365.00 | ₹20,276.00 |
| Tax | ₹4,646.00 | ₹2,352.00 | ₹12,826.00 | ₹5,770.00 |
| Profit After Tax | ₹12,480.00 | ₹9,276.00 | ₹7,539.00 | ₹14,506.00 |
| EPS - Basic | ₹44.58 | ₹38.97 | ₹11.42 | ₹28.50 |
| EPS - Diluted | ₹44.21 | ₹38.65 | ₹11.33 | ₹28.32 |
| Particulars | Mar 2026 | Mar 2025 | Mar 2024 | Mar 2023 |
|---|---|---|---|---|
| Profit before tax | ₹35,426.00 | ₹26,877.00 | ₹20,365.00 | ₹20,276.00 |
| Income before WC changes | ₹55,494.00 | ₹43,310.00 | ₹36,787.00 | ₹34,823.00 |
| Change in Assets | -₹4,894.00 | ₹3,839.00 | ₹1,850.00 | ₹934.00 |
| Change in Liabilities | -₹2,965.00 | -₹4,504.00 | -₹298.00 | ₹3,665.00 |
| Change in WC | -₹7,859.00 | -₹665.00 | ₹1,552.00 | ₹4,599.00 |
| Cash flow from Operations | ₹39,499.00 | ₹39,562.00 | ₹35,654.00 | ₹33,065.00 |
| Cash flow from Investing | -₹24,338.00 | -₹19,190.00 | -₹13,686.00 | -₹693.00 |
| Cash flow from Financing | -₹13,549.00 | -₹19,223.00 | -₹26,092.00 | -₹34,142.00 |
| Total Cash Flow | ₹1,816.00 | ₹1,181.00 | -₹4,114.00 | -₹1,745.00 |
| Cash (Start of the year) | ₹3,993.00 | ₹2,812.00 | ₹6,926.00 | ₹8,671.00 |
| Cash (End of the year) | ₹5,809.00 | ₹3,993.00 | ₹2,812.00 | ₹6,926.00 |
| Particulars | Mar 2026 | Mar 2025 | Mar 2024 | Mar 2023 |
|---|---|---|---|---|
| Non-Current Assets | ₹206,427.00 | ₹151,528.00 | ₹138,883.00 | ₹134,870.00 |
| Current Assets | ₹26,810.00 | ₹51,765.00 | ₹51,924.00 | ₹60,507.00 |
| Total Assets | ₹233,237.00 | ₹203,293.00 | ₹190,807.00 | ₹195,377.00 |
| Current Liabilities | ₹35,023.00 | ₹73,575.00 | ₹78,661.00 | ₹87,047.00 |
| Net Current Asset | -₹8,213.00 | -₹21,810.00 | -₹26,737.00 | -₹26,540.00 |
| Non-Current Liabilities | ₹129,637.00 | ₹75,965.00 | ₹70,077.00 | ₹58,903.00 |
| Equity Capital | ₹68,577.00 | ₹53,753.00 | ₹42,069.00 | ₹49,427.00 |
| Total Equity & Liabilities | ₹233,237.00 | ₹203,293.00 | ₹190,807.00 | ₹195,377.00 |
| Particulars | Mar 2026 | Mar 2025 | Mar 2024 | Mar 2023 |
|---|---|---|---|---|
| Revenue | ₹24,252.00 | ₹74,295.00 | ₹70,757.00 | ₹68,080.00 |
| Other Income | ₹3,219.00 | ₹11,507.00 | ₹5,551.00 | ₹21,262.00 |
| Total Revenue | ₹27,471.00 | ₹85,802.00 | ₹76,308.00 | ₹89,342.00 |
| Total Expenses | ₹25,956.00 | ₹68,698.00 | ₹67,646.00 | ₹66,685.00 |
| Profit Before Tax | ₹5,954.00 | ₹20,009.00 | ₹13,735.00 | ₹18,877.00 |
| Tax | -₹274.00 | ₹2,081.00 | ₹7,112.00 | -₹2,382.00 |
| Profit After Tax | ₹6,228.00 | ₹17,928.00 | ₹6,623.00 | ₹21,259.00 |
| EPS - Basic | ₹45.34 | ₹46.53 | ₹17.80 | ₹57.15 |
| EPS - Diluted | ₹45.34 | ₹46.53 | ₹17.80 | ₹57.15 |
| Particulars | Mar 2026 | Mar 2025 | Mar 2024 | Mar 2023 |
|---|---|---|---|---|
| Profit before tax | ₹21,175.00 | ₹20,009.00 | ₹13,735.00 | ₹18,877.00 |
| Income before WC changes | ₹22,443.00 | ₹16,853.00 | ₹13,769.00 | ₹10,027.00 |
| Change in Assets | -₹2,796.00 | ₹1,496.00 | ₹358.00 | ₹581.00 |
| Change in Liabilities | -₹3,493.00 | -₹2,977.00 | -₹355.00 | ₹4,911.00 |
| Change in WC | -₹6,289.00 | -₹1,481.00 | ₹3.00 | ₹5,492.00 |
| Cash flow from Operations | ₹14,312.00 | ₹17,011.00 | ₹13,535.00 | ₹12,491.00 |
| Cash flow from Investing | -₹2,139.00 | -₹1,228.00 | ₹6,173.00 | ₹16,312.00 |
| Cash flow from Financing | -₹11,133.00 | -₹14,649.00 | -₹23,367.00 | -₹29,174.00 |
| Total Cash Flow | ₹1,062.00 | ₹1,134.00 | -₹3,659.00 | -₹371.00 |
| Cash (Start of the year) | ₹2,622.00 | ₹1,488.00 | ₹5,147.00 | ₹5,518.00 |
| Cash (End of the year) | ₹3,684.00 | ₹2,622.00 | ₹1,488.00 | ₹5,147.00 |
| Particulars | Mar 2026 | Mar 2025 | Mar 2024 | Mar 2023 |
|---|---|---|---|---|
| Non-Current Assets | ₹168,210.00 | ₹132,697.00 | ₹124,926.00 | ₹126,739.00 |
| Current Assets | ₹9,170.00 | ₹27,293.00 | ₹25,587.00 | ₹33,101.00 |
| Total Assets | ₹177,380.00 | ₹159,990.00 | ₹150,513.00 | ₹159,840.00 |
| Current Liabilities | ₹13,694.00 | ₹46,753.00 | ₹50,114.00 | ₹53,578.00 |
| Net Current Asset | -₹4,524.00 | -₹19,460.00 | -₹24,527.00 | -₹20,477.00 |
| Non-Current Liabilities | ₹85,637.00 | ₹37,838.00 | ₹34,863.00 | ₹36,414.00 |
| Equity Capital | ₹78,049.00 | ₹75,399.00 | ₹65,536.00 | ₹69,848.00 |
| Total Equity & Liabilities | ₹177,380.00 | ₹159,990.00 | ₹150,513.00 | ₹159,840.00 |
Incorporated in: 1965 Founder: Anil Agarwal Parent company: Vedanta Resources.
Vedanta Limited is one of India’s prominent mining company involved in exploring, extracting and processing minerals, oil & gas. The company deals in zinc, lead, silver, aluminium, iron ore, steel, copper, power and ferrochrome mining.
Vedanta Limited operates mines in Goa, Karnataka, Rajasthan and Odisha. The company plays a key role in supporting India’s industrial and infrastructure growth.
They focus on large-scale operations, cost efficiency and sustainable resource development, while continuously investing in technology, safety and environmental responsibility.
The company has made a comprehensive framework to be the ESG leader in the natural resource sector. Vedanta Limited set a target of reducing carbon emissions to zero by 2050 or sooner. The company has pledged $5 billion over the next ten years to accelerate the transition to net-zero operations.
Vedanta’s journey began in 1976, when Anil Agarwal started a small scrap metal business in Mumbai. Over the years, it slowly expanded into mining and metals, acquiring and developing world-class assets in zinc, aluminium, copper and iron ore.
Vedanta Limited strengthened its global footprint through key acquisitions, including Cairn India, marking its entry into oil and gas.
For two decades, the company facilitated the growth of the Indian economy by contributing to the national exchequer and creating thousands of jobs.
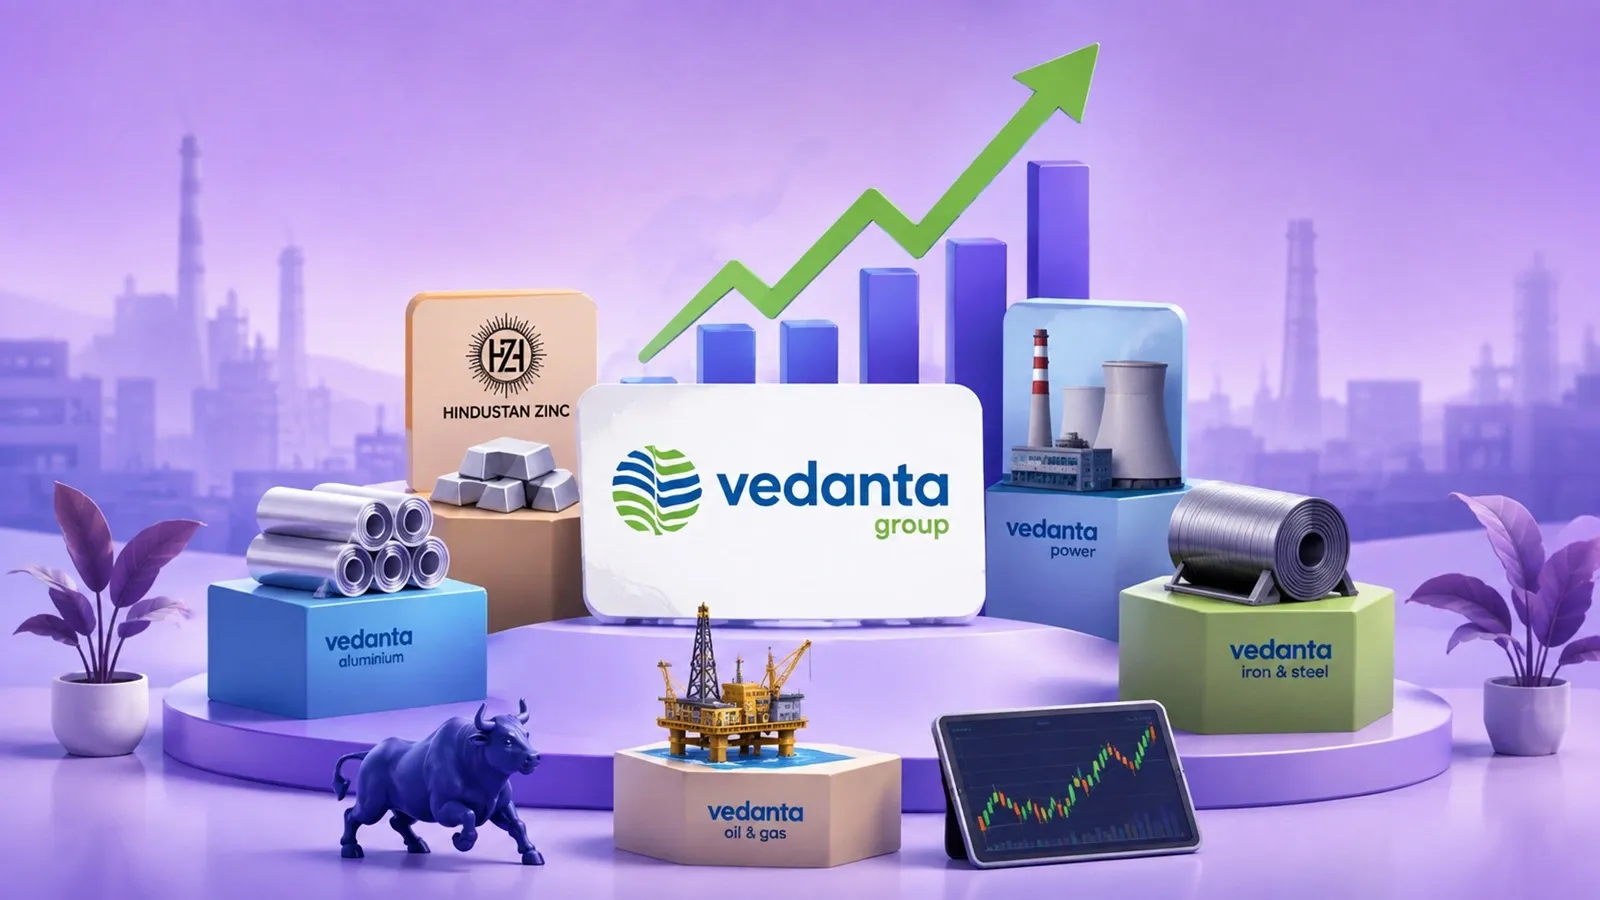
Vedanta’s business is divided into five segments:
1. Zinc, Lead & Silver: Vedanta is the world’s largest integrated zinc producer, with Hindustan Zinc being a major contributor to its profits and cash flows.
2. Aluminium: The company operates across the aluminium value chain, from bauxite mining and alumina refining to aluminium smelting and power generation.
3. Oil and Gas: Through Cairn Oil and Gas, Vedanta is one of the largest private oil producers, supplying a big share of the country’s domestic crude output.
4. Iron Ore and Steel: Vedanta mines Iron ore in India and Liberia, supporting infrastructure development.
5. Power: To support its large operations, Vedanta runs a captive power plant, ensuring cost efficiency and energy security.
The subsidiary companies under Vedanta Limited are:
The company has a strong focus on community development, including rural infrastructure, education and women empowerment.
Vedanta ranked in the Dow Jones Sustainability Index S&P assessment and got various awards, such as the Apex Green Leaf Award for environmental excellence.
Revenue: Vedanta reported a consolidated revenue of ₹1,56,643 crore in FY25 vs ₹1,46,277 crore in FY24. It showed an increase of 7.08% on a yearly basis, reflecting decent growth.
Operating Profit: The company reported an operating profit of ₹26,877 crore in FY25 vs ₹20,365 crore in FY24. It showed an increase of 31.97 % on a year-on-year basis, indicating that the company's operating profit is growing well.
Net Profit: Vedanta reported a net profit of ₹20,535 crore in FY25 compared to ₹7,539 crore in FY24. It showed an increase of 172.38% on a yearly basis, indicating an improvement in overall performance.
Vedanta share price is ₹282.00 as on 06 Jul, 2026, 15:58 IST.
In the last 1 year, Vedanta delivered a return of 63.59%. The Vedanta share price hit a high of ₹795.00 and low of ₹268.70.
The Mutual Fund Shareholding in Vedanta was 6.90% at the end of Mar 2026.
The 52-week high and low of Vedanta share is ₹795.00 and ₹268.70 as of 06 Jul, 2026.
The market capitalisation of Vedanta is ₹1,09,608.00 Crores as on 06 Jul, 2026.
The stock symbol of Vedanta is VEDL on the NSE, 500295 on the BSE, and the ISIN is INE205A01025.
Vedanta shares closed yesterday at ₹280.40 on NSE & ₹280.30 on BSE
To buy Vedanta shares, open a demat account with Upstox and complete the KYC process. Once your account is set up, search for the stock and place your order.
No, shares of Vedanta or any other publicly traded company cannot be bought or sold on holidays when the stock exchanges are closed. You can only buy or sell Vedanta shares on days when the stock exchanges are open for trading. It's important to check the NSE & BSE holidays calendar, before placing any trades to avoid any inconvenience.
The PE and PB ratio of Vedanta is 14.72 and 5.16 respectively, as on 06 Jul, 2026, 15:58 IST.