Logo

Avanti Feeds Share Price

NSE: AVANTIFEED
|
Consumer Food
₹ 955.60
+₹8.25 (0.87%)
1D
Last updated 03 Jul, 2026, 15:59 IST

Avanti Feeds Share Price Today

As of 5 Jul 2026, Avanti Feeds share price is ₹955.60. The stock opened at ₹957.50, compared to its previous close of ₹947.35. During today's trading session, Avanti Feeds share price moved in the range of ₹947.80 to ₹971.85, with an average price of ₹959.83 for the day. Looking at its last 52-week, the stock has touched a low of ₹614.25 and a high of ₹1,593.80. On the performance front, Avanti Feeds share price has increased by 8.56% over the last six months and is up 28.99% on a year-on-year basis.


₹947.80
0.87% up today
₹971.85
1D LOW
1D HIGH

Avanti Feeds Returns Calculator

Open
₹957.50
High
₹971.85
Low
₹947.80
Prev. close
₹947.35

Circuit
L
H
₹764.50
₹1,146.70
52-week
L
H
₹614.25
₹1,593.80

Avanti Feeds Shareholder Returns

Avanti Feeds Share Price History

Mkt Cap Cr
12,905.20

P/E
19.65

P/B
3.93

ROE
18.44%

D/E
0.00

ROCE
26.73%

Div. Yield
1.06%

EPS(TTM)
39.48
Turnover
1.55

EV/EBITDA
13.15

Net Margin
0.00%

Op. Margin
0.00%

ROA
15.42%

Quick Ratio
0.00

Curr. Ratio
5.04
Based on fundamentals, this stock's
Step 1 of 5
Performance
Very Poor
Avanti Feeds has not beaten FD return of 7%
Step 3 of 5
Valuation
Fairly Valued
Avanti Feeds appears to be fairly valued compared to its peers
Step 4 of 5
Earnings
Good
Avanti Feeds revenue, operating profit and net profit are growing
Peer Comparison
Peer comparison — key ratios
NameMkt Cap CrP/EP/BROED/EROCEBook ValueDiv. YieldTurnoverEPS(TTM)
Hindustan Unilever5,19,424.0032.129.9131.07%0.0325.43%9.811.99%0.9765.66
Nestle India2,78,882.0064.7343.9376.34%0.1756.47%42.671.02%2.6818.38
Varun Beverages1,72,641.0052.658.5915.51%0.0219.85%53.420.21%0.687.91
Britannia Industries1,29,450.0051.0225.3549.61%0.2951.85%192.691.68%3.62106.35
Marico1,11,174.0061.3426.4141.85%0.0340.56%44.730.47%1.5915.00
Godrej Consumer Products1,10,234.0059.228.7114.71%0.3817.09%76.661.86%1.0914.81
LENSKART SOLUTIONS LTD92,343.50184.4110.575.65%0.207.00%52.450.00%0.492.80
Dabur India79,251.3042.436.9416.59%0.0820.18%42.431.85%1.208.41
Colgate Palmolive9,183.4023.6827.81158.62%0.03179.72%58.242.33%3.5948.73
PATANJALI FOODS LIMITED45,064.0024.833.4415.37%0.2110.59%120.370.84%3.0516.69

Avanti Feeds Financials

Full statement

Income Statement · Consolidated

Income Statement · Consolidated — all values in INR Crore
ParticularsMar 2025Mar 2024Mar 2023Mar 2022
Revenue₹5,612.26₹5,368.89₹5,086.99₹5,035.96
Other Income₹165.48₹136.27₹92.02₹81.67
Total Revenue₹5,777.74₹5,505.16₹5,179.00₹5,117.63
Total Expenses₹5,040.49₹4,968.52₹4,738.58₹4,756.75
Profit Before Tax₹737.49₹536.86₹426.78₹323.89
Tax₹180.44₹143.05₹114.53₹78.67
Profit After Tax₹557.05₹393.81₹312.25₹245.23
EPS - Basic₹38.81₹26.21₹20.45₹16.26
EPS - Diluted₹38.81₹26.21₹20.45₹16.26

Cash Flow · Consolidated

Cash Flow · Consolidated — all values in INR Crore
ParticularsMar 2025Mar 2024Mar 2023Mar 2022
Profit before tax₹737.49₹536.86₹426.78₹323.89
Income before WC changes₹643.32₹468.88₹389.12₹298.88
Change in Assets₹5.68-₹91.07₹179.74-₹512.89
Change in Liabilities₹98.33₹19.81-₹27.39₹77.10
Change in WC₹104.01-₹71.26₹152.35-₹435.79
Cash flow from Operations₹584.36₹260.11₹451.18-₹212.35
Cash flow from Investing-₹485.12-₹217.83-₹417.50₹298.99
Cash flow from Financing-₹85.63-₹63.39-₹65.45-₹68.28
Total Cash Flow₹13.61-₹21.12-₹31.77₹18.35
Cash (Start of the year)₹12.52₹33.64₹65.41₹47.06
Cash (End of the year)₹26.13₹12.52₹33.64₹65.41

Balance Sheet · Consolidated

Balance Sheet · Consolidated — all values in INR Crore
ParticularsMar 2025Mar 2024Mar 2023Mar 2022
Non-Current Assets₹691.17₹593.47₹523.90₹487.28
Current Assets₹2,991.53₹2,504.72₹2,210.75₹2,028.92
Total Assets₹3,682.70₹3,098.19₹2,734.65₹2,516.21
Current Liabilities₹452.93₹351.19₹323.15₹351.02
Net Current Asset₹2,538.60₹2,153.52₹1,887.60₹1,677.91
Non-Current Liabilities₹54.93₹57.72₹34.65₹17.80
Equity Capital₹3,174.84₹2,689.27₹2,376.85₹2,147.39
Total Equity & Liabilities₹3,682.70₹3,098.19₹2,734.65₹2,516.21

Income Statement · Standalone

Income Statement · Standalone — all values in INR Crore
ParticularsMar 2025Mar 2024Mar 2023Mar 2022
Revenue₹4,432.66₹4,290.28₹4,041.36₹4,047.55
Other Income₹130.55₹105.38₹62.75₹60.46
Total Revenue₹4,563.21₹4,395.66₹4,104.11₹4,108.01
Total Expenses₹3,904.47₹3,988.66₹3,797.30₹3,843.73
Profit Before Tax₹658.74₹407.00₹306.81₹264.28
Tax₹166.44₹98.94₹73.96₹65.02
Profit After Tax₹492.30₹308.06₹232.84₹199.26
EPS - Basic₹36.13₹22.61₹17.09₹14.62
EPS - Diluted₹36.13₹22.61₹17.09₹14.62

Cash Flow · Standalone

Cash Flow · Standalone — all values in INR Crore
ParticularsMar 2025Mar 2024Mar 2023Mar 2022
Profit before tax₹658.74₹407.00₹306.81₹264.28
Income before WC changes₹561.99₹341.58₹274.03₹231.53
Change in Assets₹182.01-₹73.06₹107.58-₹399.38
Change in Liabilities₹68.78₹11.93-₹24.53₹54.84
Change in WC₹250.79-₹61.13₹83.05-₹344.54
Cash flow from Operations₹671.08₹176.81₹288.40-₹178.53
Cash flow from Investing-₹562.98-₹107.88-₹230.35₹280.48
Cash flow from Financing-₹94.74-₹85.43-₹84.22-₹85.75
Total Cash Flow₹13.36-₹16.51-₹26.18₹16.19
Cash (Start of the year)₹7.27₹23.78₹49.96₹33.76
Cash (End of the year)₹20.63₹7.27₹23.78₹49.96

Balance Sheet · Standalone

Balance Sheet · Standalone — all values in INR Crore
ParticularsMar 2025Mar 2024Mar 2023Mar 2022
Non-Current Assets₹511.73₹461.68₹424.68₹409.51
Current Assets₹2,273.62₹1,841.81₹1,640.24₹1,529.90
Total Assets₹2,785.35₹2,303.49₹2,064.92₹1,939.41
Current Liabilities₹368.09₹294.87₹279.08₹301.92
Net Current Asset₹1,905.53₹1,546.94₹1,361.16₹1,227.99
Non-Current Liabilities₹32.85₹23.37₹22.34₹21.42
Equity Capital₹2,384.41₹1,985.25₹1,763.50₹1,616.08
Total Equity & Liabilities₹2,785.35₹2,303.49₹2,064.92₹1,939.41
* All values are in INR Crore
Qty
Bid
0
0
0
0
0
0
0
0
0
0
Ask
Qty
955.6
335
0
0
0
0
0
0
0
0
Bid Total: 0
Ask Total: 335
Buy orders: 0%
Sell orders: 100%
Bearish
3
Neutral
5
Bullish
0
Slightly Bearish
by SEBI experts
Expert Pick
EXPPICK
Stop-loss
Entry price
Target
Indicator
Value
Verdict

RSI (14)
32.28
Neutral

ATR (14)
37.73
Neutral

STOCH(9,6)
38.95
Neutral

STOCH RSI (14)
100
Bearish

ADX(9)
38.75
Bearish

UO(9)
30.8
Neutral

ROC(12)
-4.53
Bearish

WillR(14)
-79.7
Neutral
Period
Simple value
Exponential vaue

5D
943.07
951.09

10D
956.64
964.13

20D
993.88
1011.92

50D
1193.06
1116.06

100D
1230.14
1126.05

About Avanti Feeds

Avanti Feeds logo
ISIN
INE871C01038
Sector Market Cap
₹ 12,905.2 Cr

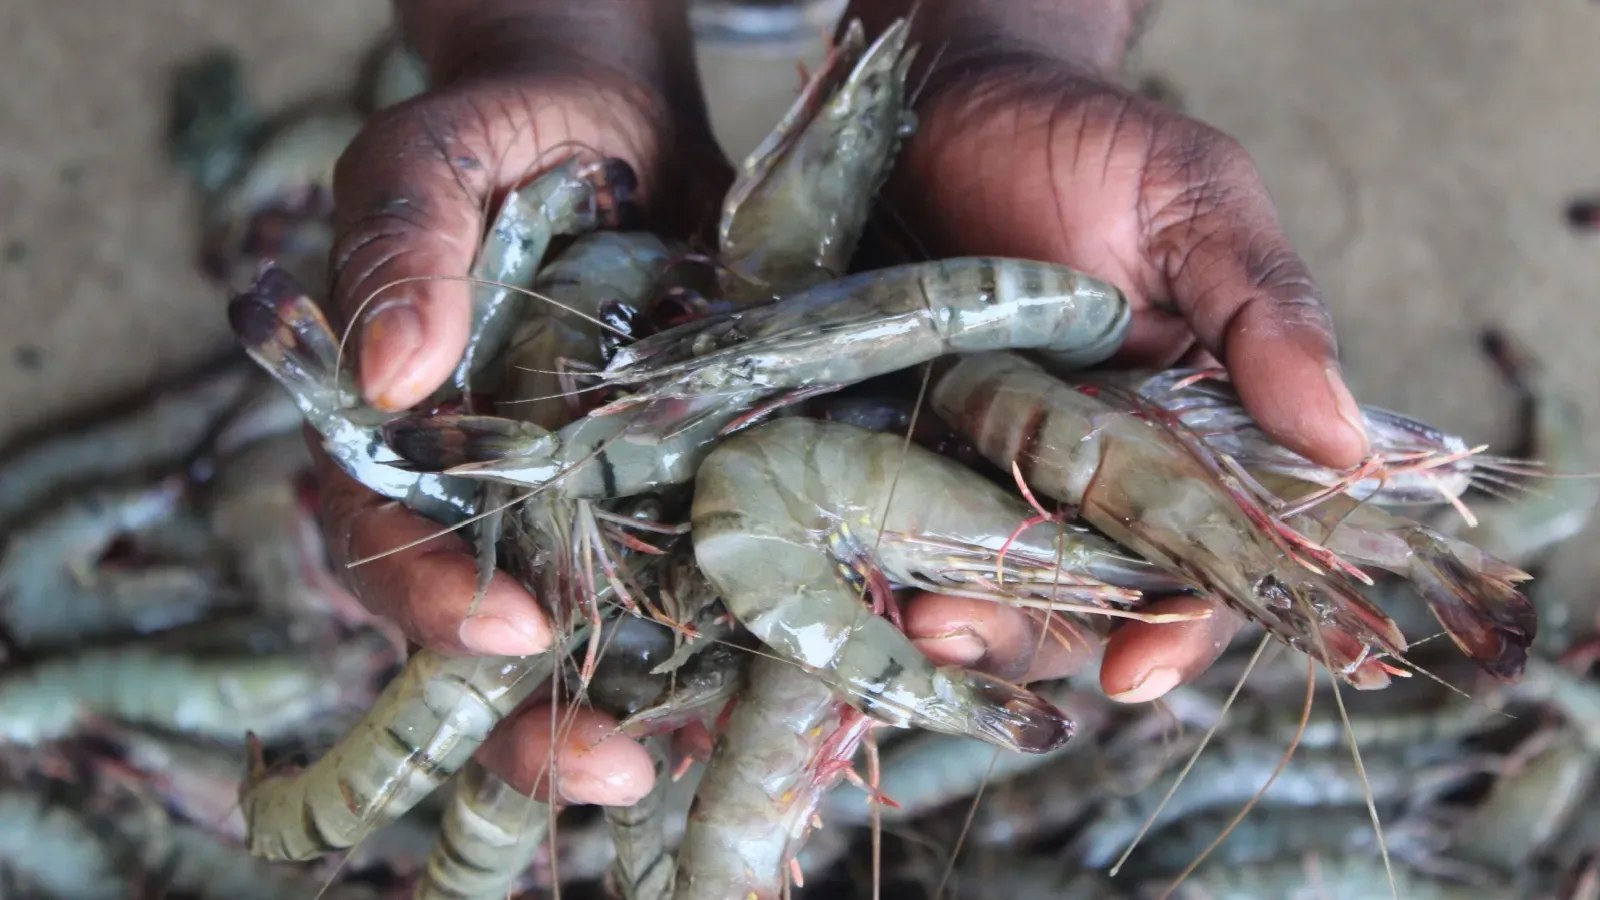
Avanti Feeds Limited is engaged in manufacturing of shrimp feed. The Company operates through three segments: Shrimp Feed, Windmills, and Hatchery. The shrimp feed is manufactured and marketed to farmers, which is used in aqua culture to grow shrimp. The shrimps are purchased from the farmers and are further processed and exported to various countries. It has installed over four mills of over 3.2 megawatts capacity at Chitradurga, Karnataka. The power generated from windmills is sold to Bangalore Electricity Supply Company Limited (BESCOM) under a power purchase agreement. It has six shrimp feed manufacturing units and one hatchery. The Company’s products include raw shrimp, cooked shrimp, and value-added shrimp. Its value-added shrimps include marinated products, breaded products, skewers, and shrimp rings. The Company provides its products to various markets, such as Europe, Japan, Korea, China, Russia, Canada, and the Middle East.

Avanti Feeds Financial Highlights

  • Revenue: Avanti Feeds reported revenue of ₹6,276.47 crore in FY26 vs ₹5,764.17 crore in FY25. It showed an increase of 8.89% on a yearly basis.
  • Operating Profit: Avanti Feeds reported an operating profit of ₹880.27 crore in FY26 vs ₹737.26 crore in FY25. It showed an increase of 19.40% on a year-on-year basis.
  • Net Profit: Avanti Feeds reported a net profit of ₹656.80 crore in FY26 vs ₹557.05 crore in FY25. It showed an increase of 17.91% on a yearly basis.

Avanti Feeds Quarterly Result Highlights

  • Avanti Feeds reported revenue of ₹1,515.20 crore in Mar 2026, compared with ₹1,446.57 crore in Dec 2025, representing an increase of 4.74% on a quarter-on-quarter (QoQ) basis.
  • Avanti Feeds reported an operating profit of ₹183.05 crore in Mar 2026, compared with ₹222.22 crore in Dec 2025, representing a decrease of 17.63% on a quarter-on-quarter (QoQ) basis.
  • Avanti Feeds reported a profit of ₹138.86 crore in Mar 2026, compared with ₹163.48 crore in Dec 2025, reflecting a decrease of 15.06% on a QoQ basis.
  • The earnings per share (EPS) of Avanti Feeds stood at ₹38.81 during Mar 2026.
Know more
Promoters
43.23%
FII
7.63%
Other DII
0.47%
Retail and other
42.32%
Mutual funds
6.35%
Foreign institutions - FII
Compare against other stocks
Avanti Feeds logo
Avanti Feeds
Consumer Food
Add Stock
Add Another

FAQs on Avanti Feeds Share Price