Golden Cross Pattern: Definition and Examples

Written by Mariyam Sara
Published on October 18, 2023 | 5 min read
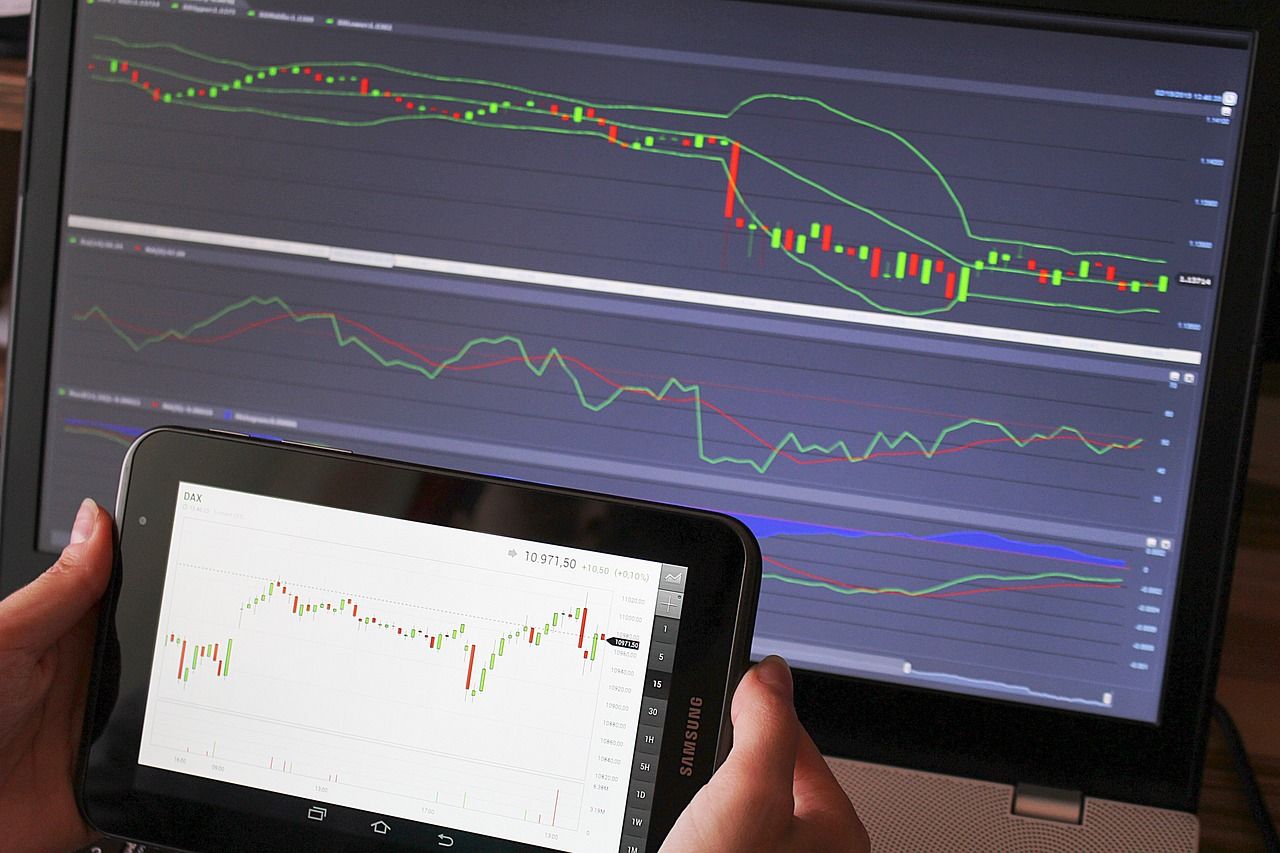

Key Takeaways
-
A Golden Cross occurs when the 50-day moving average crosses above the 200-day moving average.
-
It is considered a bullish signal that may indicate the beginning of an upward trend.
-
A Golden Cross does not guarantee that stock prices will rise, as it can also produce false signals. Hence, traders should use other technical indicators, too and follow proper risk management before making trading decisions.
In the world of financial markets, patterns are formed by the price movements of a security over a certain period and are visually represented on charts. These chart patterns are recognisable formations that may indicate a possible trend reversal, a continuation of the existing trend, or the beginning of a new trend. These patterns are used by traders and analysts in technical analysis to help make informed decisions about purchasing or selling assets.
What Is the Golden Cross Pattern?
The Golden Cross is a technical analysis pattern that occurs when a short-term moving average crosses above a long-term moving average. Traders and investors closely monitor the Golden Cross because it is considered a potential bullish signal that may indicate an upward price trend.
How does the Golden Cross pattern work?
We shall examine the elements of a golden cross pattern to get a good grasp on the topic. Some of the major elements of a golden cross pattern are:
Moving Averages
The Golden Cross involves two moving averages — a short-term moving average, commonly the 50-day moving average, and a long-term moving average, commonly the 200-day moving average.
Moving averages are calculated using prices over a specified period. A simple moving average (SMA) uses the average closing price, while an exponential moving average (EMA) gives more importance to recent prices
Signal Generation
A Golden Cross occurs when the short-term moving average crosses above the long-term moving average. Traders commonly identify this pattern when the 50-day moving average crosses above the 200-day moving average.
Bullish Signal
The Golden Cross is considered a bullish signal because it may indicate a possible reversal from a downtrend to an uptrend. It shows that the average price over the short term has crossed above the average price over the long term.
Strength of the Signal
Traders often look at price movements and trading volume to assess the strength of a Golden Cross signal. A strong upward price movement with higher trading volume may provide additional support for the signal.
Confirmation
The Golden Cross is not a guaranteed signal of an upward trend. It is a lagging indicator based on past prices. Traders often use other technical indicators and chart patterns to get additional confirmation before making trading decisions.
Application
Traders use the Golden Cross to help decide when to buy. It may signal that prices could start rising.
However, the Golden Cross does not always give the right signal. Prices may still fall or move sideways. So, traders should check other market signals before buying.
The Death Cross is the opposite of the Golden Cross. It happens when the short-term moving average crosses below the long-term moving average. It may signal that prices could fall. Traders use both patterns to understand possible changes in market trends.
Golden Cross Example
In a hypothetical example, the 50-day and 200-day moving averages were initially moving down. Later, prices started rising, and the 50-day moving average also moved up.
When the 50-day moving average crossed above the 200-day moving average, it formed a Golden Cross. This may signal a possible upward trend.
During this period, suppose most candlesticks closed higher than they opened, showing buying pressure within those sessions.

The Golden Cross is a useful technical analysis pattern that helps traders identify a possible upward trend in the market. It occurs when the 50-day moving average crosses above the 200-day moving average. However, it does not guarantee that prices will continue to rise.
Traders are recommended to use other technical indicators, study market conditions and follow proper risk management before making trading decisions.
FAQs
What is a Golden Cross pattern?
A Golden Cross is a technical analysis pattern that occurs when the 50-day moving average crosses above the 200-day moving average, indicating a possible upward trend.
Is the Golden Cross a bullish or bearish signal?
The Golden Cross is considered a bullish signal, as it may indicate a possible rise in prices.
Does the Golden Cross guarantee a rise in stock prices?
No, a Golden Cross does not guarantee higher prices. It is a potential signal, and prices may still fall after it appears.
What is the difference between a Golden Cross and a Death Cross?
A Golden Cross occurs when the short-term moving average crosses above the long-term moving average, while a Death Cross occurs when it crosses below.
About Author
Mariyam Sara
Sub-Editor

holds an MBA in Finance and is a true Finance Fanatic. She writes extensively on all things finance whether it’s stock trading, personal finance, or insurance, chances are she’s covered it. When she’s not writing, she’s busy pursuing NISM certifications, experimenting with new baking recipes.
Read more from Mariyam





















Upstox is a leading Indian financial services company that offers online trading and investment services in stocks, commodities, currencies, mutual funds, and more. Founded in 2009 and headquartered in Mumbai, Upstox is backed by prominent investors including Ratan Tata, Tiger Global, and Kalaari Capital. It operates under RKSV Securities and is registered with SEBI, NSE, BSE, and other regulatory bodies, ensuring secure and compliant trading experiences.
Related articles

Share Market
What are DVR Shares and Why Do Companies Issue Them?7 min read | Written by Subhasish Mandal

Share Market
Ready-Made or DIY Screener? Two Ways to Explore the Market5 min read | Written by Sachin Gupta

Share Market
Understanding Markets in Real Time: Inside Live Market Analysis Sessions4 min read | Written by Sachin Gupta

Share Market
Why Market Buzz Fails and How to Track Real Stock Signals?9 min read | Written by Bidita Sen
Share Market
What Is a Market Correction? Meaning, Causes, and Strategy15 min read | Written by Bidita Sen

Share Market
Cyclical vs Defensive Stocks: Differences, Examples and Strategy15 min read | Written by Bidita Sen

Share Market
What is Efficiency Ratio: Meaning, Types, Formula and More12 min read | Written by Sachin Gupta