Logo

Tata Consumer Products Share Price

NSE: TATACONSUM
|
Tea/Coffee
₹ 1,116.70
+₹9.50 (0.86%)
1D
Last updated 03 Jul, 2026, 15:55 IST

Tata Consumer Products Share Price Today

As of 5 Jul 2026, Tata Consumer Products share price is ₹1,116.70. The stock opened at ₹1,115.30, compared to its previous close of ₹1,107.20. During today's trading session, Tata Consumer Products share price moved in the range of ₹1,096.30 to ₹1,124.70, with an average price of ₹1,110.50 for the day. Looking at its last 52-week, the stock has touched a low of ₹1,007.20 and a high of ₹1,282.70. On the performance front, Tata Consumer Products share price has declined by 4.61% over the last six months and is up 2.51% on a year-on-year basis.


₹1,096.30
0.86% up today
₹1,124.70
1D LOW
1D HIGH

Tata Consumer Products Returns Calculator

Open
₹1,115.30
High
₹1,124.70
Low
₹1,096.30
Prev. close
₹1,107.20

Circuit
L
H
₹1,005.10
₹1,228.30
52-week
L
H
₹1,007.20
₹1,282.70

Tata Consumer Products Shareholder Returns

Tata Consumer Products Share Price History

Mkt Cap Cr
1,09,613.00

P/E
65.07

P/B
4.61

ROE
7.84%

D/E
0.03

ROCE
9.15%

Div. Yield
0.99%

EPS(TTM)
16.52
Turnover
0.77

EV/EBITDA
33.98

Net Margin
11.12%

Op. Margin
16.10%

ROA
5.59%

Quick Ratio
0.86

Curr. Ratio
1.01
Based on fundamentals, this stock's
Step 1 of 5
Performance
Very Poor
Tata Consumer has not beaten FD return of 7%
Step 1 of 5
Valuation
Overvalued
Tata Consumer appears overvalued compared to its peers
Step 5 of 5
Earnings
Excellent
Tata Consumer revenue, operating profit and net profit are growing
Peer Comparison
Peer comparison — key ratios
NameMkt Cap CrP/EP/BROED/EROCEBook ValueDiv. YieldTurnoverEPS(TTM)
CCL Products15,838.4040.826.7616.55%0.4516.07%103.130.48%1.4821.56
Pix Transmissions2,499.3323.383.5915.34%0.0420.41%466.630.49%0.7767.58
TINNA RUBBER AND INFR LTD1,724.3832.635.7417.59%0.4419.28%162.700.34%1.5229.90
GRP986.69306.305.532.12%1.046.28%361.280.19%1.9316.74
McLeod Russel India611.48-4.950.00-43.86%-10.29-4.42%-35.480.00%1.27-8.70
International Conveyors503.877.371.1916.11%0.1819.40%66.430.63%0.4410.72
RUBFILA INTERNATIONAL LTD392.2514.751.268.57%0.0011.95%53.572.77%1.625.01
Harrison Malayalam368.3712.652.0616.31%0.6214.42%96.800.00%1.8715.80
GAYATRI RUBB AND CHEM LTD334.750.000.000.00%2.069.74
Jayshree Tea & Industries246.06-9.820.62-6.33%1.091.12%131.750.00%2.05-7.56

Tata Consumer Products Financials

Full statement

Income Statement · Consolidated

Income Statement · Consolidated — all values in INR Crore
ParticularsMar 2026Mar 2025Mar 2024Mar 2023
Revenue₹20,290.43₹17,618.30₹15,205.85₹13,783.16
Other Income₹164.75₹193.25₹245.62₹168.88
Total Revenue₹20,455.18₹17,811.55₹15,451.47₹13,952.04
Total Expenses₹18,262.34₹16,029.89₹13,428.71₹12,317.93
Profit Before Tax₹2,172.78₹1,776.55₹1,695.72₹1,793.56
Tax₹535.28₹396.24₹394.73₹447.04
Profit After Tax₹1,637.50₹1,380.31₹1,300.99₹1,346.52
EPS - Basic₹15.59₹13.06₹12.20₹13.02
EPS - Diluted₹15.58₹13.06₹12.20₹13.02

Cash Flow · Consolidated

Cash Flow · Consolidated — all values in INR Crore
ParticularsMar 2026Mar 2025Mar 2024Mar 2023
Profit before tax₹2,172.78₹1,776.55₹1,695.72₹1,793.56
Income before WC changes₹2,839.97₹2,513.68₹2,323.14₹1,875.37
Change in Assets-₹91.04-₹698.74-₹48.41-₹404.04
Change in Liabilities₹236.23₹703.51₹59.77₹378.61
Change in WC₹145.19₹4.77₹11.36-₹25.43
Cash flow from Operations₹2,421.85₹2,056.65₹1,936.68₹1,461.29
Cash flow from Investing-₹1,398.17-₹2,353.63-₹1,930.92-₹827.82
Cash flow from Financing-₹1,075.39₹452.70₹255.55-₹714.40
Total Cash Flow-₹51.71₹155.72₹261.31-₹80.93
Cash (Start of the year)₹1,377.72₹1,171.85₹890.39₹977.11
Cash (End of the year)₹1,412.79₹1,377.72₹1,171.85₹890.39

Balance Sheet · Consolidated

Balance Sheet · Consolidated — all values in INR Crore
ParticularsMar 2026Mar 2025Mar 2024Mar 2023
Non-Current Assets₹24,135.87₹23,008.03₹20,594.31₹14,502.55
Current Assets₹10,317.09₹8,969.65₹7,426.63₹8,308.58
Total Assets₹34,452.96₹31,977.68₹28,020.94₹22,811.13
Current Liabilities₹6,578.56₹5,841.10₹6,191.09₹3,924.68
Net Current Asset₹3,738.53₹3,128.55₹1,235.54₹4,383.90
Non-Current Liabilities₹4,685.54₹4,746.28₹4,393.72₹1,759.57
Equity Capital₹23,188.86₹21,390.30₹17,436.13₹17,126.88
Total Equity & Liabilities₹34,452.96₹31,977.68₹28,020.94₹22,811.13

Income Statement · Standalone

Income Statement · Standalone — all values in INR Crore
ParticularsMar 2026Mar 2025Mar 2024Mar 2023
Revenue₹14,700.05₹12,801.85₹10,708.86₹9,045.91
Other Income₹549.05₹457.10₹229.21₹185.13
Total Revenue₹15,249.10₹13,258.95₹10,938.07₹9,231.04
Total Expenses₹13,186.34₹11,811.11₹9,401.15₹7,851.36
Profit Before Tax₹2,046.59₹1,503.24₹1,335.03₹1,487.63
Tax₹411.44₹248.49₹380.32₹367.70
Profit After Tax₹1,635.15₹1,254.75₹954.71₹1,119.93
EPS - Basic₹16.52₹12.82₹9.92₹11.81
EPS - Diluted₹16.51₹12.82₹9.92₹11.81

Cash Flow · Standalone

Cash Flow · Standalone — all values in INR Crore
ParticularsMar 2026Mar 2025Mar 2024Mar 2023
Profit before tax₹2,046.59₹1,503.24₹1,335.03₹1,487.63
Income before WC changes₹1,851.96₹1,423.37₹1,608.96₹1,391.70
Change in Assets-₹65.61-₹581.52-₹109.51-₹315.12
Change in Liabilities₹101.57₹715.32₹142.96₹219.36
Change in WC₹35.96₹133.80₹33.45-₹95.76
Cash flow from Operations₹1,451.49₹1,274.11₹1,346.03₹1,000.71
Cash flow from Investing-₹517.59-₹1,844.66-₹1,914.12-₹584.72
Cash flow from Financing-₹833.83₹711.26₹393.98-₹561.89
Total Cash Flow₹100.07₹140.71-₹174.11-₹145.90
Cash (Start of the year)₹225.38₹84.67₹258.78₹333.95
Cash (End of the year)₹325.45₹225.38₹84.67₹188.05

Balance Sheet · Standalone

Balance Sheet · Standalone — all values in INR Crore
ParticularsMar 2026Mar 2025Mar 2024Mar 2023
Non-Current Assets₹17,563.01₹17,323.40₹15,104.72₹11,392.71
Current Assets₹5,066.89₹4,171.17₹3,335.99₹5,074.68
Total Assets₹22,629.90₹21,494.57₹18,440.71₹16,467.39
Current Liabilities₹3,625.06₹3,259.78₹3,788.77₹2,060.77
Net Current Asset₹1,441.83₹911.39-₹452.78₹3,013.91
Non-Current Liabilities₹1,200.03₹1,224.83₹1,158.53₹1,028.47
Equity Capital₹17,804.81₹17,009.96₹13,493.41₹13,378.15
Total Equity & Liabilities₹22,629.90₹21,494.57₹18,440.71₹16,467.39
* All values are in INR Crore
Qty
Bid
0
0
0
0
0
0
0
0
0
0
Ask
Qty
1116.7
1459
0
0
0
0
0
0
0
0
Bid Total: 0
Ask Total: 1459
Buy orders: 0%
Sell orders: 100%
Bearish
3
Neutral
5
Bullish
0
Slightly Bearish
by SEBI experts
Expert Pick
EXPPICK
Stop-loss
Entry price
Target
Indicator
Value
Verdict

RSI (14)
48.34
Neutral

ATR (14)
26.66
Neutral

STOCH(9,6)
66.49
Neutral

STOCH RSI (14)
91.53
Bearish

ADX(9)
21.91
Bearish

UO(9)
51.44
Neutral

ROC(12)
-1.26
Bearish

WillR(14)
-33.51
Neutral
Period
Simple value
Exponential vaue

5D
1100.64
1106.19

10D
1106.08
1107.46

20D
1109.48
1116.84

50D
1154.98
1131.69

100D
1130.79
1137.75

About Tata Consumer Products

Tata Consumer Products logo
ISIN
INE192A01025
Sector Market Cap
₹ 1,09,613 Cr

Tata Consumer Products, formerly known as Tata Global Beverages Limited (TGBL), is a fast-moving consumer goods company. It is part of the Tata Group. Tata Consumer Products came into being following the merger of the consumer products business of Tata Chemicals with Tata Global Beverages.

The market capitalisation of Tata Consumer Products Limited is over ₹1,04,000 crore as of January 5, 2024. Tata Consumer Products share price has gained over 84% in three years.

Business Operations

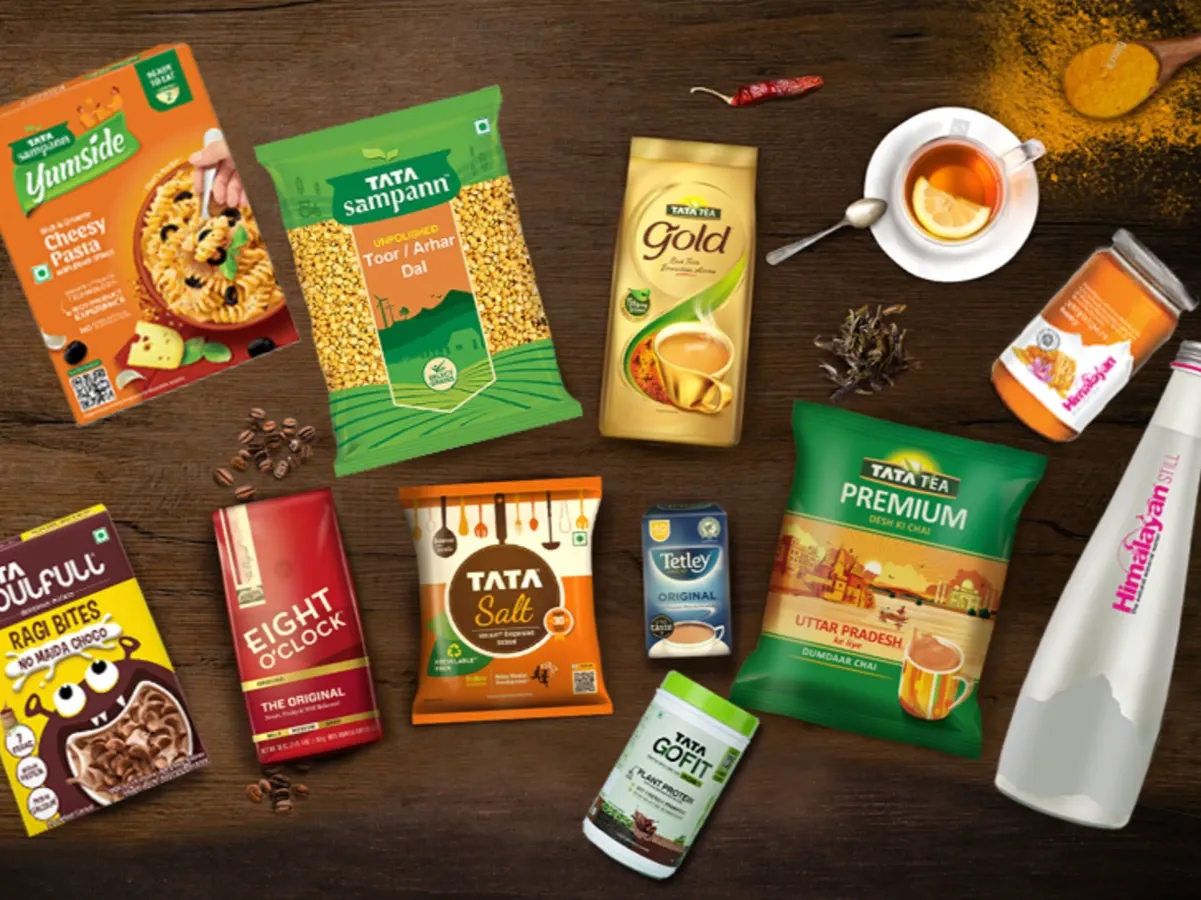
Tata Consumer Products has a broad lineup of brands. Some of the popular ones are Tata Salt, Tata Tea, Tetley, Kanan Devan, Chakra Gold, Eight O’Clock Coffee, Himalayan Water and Gemini.

Tetley has unique products for each country. This brand offers a variety that includes black, green, fruit and herbal teas. Its market includes Australia, the Middle East, West Asia, North Africa, Poland, Russia and Kazakhstan.

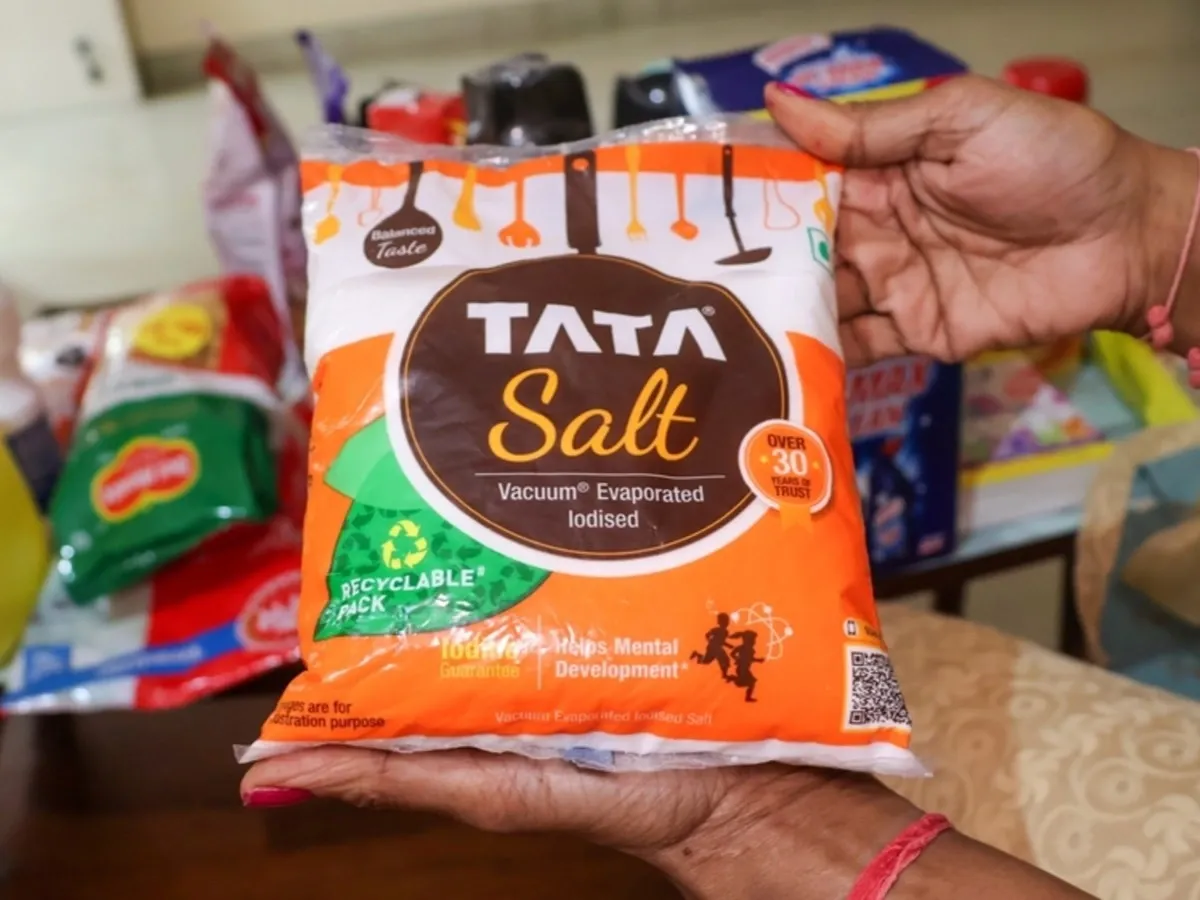
The iconic Tata Salt is one of the country’s most trusted brands. Tata Soulfull, a brand under Tata Consumer Products Ltd's subsidiary Tata Consumer Soulfull, was founded in 2013. The brand focuses on health and wellness in the food segment. Its products include millet-based cereals and snacks designed for both children and adults.

Another subsidiary Tata Smartfoodz Ltd, which has the brand name Tata Q, introduced in 2029, operates in the ready-to-eat food market. Its innovative range comprises wholesome and convenient meals and snacks. NourishCo, a wholly owned subsidiary, specialises in producing non-carbonated ready-to-drink beverages that prioritise health.

Among its products are Tata Copper Plus Water, India's first nutrient water, and Tata Gluco Plus, a glucose-based flavoured drink. NourishCo also handles the marketing and distribution of Himalayan water.

Tata Consumer Products has expanded significantly over the years. Its notable venture is the joint partnership with Starbucks, known as Tata Starbucks Limited, which operates and owns Starbucks cafes across India. It started in Mumbai in October 2012, and this 50:50 joint venture has now expanded to 26 cities.

The company has solidified its global footprint in markets like the UK, US and Canada. Its core tea brands, including Tetley, Good Earth and Teapigs are at the forefront in these markets.

Tata Consumer Products has a global branded workforce of over 3,900 individuals. With a presence in 119 locations worldwide, including manufacturing units, corporate offices and dedicated third-party units, the company operates three world-class R&D facilities.

Tata Consumer Products; chain is aided by around 1.5 million outlets, contributing to a total reach of 3.8 million outlets, and collaborations with over 11,000 distribution partners (retailers and D2C networks).

The company reaches over 200 million households across India. Almost 24% of its innovations centre around health and wellness. It has successfully launched 34 new products across India and various other regions.

Tata Consumer Products Financial Highlights

  • Revenue: Tata Consumer Products reported revenue of ₹20,455.18 crore in FY26 vs ₹17,811.55 crore in FY25. It showed an increase of 14.84% on a yearly basis.
  • Operating Profit: Tata Consumer Products reported an operating profit of ₹2,172.78 crore in FY26 vs ₹1,776.55 crore in FY25. It showed an increase of 22.30% on a year-on-year basis.
  • Net Profit: Tata Consumer Products reported a net profit of ₹1,637.50 crore in FY26 vs ₹1,380.31 crore in FY25. It showed an increase of 18.63% on a yearly basis.

Tata Consumer Products Quarterly Result Highlights

  • Tata Consumer Products reported revenue of ₹5,486.18 crore in Mar 2026, compared with ₹5,145.01 crore in Dec 2025, representing an increase of 6.63% on a quarter-on-quarter (QoQ) basis.
  • Tata Consumer Products reported an operating profit of ₹644.17 crore in Mar 2026, compared with ₹539.91 crore in Dec 2025, representing an increase of 19.31% on a quarter-on-quarter (QoQ) basis.
  • Tata Consumer Products reported a profit of ₹491.22 crore in Mar 2026, compared with ₹402.79 crore in Dec 2025, reflecting an increase of 21.95% on a QoQ basis.
  • The earnings per share (EPS) of Tata Consumer Products stood at ₹15.59 during Mar 2026.
Know more
Promoters
33.83%
FII
20.79%
Other DII
15.18%
Retail and other
21.19%
Mutual funds
9.00%
Foreign institutions - FII
Compare against other stocks
Tata Consumer Products logo
Tata Consumer Products
Tea/Coffee
Add Stock
Add Another

FAQs on Tata Consumer Products Share Price