Logo

Marico Share Price

NSE: MARICO
|
Consumer Food
₹ 838.55
-₹17.45 (-2.04%)
1D
Last updated 03 Jul, 2026, 15:59 IST

Marico Share Price Today

As of 5 Jul 2026, Marico share price is ₹838.55. The stock opened at ₹873.00, compared to its previous close of ₹856.00. During today's trading session, Marico share price moved in the range of ₹835.10 to ₹873.00, with an average price of ₹854.05 for the day. Looking at its last 52-week, the stock has touched a low of ₹690.20 and a high of ₹873.00. On the performance front, Marico share price has increased by 10.66% over the last six months and is up 17.55% on a year-on-year basis.


₹835.10
2.04% down today
₹873.00
1D LOW
1D HIGH

Marico Returns Calculator

Open
₹873.00
High
₹873.00
Low
₹835.10
Prev. close
₹856.00

Circuit
L
H
₹754.70
₹922.40
52-week
L
H
₹690.20
₹873.00

Marico Shareholder Returns

Marico Share Price History

Mkt Cap Cr
1,11,174.00

P/E
61.34

P/B
26.41

ROE
41.85%

D/E
0.03

ROCE
40.56%

Div. Yield
0.47%

EPS(TTM)
15.00
Turnover
1.59

EV/EBITDA
43.66

Net Margin
0.00%

Op. Margin
0.00%

ROA
18.00%

Quick Ratio
0.00

Curr. Ratio
2.74
Based on fundamentals, this stock's
Step 2 of 5
Performance
Poor
Marico has underperformed the market
Step 1 of 5
Valuation
Overvalued
Marico appears overvalued compared to its peers
Step 3 of 5
Earnings
Neutral
Marico earnings growth is positive
Peer Comparison
Peer comparison — key ratios
NameMkt Cap CrP/EP/BROED/EROCEBook ValueDiv. YieldTurnoverEPS(TTM)
Hindustan Unilever5,19,424.0032.129.9131.07%0.0325.43%9.811.99%0.9765.66
Nestle India2,78,882.0064.7343.9376.34%0.1756.47%42.671.02%2.6818.38
Varun Beverages1,72,641.0052.658.5915.51%0.0219.85%53.420.21%0.687.91
Britannia Industries1,29,450.0051.0225.3549.61%0.2951.85%192.691.68%3.62106.35
Godrej Consumer Products1,10,234.0059.228.7114.71%0.3817.09%76.661.86%1.0914.81
LENSKART SOLUTIONS LTD92,343.50184.4110.575.65%0.207.00%52.450.00%0.492.80
Dabur India79,251.3042.436.9416.59%0.0820.18%42.431.85%1.208.41
Colgate Palmolive9,183.4023.6827.81158.62%0.03179.72%58.242.33%3.5948.73
PATANJALI FOODS LIMITED45,064.0024.833.4415.37%0.2110.59%120.370.84%3.0516.69
P&G Hygiene & Health28,858.2033.6938.30113.67%0.00155.91%232.122.87%4.93263.86

Marico Financials

Full statement

Income Statement · Consolidated

Income Statement · Consolidated — all values in INR Crore
ParticularsMar 2025Mar 2024Mar 2023Mar 2022
Revenue₹10,831.00₹9,653.00₹9,764.00₹9,512.00
Other Income₹208.00₹142.00₹144.00₹98.00
Total Revenue₹11,039.00₹9,795.00₹9,908.00₹9,610.00
Total Expenses₹8,923.00₹7,858.00₹8,165.00₹8,009.00
Profit Before Tax₹2,116.00₹1,937.00₹1,743.00₹1,601.00
Tax₹458.00₹435.00₹421.00₹346.00
Profit After Tax₹1,658.00₹1,502.00₹1,322.00₹1,255.00
EPS - Basic₹12.59₹11.46₹10.08₹9.50
EPS - Diluted₹12.56₹11.43₹10.05₹9.49

Cash Flow · Consolidated

Cash Flow · Consolidated — all values in INR Crore
ParticularsMar 2025Mar 2024Mar 2023Mar 2022
Profit before tax₹2,116.00₹1,937.00₹1,743.00₹1,601.00
Income before WC changes₹2,219.00₹2,040.00₹1,847.00₹1,709.00
Change in Assets-₹135.00-₹299.00-₹172.00-₹543.00
Change in Liabilities-₹158.00₹73.00₹113.00₹201.00
Change in WC-₹293.00-₹226.00-₹59.00-₹342.00
Cash flow from Operations₹1,363.00₹1,387.00₹1,419.00₹1,016.00
Cash flow from Investing-₹621.00₹176.00-₹865.00₹425.00
Cash flow from Financing-₹649.00-₹1,542.00-₹560.00-₹1,290.00
Total Cash Flow₹93.00₹21.00-₹69.00₹153.00
Cash (Start of the year)₹228.00₹207.00₹276.00₹109.00
Cash (End of the year)₹321.00₹228.00₹207.00₹276.00

Balance Sheet · Consolidated

Balance Sheet · Consolidated — all values in INR Crore
ParticularsMar 2025Mar 2024Mar 2023Mar 2022
Non-Current Assets₹3,255.00₹3,418.00₹3,126.00₹2,281.00
Current Assets₹5,083.00₹4,003.00₹3,820.00₹3,505.00
Total Assets₹8,338.00₹7,421.00₹6,946.00₹5,786.00
Current Liabilities₹2,461.00₹2,444.00₹2,429.00₹2,153.00
Net Current Asset₹2,622.00₹1,559.00₹1,391.00₹1,352.00
Non-Current Liabilities₹1,611.00₹808.00₹561.00₹228.00
Equity Capital₹4,266.00₹4,169.00₹3,956.00₹3,405.00
Total Equity & Liabilities₹8,338.00₹7,421.00₹6,946.00₹5,786.00

Income Statement · Standalone

Income Statement · Standalone — all values in INR Crore
ParticularsMar 2025Mar 2024Mar 2023Mar 2022
Revenue₹7,581.00₹7,002.00₹7,478.00₹7,500.00
Other Income₹591.00₹135.00₹328.00₹357.00
Total Revenue₹8,172.00₹7,137.00₹7,806.00₹7,857.00
Total Expenses₹6,278.00₹5,735.00₹6,314.00₹6,444.00
Profit Before Tax₹1,894.00₹1,402.00₹1,492.00₹1,413.00
Tax₹353.00₹324.00₹313.00₹250.00
Profit After Tax₹1,541.00₹1,078.00₹1,179.00₹1,163.00
EPS - Basic₹11.91₹8.34₹9.13₹9.02
EPS - Diluted₹11.88₹8.32₹9.10₹9.01

Cash Flow · Standalone

Cash Flow · Standalone — all values in INR Crore
ParticularsMar 2025Mar 2024Mar 2023Mar 2022
Profit before tax₹1,894.00₹1,402.00₹1,492.00₹1,413.00
Income before WC changes₹1,535.00₹1,457.00₹1,353.00₹1,236.00
Change in Assets₹91.00-₹50.00-₹83.00-₹463.00
Change in Liabilities-₹130.00-₹110.00-₹10.00₹136.00
Change in WC-₹39.00-₹160.00-₹93.00-₹327.00
Cash flow from Operations₹1,148.00₹1,044.00₹1,002.00₹656.00
Cash flow from Investing-₹681.00₹167.00-₹346.00₹626.00
Cash flow from Financing-₹455.00-₹1,194.00-₹676.00-₹1,267.00
Total Cash Flow₹12.00₹17.00-₹20.00₹15.00
Cash (Start of the year)₹28.00₹11.00₹31.00₹16.00
Cash (End of the year)₹40.00₹28.00₹11.00₹31.00

Balance Sheet · Standalone

Balance Sheet · Standalone — all values in INR Crore
ParticularsMar 2025Mar 2024Mar 2023Mar 2022
Non-Current Assets₹2,445.00₹2,395.00₹2,215.00₹1,692.00
Current Assets₹3,593.00₹2,570.00₹2,874.00₹2,804.00
Total Assets₹6,038.00₹4,965.00₹5,089.00₹4,496.00
Current Liabilities₹1,152.00₹1,277.00₹1,321.00₹1,358.00
Net Current Asset₹2,441.00₹1,293.00₹1,553.00₹1,446.00
Non-Current Liabilities₹123.00₹91.00₹91.00₹89.00
Equity Capital₹4,763.00₹3,597.00₹3,677.00₹3,049.00
Total Equity & Liabilities₹6,038.00₹4,965.00₹5,089.00₹4,496.00
* All values are in INR Crore
Qty
Bid
0
0
0
0
0
0
0
0
0
0
Ask
Qty
838.55
4164
0
0
0
0
0
0
0
0
Bid Total: 0
Ask Total: 4164
Buy orders: 0%
Sell orders: 100%
Bearish
1
Neutral
6
Bullish
1
Neutral
by SEBI experts
Expert Pick
EXPPICK
Stop-loss
Entry price
Target
Indicator
Value
Verdict

RSI (14)
57.15
Neutral

ATR (14)
18.58
Neutral

STOCH(9,6)
47.8
Neutral

STOCH RSI (14)
51.53
Neutral

ADX(9)
40.22
Bearish

UO(9)
50.33
Neutral

ROC(12)
3.72
Bullish

WillR(14)
-44.74
Neutral
Period
Simple value
Exponential vaue

5D
844.35
841.71

10D
831.75
834.93

20D
822.2
827.54

50D
817.33
813.46

100D
790.45
794.9

About Marico

Marico logo
ISIN
INE196A01026
Sector Market Cap
₹ 1,11,174 Cr

Marico Limited is involved in the trade of branded consumer goods and services. Founded in 1990, it is headquartered in Mumbai.

As of March 31, 2023, close to 59% of shares of the company are owned by the promoters, whereas the FIIs, DIIs and public hold 25%, 10% and 6% shares in the company respectively.

The market capitalisation of Marico Limited is over ₹68,500 crore as of January 11, 2024. Marico share price has gained over 23% in the last three years.

Business operations

Marico Limited operates across two segments: Consumer Products and Others. The consumer products segment includes items such as coconut oils, various edible oils, hair oils, male grooming products, fabric care products, healthy foods, soaps, health care products and female beauty care products.

The Others segment primarily focuses on skin care. Marico Limited has more than 20 brands, showcasing a diverse and expansive portfolio.

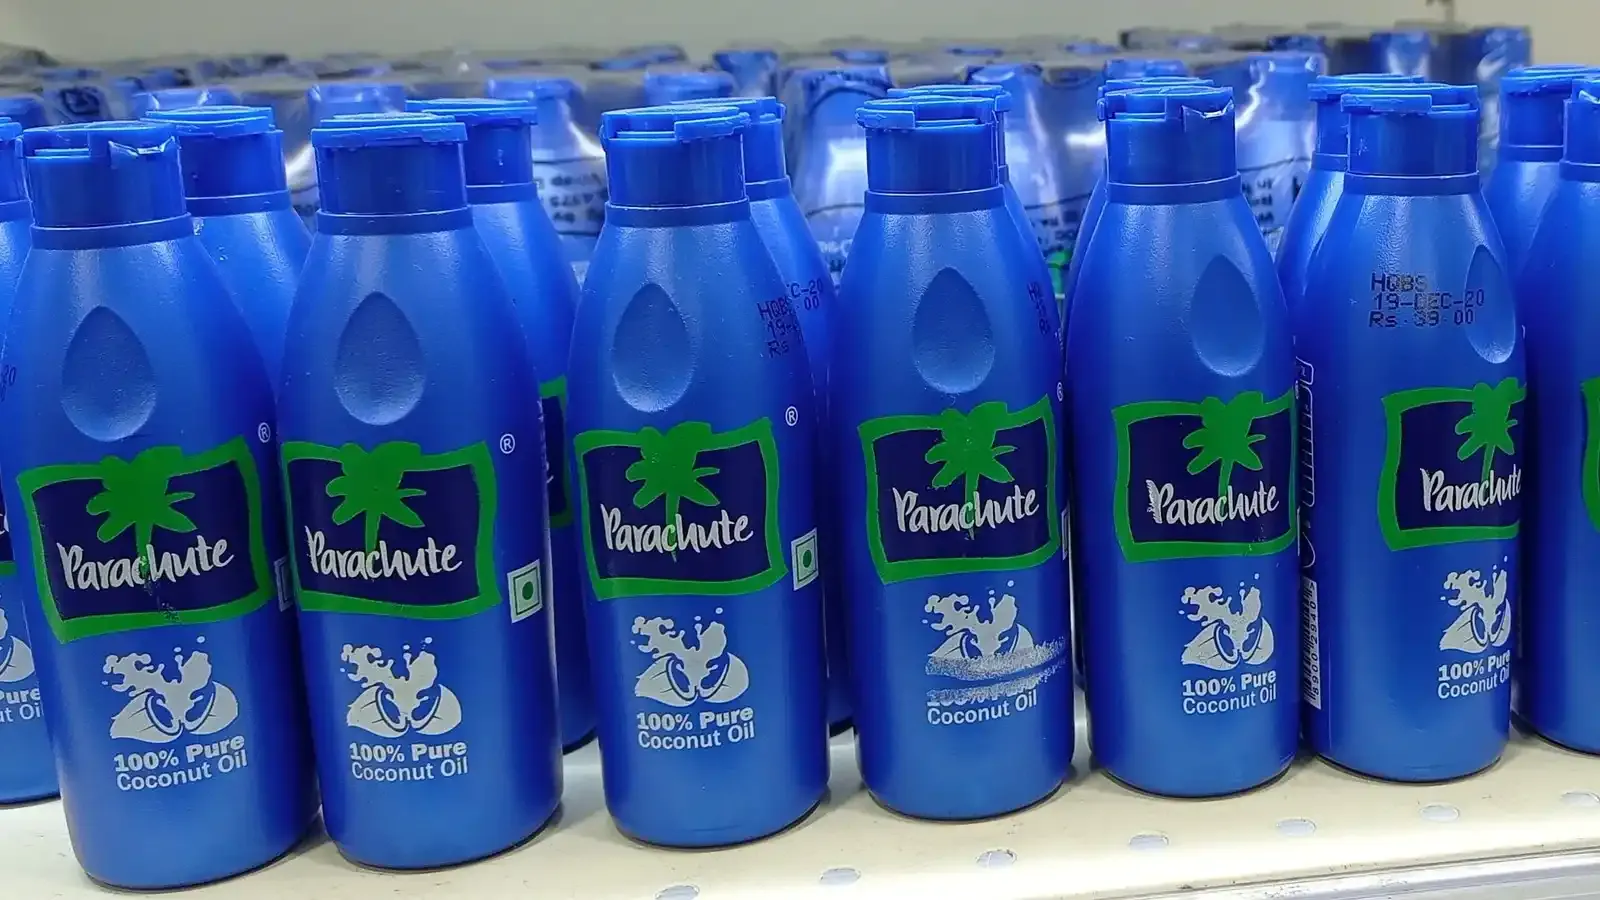
In India, the company manufactures and markets products under well-known brands including Parachute, Nihar and Saffola. Internationally, its portfolio has brands such as Fiancee, HairCode, Camelia and Caivil. In its skincare solutions business, the company operates under the brand name Kaya in both the Indian and international markets and under the brand Derma Rx in Singapore and Malaysia.

Marico Limited has a distribution network comprising over 7,500 distributors. It has a reach of more than 5.6 million retail outlets across both urban and rural India. The company holds a significant presence in key modern trade chains and e-commerce platforms.

This extensive network enables Marico to connect with over 59,000 villages in India and virtually every town with a population exceeding 5,000. The distribution channel is supported by six manufacturing plants, 25 warehouses and four redistribution centres.

Domestically, the company operates seven plants and five offices, totalling12 locations. The factories in India are situated in Puducherry, Tamil Nadu’s Perundurai, Baddi in Himachal Pradesh, Guwahati in Assam, Jalgaon and Sanand in Maharashtra. On the international front, Marico’s footprint extends to six plants and 10 offices, totalling 16 locations globally. In terms of market coverage, Marico serves all states and Union Territories within India. Internationally, the company reaches customers in 49 different countries.

Marico’s markets include regions such as South and Sub-Saharan Africa, the Middle East and North Africa, South East Asia and South Asia. In South and Sub-Saharan Africa, Marico has a notable presence in South Africa. The company has also established its footprint in the Middle East with operations in Egypt and other Middle Eastern countries. In Southeast Asia, Marico extends its reach to Vietnam and Myanmar. It has a strong presence in Bangladesh within the South Asian region, apart from India.

In the fiscal year 2023, Marico had a sale of over 2 billion packs. The company witnessed 11 patents granted and the introduction of 14 new products during this period.

Marico Financial Highlights

  • Revenue: Marico reported revenue of ₹13,815.00 crore in FY26 vs ₹11,039.00 crore in FY25. It showed an increase of 25.15% on a yearly basis.
  • Operating Profit: Marico reported an operating profit of ₹2,277.00 crore in FY26 vs ₹2,116.00 crore in FY25. It showed an increase of 7.61% on a year-on-year basis.
  • Net Profit: Marico reported a net profit of ₹1,813.00 crore in FY26 vs ₹1,658.00 crore in FY25. It showed an increase of 9.35% on a yearly basis.

Marico Quarterly Result Highlights

  • Marico reported revenue of ₹3,393.00 crore in Mar 2026, compared with ₹3,576.00 crore in Dec 2025, representing a decrease of 5.12% on a quarter-on-quarter (QoQ) basis.
  • Marico reported an operating profit of ₹504.00 crore in Mar 2026, compared with ₹567.00 crore in Dec 2025, representing a decrease of 11.11% on a quarter-on-quarter (QoQ) basis.
  • Marico reported a profit of ₹408.00 crore in Mar 2026, compared with ₹460.00 crore in Dec 2025, reflecting a decrease of 11.30% on a QoQ basis.
  • The earnings per share (EPS) of Marico stood at ₹12.59 during Mar 2026.
Know more
Promoters
58.93%
FII
24.08%
Other DII
3.67%
Retail and other
4.69%
Mutual funds
8.63%
Foreign institutions - FII
Compare against other stocks
Marico logo
Marico
Consumer Food
Add Stock
Add Another

FAQs on Marico Share Price