Logo

Godrej Consumer Products Share Price

NSE: GODREJCP
|
Household Products
₹ 1,076.90
-₹0.30 (-0.03%)
1D
Last updated 03 Jul, 2026, 15:44 IST

Godrej Consumer Products Share Price Today

As of 5 Jul 2026, Godrej Consumer Products share price is ₹1,076.90. The stock opened at ₹1,079.00, compared to its previous close of ₹1,077.20. During today's trading session, Godrej Consumer Products share price moved in the range of ₹1,071.10 to ₹1,098.50, with an average price of ₹1,084.80 for the day. Looking at its last 52-week, the stock has touched a low of ₹967.05 and a high of ₹1,309.00. On the performance front, Godrej Consumer Products share price has declined by 12.82% over the last six months and is down 8.05% on a year-on-year basis.


₹1,071.10
0.03% down today
₹1,098.50
1D LOW
1D HIGH

Godrej Consumer Products Returns Calculator

Open
₹1,079.00
High
₹1,098.50
Low
₹1,071.10
Prev. close
₹1,077.20

Circuit
L
H
₹969.30
₹1,184.50
52-week
L
H
₹967.05
₹1,309.00

Godrej Consumer Products Shareholder Returns

Godrej Consumer Products Share Price History

Mkt Cap Cr
1,10,234.00

P/E
59.22

P/B
8.71

ROE
14.71%

D/E
0.38

ROCE
17.09%

Div. Yield
1.86%

EPS(TTM)
14.81
Turnover
1.09

EV/EBITDA
34.55

Net Margin
0.00%

Op. Margin
0.00%

ROA
8.73%

Quick Ratio
0.00

Curr. Ratio
1.52
Based on fundamentals, this stock's
Step 5 of 5
Performance
Excellent
Godrej Consumer outperforming all market indices
Step 1 of 5
Valuation
Overvalued
Godrej Consumer appears overvalued compared to its peers
Step 3 of 5
Earnings
Neutral
Godrej Consumer earnings growth is positive
Peer Comparison
Peer comparison — key ratios
NameMkt Cap CrP/EP/BROED/EROCEBook ValueDiv. YieldTurnoverEPS(TTM)
Hindustan Unilever5,19,424.0032.129.9131.07%0.0325.43%9.811.99%0.9765.66
Nestle India2,78,882.0064.7343.9376.34%0.1756.47%42.671.02%2.6818.38
Varun Beverages1,72,641.0052.658.5915.51%0.0219.85%53.420.21%0.687.91
Britannia Industries1,29,450.0051.0225.3549.61%0.2951.85%192.691.68%3.62106.35
Marico1,11,174.0061.3426.4141.85%0.0340.56%44.730.47%1.5915.00
LENSKART SOLUTIONS LTD92,343.50184.4110.575.65%0.207.00%52.450.00%0.492.80
Dabur India79,251.3042.436.9416.59%0.0820.18%42.431.85%1.208.41
Colgate Palmolive9,183.4023.6827.81158.62%0.03179.72%58.242.33%3.5948.73
PATANJALI FOODS LIMITED45,064.0024.833.4415.37%0.2110.59%120.370.84%3.0516.69
P&G Hygiene & Health28,858.2033.6938.30113.67%0.00155.91%232.122.87%4.93263.86

Godrej Consumer Products Financials

Full statement

Income Statement · Consolidated

Income Statement · Consolidated — all values in INR Crore
ParticularsMar 2025Mar 2024Mar 2023Mar 2022
Revenue₹14,364.29₹14,096.11₹13,315.97₹12,276.50
Other Income₹316.12₹268.95₹168.41₹89.71
Total Revenue₹14,680.41₹14,365.06₹13,484.38₹12,366.21
Total Expenses₹11,945.34₹11,689.97₹11,297.54₹10,201.48
Profit Before Tax₹2,671.89₹198.23₹2,132.73₹2,155.26
Tax₹819.59₹758.78₹430.27₹371.87
Profit After Tax₹1,852.30-₹560.55₹1,702.46₹1,783.39
EPS - Basic₹18.11-₹5.48₹16.65₹17.44
EPS - Diluted₹18.11-₹5.48₹16.65₹17.44

Cash Flow · Consolidated

Cash Flow · Consolidated — all values in INR Crore
ParticularsMar 2025Mar 2024Mar 2023Mar 2022
Profit before tax₹2,671.89₹198.23₹2,132.73₹2,155.26
Income before WC changes₹3,011.69₹2,899.79₹2,475.76₹2,434.28
Change in Assets-₹567.77-₹732.49₹462.96-₹541.02
Change in Liabilities₹602.90₹276.55-₹369.62₹4.85
Change in WC₹35.13-₹455.94₹93.34-₹536.17
Cash flow from Operations₹2,576.75₹2,069.95₹2,150.65₹1,450.57
Cash flow from Investing-₹343.56-₹3,363.02-₹1,758.34-₹864.23
Cash flow from Financing-₹2,181.49₹1,406.34-₹794.31-₹379.52
Total Cash Flow₹51.70₹113.27-₹402.00₹206.82
Cash (Start of the year)₹402.78₹357.62₹750.92₹524.13
Cash (End of the year)₹454.92₹402.78₹352.80₹750.86

Balance Sheet · Consolidated

Balance Sheet · Consolidated — all values in INR Crore
ParticularsMar 2025Mar 2024Mar 2023Mar 2022
Non-Current Assets₹12,344.96₹12,942.40₹11,692.80₹10,446.79
Current Assets₹7,326.83₹5,553.49₹5,805.97₹5,687.27
Total Assets₹19,671.79₹18,495.89₹17,498.77₹16,134.06
Current Liabilities₹6,933.56₹5,590.34₹3,291.31₹3,971.61
Net Current Asset₹393.27-₹36.85₹2,514.66₹1,715.66
Non-Current Liabilities₹734.31₹306.98₹413.23₹606.52
Equity Capital₹12,003.92₹12,598.57₹13,794.23₹11,555.93
Total Equity & Liabilities₹19,671.79₹18,495.89₹17,498.77₹16,134.06

Income Statement · Standalone

Income Statement · Standalone — all values in INR Crore
ParticularsMar 2025Mar 2024Mar 2023Mar 2022
Revenue₹8,910.15₹8,411.40₹7,667.17₹6,951.56
Other Income₹260.35₹455.96₹139.48₹69.18
Total Revenue₹9,170.50₹8,867.36₹7,806.65₹7,020.74
Total Expenses₹7,142.08₹6,429.77₹5,909.46₹5,316.50
Profit Before Tax₹2,016.13₹1,284.84₹1,869.60₹1,762.45
Tax₹665.61₹637.81₹355.90₹283.30
Profit After Tax₹1,350.52₹647.03₹1,513.70₹1,479.15
EPS - Basic₹13.20₹6.33₹14.80₹14.47
EPS - Diluted₹13.20₹6.32₹14.80₹14.46

Cash Flow · Standalone

Cash Flow · Standalone — all values in INR Crore
ParticularsMar 2025Mar 2024Mar 2023Mar 2022
Profit before tax₹2,016.13₹1,284.84₹1,869.60₹1,762.45
Income before WC changes₹2,136.77₹2,183.81₹1,891.98₹1,752.74
Change in Assets-₹233.46-₹182.73₹314.82-₹183.77
Change in Liabilities₹512.48₹97.99₹100.65-₹295.97
Change in WC₹279.02-₹84.74₹415.47-₹479.74
Cash flow from Operations₹2,114.21₹1,823.22₹1,976.99₹961.28
Cash flow from Investing₹75.67-₹2,980.03-₹2,003.74-₹968.44
Cash flow from Financing-₹2,165.42₹1,239.19₹9.22-₹20.37
Total Cash Flow₹24.46₹82.38-₹17.53-₹27.53
Cash (Start of the year)₹100.06₹17.69₹35.23₹62.78
Cash (End of the year)₹124.50₹100.06₹17.69₹35.23

Balance Sheet · Standalone

Balance Sheet · Standalone — all values in INR Crore
ParticularsMar 2025Mar 2024Mar 2023Mar 2022
Non-Current Assets₹9,069.26₹10,029.49₹7,280.15₹6,401.89
Current Assets₹4,293.00₹2,958.83₹3,281.23₹2,481.18
Total Assets₹13,362.26₹12,988.32₹10,561.38₹8,883.07
Current Liabilities₹4,438.21₹3,283.39₹1,084.22₹947.17
Net Current Asset-₹145.21-₹324.56₹2,197.01₹1,534.01
Non-Current Liabilities₹558.36₹152.35₹91.14₹84.78
Equity Capital₹8,365.69₹9,552.58₹9,386.02₹7,851.12
Total Equity & Liabilities₹13,362.26₹12,988.32₹10,561.38₹8,883.07
* All values are in INR Crore
Qty
Bid
62
1076.9
0
0
0
0
0
0
0
0
Ask
Qty
0
0
0
0
0
0
0
0
0
0
Bid Total: 62
Ask Total: 0
Buy orders: 100%
Sell orders: 0%
Bearish
2
Neutral
5
Bullish
1
Slightly Bearish
by SEBI experts
Expert Pick
EXPPICK
Stop-loss
Entry price
Target
Indicator
Value
Verdict

RSI (14)
63.14
Neutral

ATR (14)
24.54
Neutral

STOCH(9,6)
77.66
Neutral

STOCH RSI (14)
99.51
Bearish

ADX(9)
24.39
Bearish

UO(9)
51.19
Neutral

ROC(12)
4.1
Bullish

WillR(14)
-20.81
Neutral
Period
Simple value
Exponential vaue

5D
1045.92
1054.8

10D
1032.55
1041.24

20D
1025.2
1032.42

50D
1038.52
1040.36

100D
1075.79
1067.07

About Godrej Consumer Products

Godrej Consumer Products logo
ISIN
INE102D01028
Sector Market Cap
₹ 1,10,234 Cr

Godrej Consumer Products Limited is an Indian MNC headquartered in Mumbai. The company engages in manufacturing fast-moving consumer products. The company’s main products are soaps, hair colourants, toiletries and liquid detergents. Godrej Consumer Products Limited was founded following the separation of the consumer products business from Godrej Soaps Limited.

Godrej Consumer Products Limited is part of the Godrej group which was founded by Ardeshir Godrej in 1897 as part of India’s Swadeshi movement with the first venture to manufacture Godrej locks. It is one of the premium brands in that segment to date.

In 1918, it made a significant stride in the consumer goods market by launching Chavi, the first soap crafted from vegetable oil. In 1923, the company diversified its portfolio by venturing into the furniture business, and later, in 1958, it expanded further by entering the home appliances sector.

The market capitalisation of Godrej Consumer Products stood close to ₹1,19,000 crores as of January 24, 2024. Godrej Consumer share price has moved by over 45% in the last three years.

Business operations

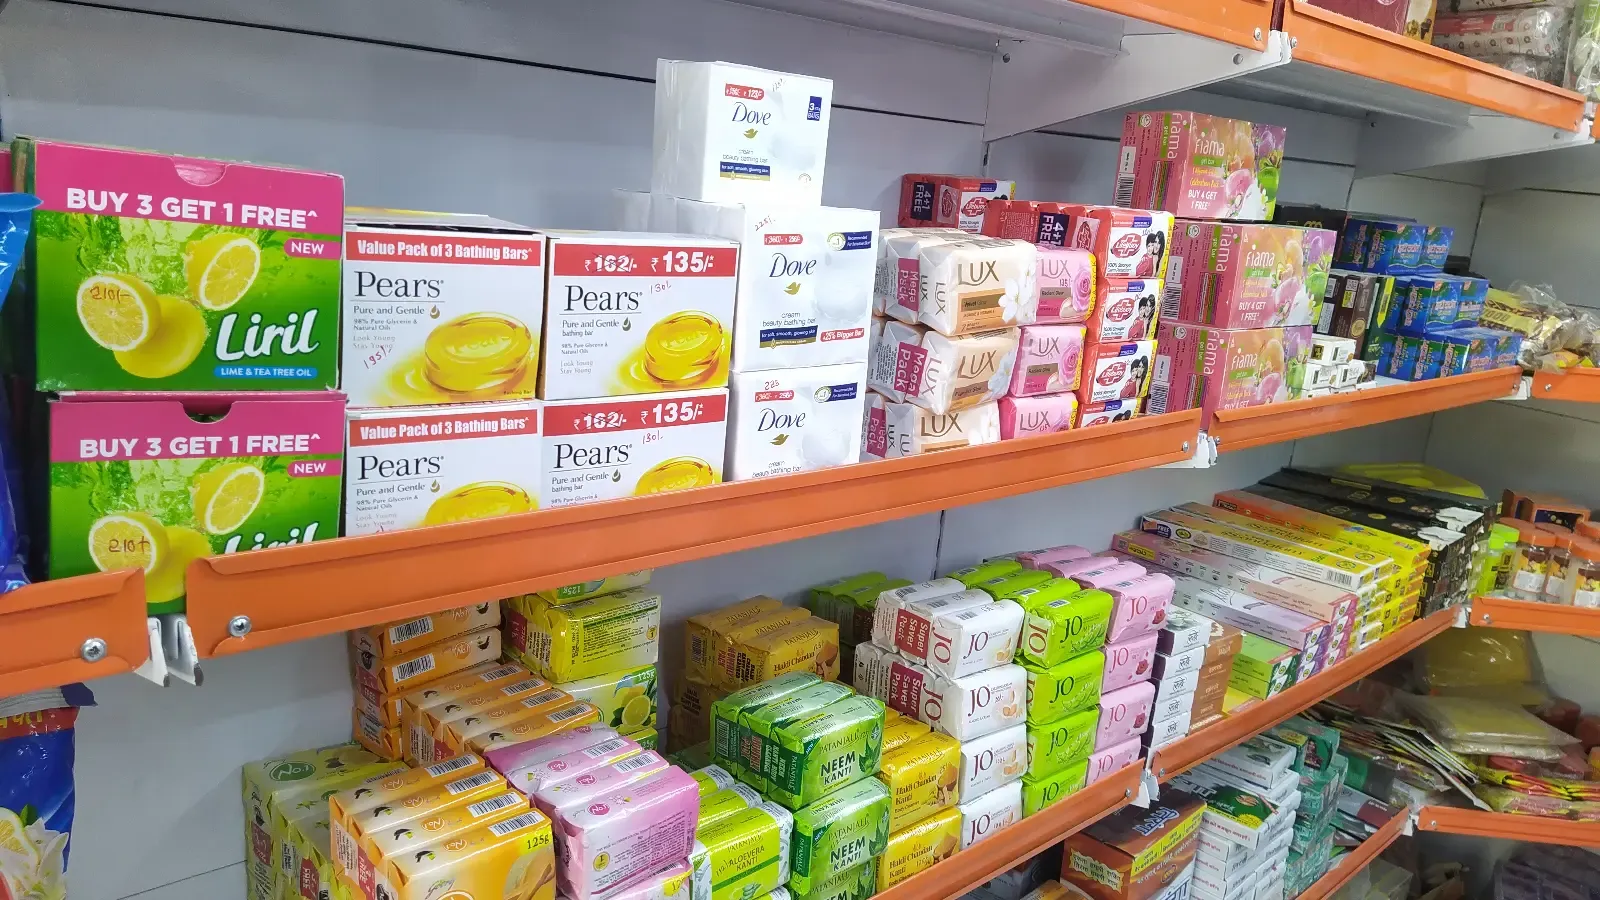
Godrej Consumer Products is a leading player among India's fast-moving consumer goods (FMCG) companies, specialising in household and personal care products. The company offers a diverse range of products including soaps and talc, featuring well-known brands such as Cinthol, Fair Glow and Evita. The company also has the largest market share in the insecticide and hair colourant business and the second largest in the soap category in the country.

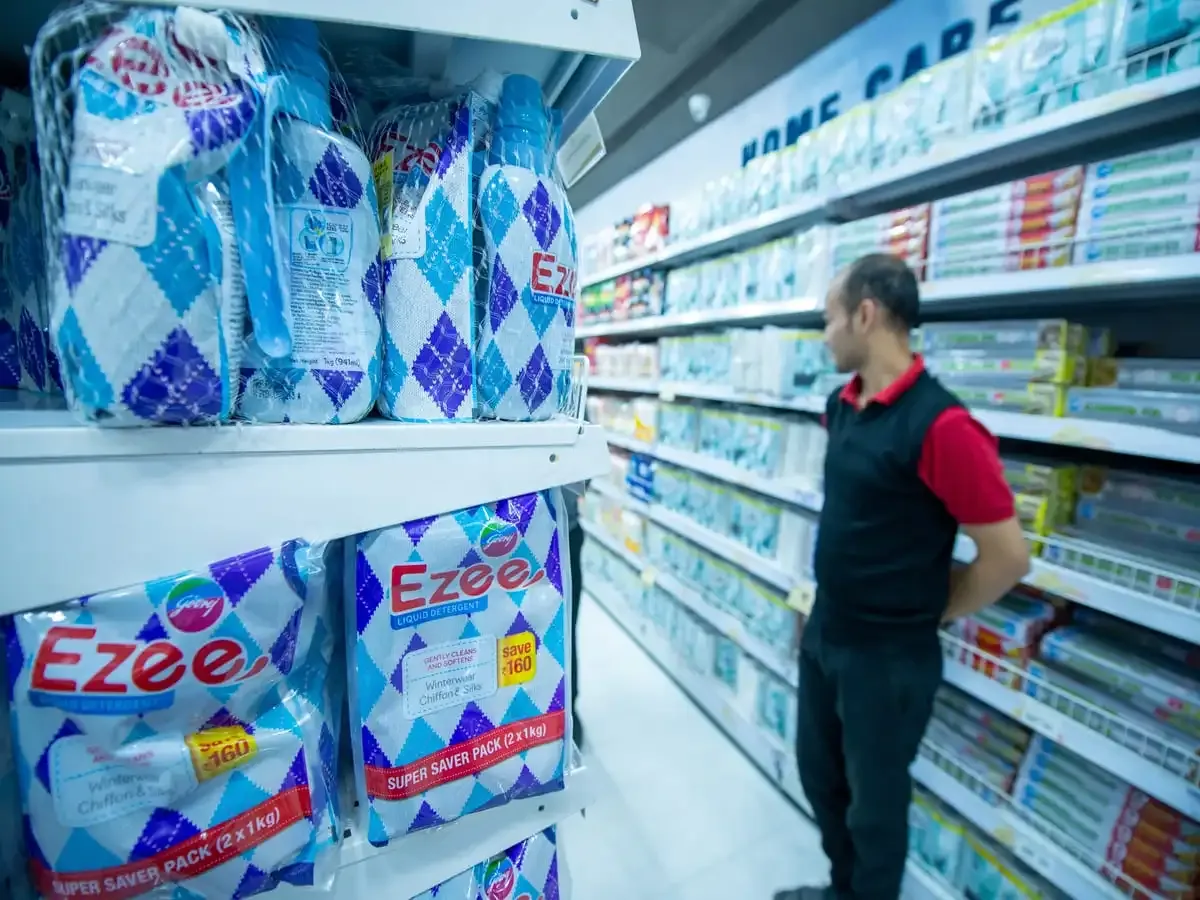
In the hair care category, Godrej Consumer Products has introduced various hair color products like Colour Soft, Anoop, Renew, Godrej Expert and Kesh Kala. In the household and fabric care segment, the company has products such as Godrej Dish Wash, Glossy and Ezee.

The company operates through its manufacturing facilities in 7 locations spread across India in the states of Madhya Pradesh, Himachal Pradesh, Assam, Sikkim, Pondicherry and Tamil Nadu.

Godrej Consumer Products Limited has established itself as a global player with a vast reach by operating in more than 85 countries. It serves a customer base exceeding 1.2 billion. Over 75% of its revenue is generated through the success of its top 11 brands. GCPL has a leading presence in key markets across Asia, Africa and Latin America.

The company operates across a network of locations including plants and offices. In India, it operates 18 plants and 4 offices. Internationally, the company extends its operations to 22 plants and 1 office. In terms of market reach, the company serves a substantial customer base across 17 markets. Domestically, it operates in 28 states and globally, and the company reaches customers in 17 different countries.

In the international business segment, the company focuses on e-commerce in the USA. This constitutes approximately 6% of the overall business. In the fiscal year 2012-13, 44% of the company's overall revenue came from international businesses. In the fiscal year 2022-23, it remained at 44%.

Godrej Consumer Products Financial Highlights

  • Revenue: Godrej Consumer Products reported revenue of ₹15,444.07 crore in FY26 vs ₹14,312.66 crore in FY25. It showed an increase of 7.90% on a yearly basis.
  • Operating Profit: Godrej Consumer Products reported an operating profit of ₹2,590.16 crore in FY26 vs ₹2,671.89 crore in FY25. It showed a decrease of 3.06% on a year-on-year basis.
  • Net Profit: Godrej Consumer Products reported a net profit of ₹1,861.47 crore in FY26 vs ₹1,852.30 crore in FY25. It showed an increase of 0.50% on a yearly basis.

Godrej Consumer Products Quarterly Result Highlights

  • Godrej Consumer Products reported revenue of ₹3,969.86 crore in Mar 2026, compared with ₹4,053.84 crore in Dec 2025, representing a decrease of 2.07% on a quarter-on-quarter (QoQ) basis.
  • Godrej Consumer Products reported an operating profit of ₹651.47 crore in Mar 2026, compared with ₹699.98 crore in Dec 2025, representing a decrease of 6.93% on a quarter-on-quarter (QoQ) basis.
  • Godrej Consumer Products reported a profit of ₹451.77 crore in Mar 2026, compared with ₹497.91 crore in Dec 2025, reflecting a decrease of 9.27% on a QoQ basis.
  • The earnings per share (EPS) of Godrej Consumer Products stood at ₹18.11 during Mar 2026.
Know more
Promoters
53.05%
FII
13.94%
Other DII
8.27%
Retail and other
15.00%
Mutual funds
9.73%
Foreign institutions - FII
Compare against other stocks
Godrej Consumer Products logo
Godrej Consumer Products
Household Products
Add Stock
Add Another

FAQs on Godrej Consumer Products Share Price