PVR Inox Share Price
PVR Inox Share Price Today
As of 25 Jul 2026, PVR Inox share price is ₹1,063.95. The stock opened at ₹1,010.00, compared to its previous close of ₹1,007.40. During today's trading session, PVR Inox share price moved in the range of ₹1,008.20 to ₹1,070.00, with an average price of ₹1,039.10 for the day. Looking at its last 52-week, the stock has touched a low of ₹907.40 and a high of ₹1,249.70. On the performance front, PVR Inox share price has increased by 14.28% over the last six months and is up 5.25% on a year-on-year basis.
PVR Inox Returns Calculator
PVR Inox Shareholder Returns
PVR Inox Share Price History
| Name | Mkt Cap Cr | P/E | P/B | ROE | D/E | ROCE | Book Value | Div. Yield | Turnover | EPS(TTM) |
|---|---|---|---|---|---|---|---|---|---|---|
| Sun TV Network | 19,182.10 | 13.31 | 1.52 | 11.39% | 0.01 | 15.30% | 312.60 | 2.57% | 0.33 | 35.36 |
| Zee Entertainment Enterprises | 10,071.00 | 37.18 | 0.86 | 2.31% | 0.02 | 2.65% | 109.97 | 1.91% | 0.70 | 1.25 |
| Saregama India | 9,572.99 | 46.40 | 6.05 | 12.23% | 0.06 | 16.08% | 81.99 | 0.91% | 0.46 | 11.19 |
| Tips Industries | 44.78 | 41.66 | 34.40 | 83.38% | 0.02 | 110.19% | 20.34 | 1.86% | 1.09 | 16.96 |
| Wonderla Holidays | 2,969.15 | 36.33 | 1.65 | 4.55% | 0.00 | 6.04% | 283.20 | 0.43% | 0.28 | 12.89 |
| Imagicaaworld Entertainment | 2,640.31 | 4,666.00 | 2.11 | 0.05% | 0.20 | 1.76% | 23.49 | 0.00% | 0.23 | 0.35 |
| MEDIA MATRIX WORLDWIDE L | 1,617.56 | 204.00 | 24.11 | 8.73% | 0.00 | 13.69% | 1.36 | 0.00% | 0.02 | 0.02 |
| Den Networks | 1,289.94 | 8.80 | 0.34 | 4.38% | 0.01 | 5.50% | 80.75 | 0.00% | 0.23 | 2.57 |
| Balaji Telefilms | 1,025.93 | -20.68 | 1.64 | -7.87% | 0.03 | -9.66% | 52.61 | 0.00% | 0.33 | -3.79 |
| Z-TECH (INDIA) LIMITED | 763.13 | 42.25 | 5.78 | 20.38% | 0.33 | 28.25% | 133.89 | 0.00% | 0.62 | 24.95 |
PVR Inox Financials
Income Statement · Consolidated
| Particulars | Mar 2025 | Mar 2024 | Mar 2023 | Mar 2022 |
|---|---|---|---|---|
| Revenue | ₹5,779.90 | ₹6,107.10 | ₹3,750.60 | ₹1,329.40 |
| Other Income | ₹173.70 | ₹156.60 | ₹79.10 | ₹326.13 |
| Total Revenue | ₹5,953.60 | ₹6,263.70 | ₹3,829.70 | ₹1,655.53 |
| Total Expenses | ₹6,327.60 | ₹6,307.60 | ₹4,027.90 | ₹2,336.24 |
| Profit Before Tax | -₹374.30 | -₹43.90 | -₹209.00 | -₹680.71 |
| Tax | -₹93.40 | -₹11.20 | ₹127.40 | -₹192.20 |
| Profit After Tax | -₹280.90 | -₹32.70 | -₹336.40 | -₹488.51 |
| EPS - Basic | -₹28.50 | -₹3.30 | -₹51.60 | -₹80.23 |
| EPS - Diluted | -₹28.50 | -₹3.30 | -₹51.60 | -₹80.23 |
Cash Flow · Consolidated
| Particulars | Mar 2025 | Mar 2024 | Mar 2023 | Mar 2022 |
|---|---|---|---|---|
| Profit before tax | -₹374.30 | -₹43.90 | -₹209.00 | -₹680.71 |
| Income before WC changes | ₹1,583.00 | ₹1,857.40 | ₹1,060.70 | ₹113.55 |
| Change in Assets | ₹16.70 | -₹82.20 | -₹177.60 | -₹22.82 |
| Change in Liabilities | ₹323.10 | ₹171.20 | -₹19.30 | ₹66.20 |
| Change in WC | ₹339.80 | ₹89.00 | -₹196.90 | ₹43.38 |
| Cash flow from Operations | ₹1,966.80 | ₹1,979.00 | ₹863.90 | ₹166.79 |
| Cash flow from Investing | -₹302.60 | -₹626.60 | -₹575.90 | -₹2.81 |
| Cash flow from Financing | -₹1,534.70 | -₹1,292.50 | -₹693.50 | -₹216.81 |
| Total Cash Flow | ₹129.50 | ₹59.90 | -₹405.50 | -₹52.83 |
| Cash (Start of the year) | ₹393.00 | ₹333.10 | ₹500.80 | ₹552.40 |
| Cash (End of the year) | ₹522.50 | ₹393.00 | ₹331.90 | ₹499.57 |
Balance Sheet · Consolidated
| Particulars | Mar 2025 | Mar 2024 | Mar 2023 | Mar 2022 |
|---|---|---|---|---|
| Non-Current Assets | ₹15,181.40 | ₹15,826.50 | ₹15,626.90 | ₹6,459.77 |
| Current Assets | ₹1,081.00 | ₹993.90 | ₹849.80 | ₹866.07 |
| Total Assets | ₹16,262.40 | ₹16,820.40 | ₹16,476.70 | ₹7,325.84 |
| Current Liabilities | ₹2,497.70 | ₹2,350.30 | ₹2,051.30 | ₹1,434.47 |
| Net Current Asset | -₹1,416.70 | -₹1,356.40 | -₹1,201.50 | -₹568.40 |
| Non-Current Liabilities | ₹6,711.30 | ₹7,146.90 | ₹7,095.90 | ₹4,521.26 |
| Equity Capital | ₹7,053.40 | ₹7,323.20 | ₹7,329.50 | ₹1,370.11 |
| Total Equity & Liabilities | ₹16,262.40 | ₹16,820.40 | ₹16,476.70 | ₹7,325.84 |
Income Statement · Standalone
| Particulars | Mar 2025 | Mar 2024 | Mar 2023 | Mar 2022 |
|---|---|---|---|---|
| Revenue | ₹5,442.40 | ₹5,897.10 | ₹3,559.10 | ₹1,213.31 |
| Other Income | ₹163.70 | ₹151.40 | ₹76.90 | ₹310.74 |
| Total Revenue | ₹5,606.10 | ₹6,048.50 | ₹3,636.00 | ₹1,524.05 |
| Total Expenses | ₹5,981.20 | ₹6,096.70 | ₹3,832.20 | ₹2,195.52 |
| Profit Before Tax | -₹375.10 | -₹48.20 | -₹207.00 | -₹671.47 |
| Tax | -₹98.20 | -₹12.50 | ₹126.00 | -₹193.12 |
| Profit After Tax | -₹276.90 | -₹35.70 | -₹333.00 | -₹478.35 |
| EPS - Basic | -₹28.20 | -₹3.60 | -₹51.30 | -₹78.60 |
| EPS - Diluted | -₹28.20 | -₹3.60 | -₹51.30 | -₹78.60 |
Cash Flow · Standalone
| Particulars | Mar 2025 | Mar 2024 | Mar 2023 | Mar 2022 |
|---|---|---|---|---|
| Profit before tax | -₹375.10 | -₹48.20 | -₹207.00 | -₹671.47 |
| Income before WC changes | ₹1,556.10 | ₹1,834.80 | ₹1,045.90 | ₹113.37 |
| Change in Assets | ₹33.00 | -₹41.70 | -₹70.00 | -₹60.78 |
| Change in Liabilities | ₹312.70 | ₹163.50 | -₹73.10 | ₹63.43 |
| Change in WC | ₹345.70 | ₹121.80 | -₹143.10 | ₹2.65 |
| Cash flow from Operations | ₹1,951.40 | ₹1,990.60 | ₹902.80 | ₹124.38 |
| Cash flow from Investing | -₹317.30 | -₹671.00 | -₹629.00 | ₹36.98 |
| Cash flow from Financing | -₹1,527.90 | -₹1,285.80 | -₹692.40 | -₹216.16 |
| Total Cash Flow | ₹106.20 | ₹33.80 | -₹418.60 | -₹54.80 |
| Cash (Start of the year) | ₹342.70 | ₹308.90 | ₹489.70 | ₹544.47 |
| Cash (End of the year) | ₹448.90 | ₹342.70 | ₹308.90 | ₹489.67 |
Balance Sheet · Standalone
| Particulars | Mar 2025 | Mar 2024 | Mar 2023 | Mar 2022 |
|---|---|---|---|---|
| Non-Current Assets | ₹15,349.00 | ₹15,957.70 | ₹15,715.30 | ₹6,486.48 |
| Current Assets | ₹865.90 | ₹828.70 | ₹711.40 | ₹811.05 |
| Total Assets | ₹16,214.90 | ₹16,786.40 | ₹16,426.70 | ₹7,297.53 |
| Current Liabilities | ₹2,468.90 | ₹2,326.90 | ₹2,007.30 | ₹1,417.04 |
| Net Current Asset | -₹1,603.00 | -₹1,498.20 | -₹1,295.90 | -₹605.99 |
| Non-Current Liabilities | ₹6,675.20 | ₹7,118.60 | ₹7,068.50 | ₹4,492.01 |
| Equity Capital | ₹7,070.80 | ₹7,340.90 | ₹7,350.90 | ₹1,388.48 |
| Total Equity & Liabilities | ₹16,214.90 | ₹16,786.40 | ₹16,426.70 | ₹7,297.53 |
About PVR Inox
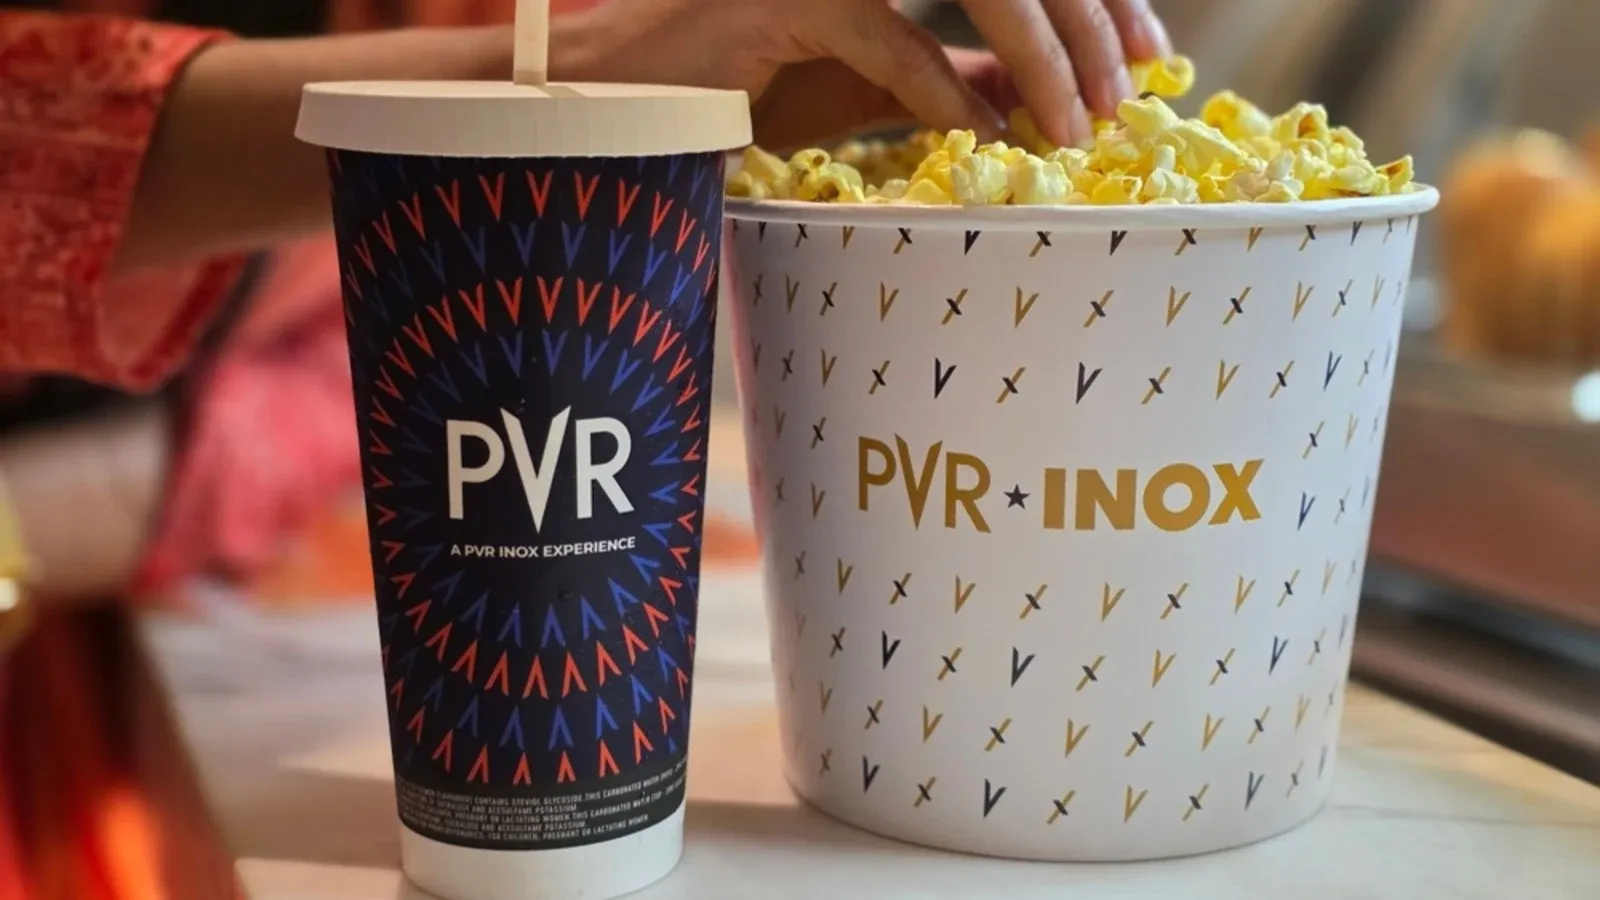
Mumbai-headquartered PVR INOX is the fifth-largest listed multiplex chain globally. It is India’s largest film exhibitor and multiplex chain operator, with its presence in the exhibition industry for over 26 years.
PVR has been consistently increasing its screen count by resorting to strategic investments and acquisitions. It acquired Cinemax Cinemas in November 2012, DT Cinemas in May 2016, and SPI Cinemas in August 2018.
On February 6, 2023, PVR Cinemas completed the merger with INOX Leisure Ltd, and the amalgamated entity was renamed as PVR INOX Ltd with effect from April 20, 2023.
The company has over 180 million patrons and provides a platform to showcase film and non-film content.
Priya Village Roadshow (PVR) was incorporated in April 1995 as a 60:40 joint venture between Priya Exhibitors Private Ltd and Australia’s Village Roadshow Ltd. The company aimed to ensure the return of families to movie theatres, hit by piracy and home viewing as also poor infrastructure, by establishing multiplexes.
The company started commercial operations in June 1997.
In 2006, PVR Cinemas was listed on the National Stock Exchange (NSE) after a successful initial public offering (IPO)that brought in funds worth ₹125 crore, earmarked for ambitious expansion plans.
PVR moved into film production in 2007 and joined hands with Aamir Khan Productions, churning out blockbuster hits like 'Taare Zameen Par' and 'Jaane Tu Ya Jaane Na'. To fund the ventures, PVR scoured for substantial equity investment and was backed up by big financial firms like JP Morgan and ICICI Venture.
Two years later, the company formed a joint venture with Thailand's Major Cineplex Group to introduce a new concept of gaming in India, opening bowling centres in Gurugram, Delhi, Bengaluru, Pune and Chandigarh.
However, notwithstanding initial successes, the subsequent releases fell short of expectation, and PVR quit film production in 2012.
In 2019, PVR expanded its international footprint in collaboration with the Shangri La Group, and opened a 9-screen multiplex at the One Galle Face Mall in Colombo, Sri Lanka.
In June 2022, PVR joined hands with French exhibitor CGR Cinemas, and introduced ICE Theatres Immersive format to India, bidding to give audiences a larger-than-life movie experience impossible to replicate in one's living room.
The company’s market capitalisation of PVR Inox Ltd stood at over ₹16,400 crore as of December 27, 2023. PVR share price has gone up nearly 30% in the last three years.
Business operations
PVR runs 1712 screens housed in 360 properties across 113 cities in India and Sri Lanka and an aggregate seating capacity of 3.58 lakh seats.

After the merger of PVR Cinemas with the country’s second biggest multiplex chain INOX Leisure Ltd, the combined entity’s market share has gone up to 18% including a chunk of 43% in the multiplex segment. It accounts for around 30% of the overall box office collections in India.
Its diversified revenue stream comprises principally box office and also non-box office collections, the latter including receipts from the sale of food and beverages, income from advertisement and movie distribution and convenience charges.

PVR Inox Financial Highlights
- Revenue: PVR Inox reported revenue of ₹6,829.70 crore in FY26 vs ₹5,870.80 crore in FY25. It showed an increase of 16.33% on a yearly basis.

- Operating Profit: PVR Inox reported an operating profit of ₹226.90 crore in FY26 vs ₹358.20 crore in FY25. It showed an increase of 163.34% on a year-on-year basis.
- Net Profit: PVR Inox reported a net profit of ₹332.80 crore in FY26 vs ₹280.90 crore in FY25. It showed an increase of 218.48% on a yearly basis.
PVR Inox Quarterly Result Highlights
- PVR Inox reported revenue of ₹1,648.30 crore in Jun 2026, compared with ₹1,623.90 crore in Mar 2026, representing an increase of 1.50% on a quarter-on-quarter (QoQ) basis.
- PVR Inox reported an operating profit of ₹75.70 crore in Jun 2026, compared with ₹20.80 crore in Mar 2026, representing an increase of 263.94% on a quarter-on-quarter (QoQ) basis.
- PVR Inox reported a profit of ₹56.50 crore in Jun 2026, compared with ₹186.40 crore in Mar 2026, reflecting a decrease of 69.69% on a QoQ basis.
- The earnings per share (EPS) of PVR Inox stood at ₹28.50 during Jun 2026.
Similar Stocks
FAQs on PVR Inox Share Price
What is PVR Inox share price today?
PVR Inox share price is ₹1,063.95 as on 24 Jul, 2026, 15:59 IST.
How has the PVR Inox share price performed in the past?
In the last 1 year, PVR Inox delivered a return of 5.25%. The PVR Inox share price hit a high of ₹1,249.70 and low of ₹907.40.
How much is the Mutual Fund shareholding in PVR Inox shares?
The Mutual Fund Shareholding in PVR Inox was 30.47% at the end of Jun 2026.
What is the the 52-week high and low of PVR Inox shares ?
The 52-week high and low of PVR Inox share is ₹1,249.70 and ₹907.40 as of 24 Jul, 2026.
What is the market cap of PVR Inox?
The market capitalisation of PVR Inox is ₹10,442.10 Crores as on 24 Jul, 2026.
What are the stock symbols of PVR Inox?
The stock symbol of PVR Inox is PVRINOX on the NSE, 532689 on the BSE, and the ISIN is INE191H01014.
What was yesterday's closing price of PVR Inox shares ?
PVR Inox shares closed yesterday at ₹1,007.40 on NSE & ₹1,009.05 on BSE
How to buy PVR Inox shares?
To buy PVR Inox shares, open a demat account with Upstox and complete the KYC process. Once your account is set up, search for the stock and place your order.
Can I buy PVR Inox shares on Holidays?
No, shares of PVR Inox or any other publicly traded company cannot be bought or sold on holidays when the stock exchanges are closed. You can only buy or sell PVR Inox shares on days when the stock exchanges are open for trading. It's important to check the NSE & BSE holidays calendar, before placing any trades to avoid any inconvenience.
What is the PE and PB ratio of PVR Inox?
The PE and PB ratio of PVR Inox is 23.53 and 1.42 respectively, as on 24 Jul, 2026, 15:59 IST.