Logo

Pidilite Industries Share Price

NSE: PIDILITIND
|
Chemicals
₹ 1,598.00
-₹7.40 (-0.46%)
1D
Last updated 03 Jul, 2026, 15:59 IST

Pidilite Industries Share Price Today

As of 5 Jul 2026, Pidilite Industries share price is ₹1,598.00. The stock opened at ₹1,621.00, compared to its previous close of ₹1,605.40. During today's trading session, Pidilite Industries share price moved in the range of ₹1,595.10 to ₹1,625.50, with an average price of ₹1,610.30 for the day. Looking at its last 52-week, the stock has touched a low of ₹1,259.00 and a high of ₹1,625.50. On the performance front, Pidilite Industries share price has increased by 8.10% over the last six months and is up 2.62% on a year-on-year basis.


₹1,595.10
0.46% down today
₹1,625.50
1D LOW
1D HIGH

Pidilite Industries Returns Calculator

Open
₹1,621.00
High
₹1,625.50
Low
₹1,595.10
Prev. close
₹1,605.40

Circuit
L
H
₹1,438.20
₹1,757.80
52-week
L
H
₹1,259.00
₹1,625.50

Pidilite Industries Shareholder Returns

Pidilite Industries Share Price History

Mkt Cap Cr
1,63,368.00

P/E
66.11

P/B
15.08

ROE
22.61%

D/E
0.03

ROCE
29.97%

Div. Yield
1.34%

EPS(TTM)
23.43
Turnover
1.18

EV/EBITDA
42.75

Net Margin
0.00%

Op. Margin
0.00%

ROA
16.01%

Quick Ratio
0.00

Curr. Ratio
2.40
Based on fundamentals, this stock's
Step 5 of 5
Performance
Excellent
Pidilite Inds. outperforming all market indices
Step 1 of 5
Valuation
Overvalued
Pidilite Inds. appears overvalued compared to its peers
Step 3 of 5
Earnings
Neutral
Pidilite Inds. earnings growth is positive
Peer Comparison
Peer comparison — key ratios
NameMkt Cap CrP/EP/BROED/EROCEBook ValueDiv. YieldTurnoverEPS(TTM)
SRF82,964.9039.505.1613.76%0.2813.78%5.730.37%0.7858.18
Linde India61,370.10111.8014.3812.87%0.0217.16%495.720.17%0.5664.59
Gujarat Fluorochemicals43,636.8076.035.587.30%0.228.93%647.240.08%0.5961.69
Godrej Industries40,773.6016.913.6511.10%6.259.34%52.530.00%0.731.81
Navin Fluorine39,211.9059.109.8716.69%0.0318.14%714.610.20%0.6096.03
Himadri Speciality Chemicals33,428.4029.644.7317.92%0.1222.34%4.820.18%0.8915.05
Deepak Nitrite21,438.3038.933.679.43%0.0210.74%235.740.48%0.7913.85
Deepak Fertilizers & Petr20,963.1028.383.0610.77%0.2310.76%290.010.60%0.4421.33
Atul19,031.2027.613.0610.90%0.0014.31%2,056.910.46%0.89202.11
Castrol India2,596.4418.7510.0646.94%0.0471.77%18.397.03%1.729.60

Pidilite Industries Financials

Full statement

Income Statement · Consolidated

Income Statement · Consolidated — all values in INR Crore
ParticularsMar 2025Mar 2024Mar 2023Mar 2022
Revenue₹13,140.31₹12,382.99₹11,799.10₹9,920.96
Other Income₹247.22₹139.65₹49.61₹36.30
Total Revenue₹13,387.53₹12,522.64₹11,848.71₹9,957.26
Total Expenses₹10,536.63₹10,067.57₹10,132.11₹8,355.36
Profit Before Tax₹2,822.70₹2,379.35₹1,723.24₹1,613.78
Tax₹726.53₹631.93₹434.37₹407.02
Profit After Tax₹2,096.17₹1,747.42₹1,288.87₹1,206.76
EPS - Basic₹40.82₹34.01₹25.05₹23.76
EPS - Diluted₹40.73₹33.98₹25.03₹23.75

Cash Flow · Consolidated

Cash Flow · Consolidated — all values in INR Crore
ParticularsMar 2025Mar 2024Mar 2023Mar 2022
Profit before tax₹2,822.70₹2,379.35₹1,723.24₹1,613.78
Income before WC changes₹3,220.13₹2,797.85₹2,047.75₹1,927.74
Change in Assets-₹565.98₹197.20-₹254.91-₹616.02
Change in Liabilities₹365.20₹377.07₹176.36₹105.65
Change in WC-₹200.78₹574.27-₹78.55-₹510.37
Cash flow from Operations₹2,286.63₹2,724.03₹1,557.57₹955.37
Cash flow from Investing-₹1,541.59-₹1,769.29-₹898.95-₹558.14
Cash flow from Financing-₹917.94-₹742.45-₹656.43-₹467.96
Total Cash Flow-₹172.90₹212.29₹2.19-₹70.73
Cash (Start of the year)₹459.51₹246.62₹256.42₹327.15
Cash (End of the year)₹286.61₹458.91₹258.61₹256.42

Balance Sheet · Consolidated

Balance Sheet · Consolidated — all values in INR Crore
ParticularsMar 2025Mar 2024Mar 2023Mar 2022
Non-Current Assets₹6,549.48₹6,267.54₹5,963.50₹5,500.01
Current Assets₹7,461.99₹5,836.41₹4,561.52₹4,015.61
Total Assets₹14,011.47₹12,103.95₹10,525.02₹9,515.62
Current Liabilities₹3,289.85₹2,797.58₹2,410.62₹2,325.03
Net Current Asset₹4,172.14₹3,038.83₹2,150.90₹1,690.58
Non-Current Liabilities₹763.86₹689.36₹668.48₹587.98
Equity Capital₹9,957.76₹8,617.01₹7,445.92₹6,602.61
Total Equity & Liabilities₹14,011.47₹12,103.95₹10,525.02₹9,515.62

Income Statement · Standalone

Income Statement · Standalone — all values in INR Crore
ParticularsMar 2025Mar 2024Mar 2023Mar 2022
Revenue₹12,072.70₹11,166.97₹10,597.07₹8,895.62
Other Income₹294.34₹165.55₹63.04₹39.96
Total Revenue₹12,367.04₹11,332.52₹10,660.11₹8,935.58
Total Expenses₹9,581.00₹8,935.86₹8,992.39₹7,344.84
Profit Before Tax₹2,765.88₹2,403.81₹1,667.72₹1,590.74
Tax₹692.05₹604.34₹410.54₹399.33
Profit After Tax₹2,073.83₹1,799.47₹1,257.18₹1,191.41
EPS - Basic₹40.77₹35.39₹24.73₹23.45
EPS - Diluted₹40.68₹35.35₹24.72₹23.43

Cash Flow · Standalone

Cash Flow · Standalone — all values in INR Crore
ParticularsMar 2025Mar 2024Mar 2023Mar 2022
Profit before tax₹2,765.88₹2,403.81₹1,667.72₹1,590.74
Income before WC changes₹3,024.83₹2,656.77₹1,906.26₹1,846.72
Change in Assets-₹475.05₹187.29-₹239.45-₹582.74
Change in Liabilities₹382.31₹347.35₹164.12₹41.90
Change in WC-₹92.74₹534.64-₹75.33-₹540.84
Cash flow from Operations₹2,228.71₹2,585.90₹1,432.36₹856.92
Cash flow from Investing-₹1,515.01-₹1,736.90-₹753.52-₹539.88
Cash flow from Financing-₹881.51-₹622.91-₹672.69-₹435.60
Total Cash Flow-₹167.81₹226.09₹6.15-₹118.56
Cash (Start of the year)₹379.87₹153.30₹147.70₹266.21
Cash (End of the year)₹212.08₹379.89₹153.80₹147.65

Balance Sheet · Standalone

Balance Sheet · Standalone — all values in INR Crore
ParticularsMar 2025Mar 2024Mar 2023Mar 2022
Non-Current Assets₹6,699.46₹6,353.10₹6,018.44₹5,553.87
Current Assets₹6,571.67₹5,017.66₹3,661.69₹3,184.50
Total Assets₹13,271.13₹11,370.76₹9,680.13₹8,738.37
Current Liabilities₹2,873.37₹2,410.98₹1,973.24₹1,863.04
Net Current Asset₹3,698.30₹2,606.68₹1,688.45₹1,321.46
Non-Current Liabilities₹721.36₹622.39₹598.73₹531.63
Equity Capital₹9,676.40₹8,337.39₹7,108.16₹6,343.70
Total Equity & Liabilities₹13,271.13₹11,370.76₹9,680.13₹8,738.37
* All values are in INR Crore
Qty
Bid
0
0
0
0
0
0
0
0
0
0
Ask
Qty
1598
15
0
0
0
0
0
0
0
0
Bid Total: 0
Ask Total: 15
Buy orders: 0%
Sell orders: 100%
Bearish
1
Neutral
5
Bullish
2
Slightly Bullish
by SEBI experts
Expert Pick
EXPPICK
Stop-loss
Entry price
Target
Indicator
Value
Verdict

RSI (14)
67.62
Neutral

ATR (14)
29.21
Neutral

STOCH(9,6)
60.99
Neutral

STOCH RSI (14)
18.09
Bullish

ADX(9)
50.54
Bearish

UO(9)
42.47
Neutral

ROC(12)
1.71
Bullish

WillR(14)
-37.72
Neutral
Period
Simple value
Exponential vaue

5D
1595.52
1594.53

10D
1587.24
1584.68

20D
1556.65
1559.57

50D
1487.06
1504.95

100D
1445.55
1475.07

About Pidilite Industries

Pidilite Industries logo
ISIN
INE318A01026
Sector Market Cap
₹ 1,63,368 Cr

Pidilite Industries Limited is a multinational adhesives manufacturing company. The Mumbai-based company is one of the largest producers and suppliers of adhesives globally.

Pidilite provides a wide range of products such as industrial resins, polymers, adhesives, sealants, waterproofing solutions, building chemicals, and arts and crafts supplies.

Founded in 1959 by Balvantray Kalyanji Parekh, Pidilite has major manufacturing facilities in Mahad (Maharashtra), Vapi (Gujarat), Baddi and Kala Amb (both in Himachal Pradesh).

The company established its first modern manufacturing plant in Mumbai. Currently, the building houses the corporate head office of the company. The firm was incorporated as a private limited company in 1990.

Pidilite’s global presence encompasses exports of over 500 products annually to more than 71 countries. The company has eight manufacturing facilities in India and abroad. The company has presence in Sri Lanka, Nepal, Bangladesh, the United Arab Emirates, Egypt, Singapore, the United States, European countries and African nations.

Pidilite Industries went public with the launch of its initial public offering (IPO) in 1993 and subsequently it was listed on the National Stock Exchange (NSE) and BSE. Pidilite Industries’ market capitalisation stood at ₹1.34 lakh crore as of December 19, 2023. Pidilite share price has surged nearly 53% in the last 3 years.

Business operations

Pidilite Industries is primarily focused on adhesives and related products for both home and industry uses. Over the years, the company has also diversified its product portfolio to sealants, waterproofing solutions, construction chemicals, industrial resins and polymers The company has emerged as a market leader in the adhesives segment.

The popular brands of the company include:
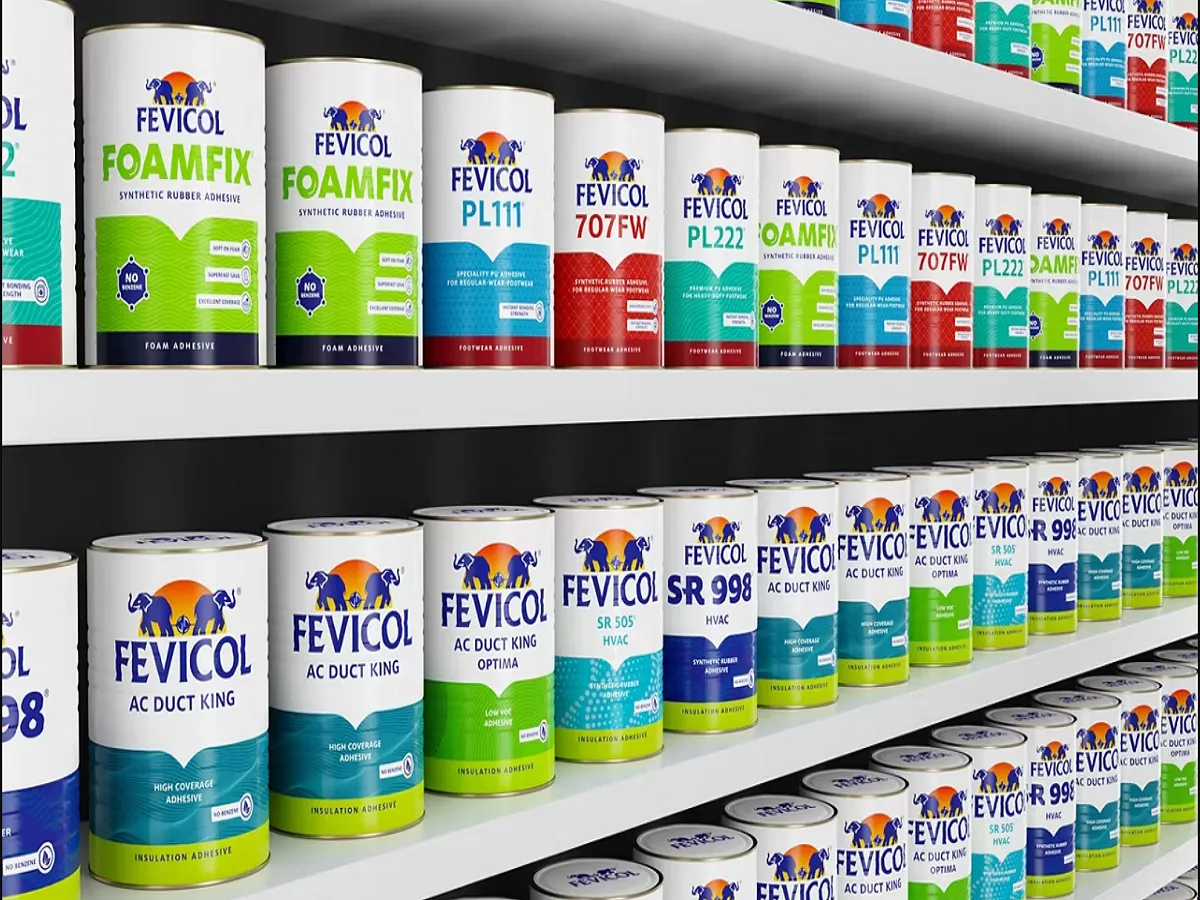
Fevicol:

This is Pidilite’s flagship brand, renowned for its synthetic resin adhesive. An iconic brand, Fevicol has become synonymous with household adhesives in India. The brand’s product line has transformed the carpentry trade across the country. This was the first product launched by the company in 1959.

Dr. Fixit:

Another key offering, it provides solutions for waterproofing homes.

Fevicol MR:

The go-to adhesive for crafts, Fevicol MR is favoured for its ease of application. It bonds various substrates like cardboard, paper, polystyrene and wood.

Fevikwik:

An instant adhesive, it caters to both industrial and home usage, working within seconds to repair broken items, regardless of the material.

M-Seal:

This epoxy putty is perfect for sealing, joining, fixing and building. Fevistik: It is a hassle-free and easy-to-use glue stick.

Pidilite Industries Financial Highlights

  • Revenue: Pidilite Industries reported revenue of ₹14,867.01 crore in FY26 vs ₹13,387.53 crore in FY25. It showed an increase of 11.05% on a yearly basis.
  • Operating Profit: Pidilite Industries reported an operating profit of ₹3,320.17 crore in FY26 vs ₹2,822.70 crore in FY25. It showed an increase of 17.62% on a year-on-year basis.
  • Net Profit: Pidilite Industries reported a net profit of ₹2,470.72 crore in FY26 vs ₹2,096.17 crore in FY25. It showed an increase of 17.87% on a yearly basis.

Pidilite Industries Quarterly Result Highlights

  • Pidilite Industries reported revenue of ₹3,648.16 crore in Mar 2026, compared with ₹3,775.44 crore in Dec 2025, representing a decrease of 3.37% on a quarter-on-quarter (QoQ) basis.
  • Pidilite Industries reported an operating profit of ₹776.65 crore in Mar 2026, compared with ₹839.74 crore in Dec 2025, representing a decrease of 7.51% on a quarter-on-quarter (QoQ) basis.
  • Pidilite Industries reported a profit of ₹584.15 crore in Mar 2026, compared with ₹623.84 crore in Dec 2025, reflecting a decrease of 6.36% on a QoQ basis.
  • The earnings per share (EPS) of Pidilite Industries stood at ₹40.82 during Mar 2026.
Know more
Promoters
69.32%
FII
11.75%
Other DII
5.31%
Retail and other
9.29%
Mutual funds
4.34%
Foreign institutions - FII
Compare against other stocks
Pidilite Industries logo
Pidilite Industries
Chemicals
Add Stock
Add Another

FAQs on Pidilite Industries Share Price