Logo

PATANJALI FOODS LIMITED Share Price

NSE: PATANJALI
|
Consumer Food
₹ 413.95
+₹0.50 (0.12%)
1D
Last updated 03 Jul, 2026, 15:56 IST

PATANJALI FOODS LIMITED Share Price Today

As of 5 Jul 2026, PATANJALI FOODS LIMITED share price is ₹413.95. The stock opened at ₹415.00, compared to its previous close of ₹413.45. During today's trading session, PATANJALI FOODS LIMITED share price moved in the range of ₹411.90 to ₹416.70, with an average price of ₹414.30 for the day. Looking at its last 52-week, the stock has touched a low of ₹406.35 and a high of ₹653.90. On the performance front, PATANJALI FOODS LIMITED share price has declined by 25.68% over the last six months and is down 25.24% on a year-on-year basis.


₹411.90
0.12% up today
₹416.70
1D LOW
1D HIGH

PATANJALI FOODS LIMITED Returns Calculator

Open
₹415.00
High
₹416.70
Low
₹411.90
Prev. close
₹413.45

Circuit
L
H
₹372.60
₹455.30
52-week
L
H
₹406.35
₹653.90

PATANJALI FOODS LIMITED Shareholder Returns

PATANJALI FOODS LIMITED Share Price History

Mkt Cap Cr
45,064.00

P/E
24.83

P/B
3.44

ROE
15.37%

D/E
0.21

ROCE
10.59%

Div. Yield
0.84%

EPS(TTM)
16.69
Turnover
3.05

EV/EBITDA
27.12

Net Margin
0.00%

Op. Margin
0.00%

ROA
9.65%

Quick Ratio
0.00

Curr. Ratio
4.23
Based on fundamentals, this stock's
Step 1 of 5
Performance
Very Poor
Patanjali Foods has not beaten FD return of 7%
Step 3 of 5
Valuation
Fairly Valued
Patanjali Foods appears to be fairly valued compared to its peers
Step 3 of 5
Earnings
Neutral
Patanjali Foods earnings growth is positive
Peer Comparison
Peer comparison — key ratios
NameMkt Cap CrP/EP/BROED/EROCEBook ValueDiv. YieldTurnoverEPS(TTM)
Hindustan Unilever5,19,424.0032.129.9131.07%0.0325.43%9.811.99%0.9765.66
Nestle India2,78,882.0064.7343.9376.34%0.1756.47%42.671.02%2.6818.38
Varun Beverages1,72,641.0052.658.5915.51%0.0219.85%53.420.21%0.687.91
Britannia Industries1,29,450.0051.0225.3549.61%0.2951.85%192.691.68%3.62106.35
Marico1,11,174.0061.3426.4141.85%0.0340.56%44.730.47%1.5915.00
Godrej Consumer Products1,10,234.0059.228.7114.71%0.3817.09%76.661.86%1.0914.81
LENSKART SOLUTIONS LTD92,343.50184.4110.575.65%0.207.00%52.450.00%0.492.80
Dabur India79,251.3042.436.9416.59%0.0820.18%42.431.85%1.208.41
Colgate Palmolive9,183.4023.6827.81158.62%0.03179.72%58.242.33%3.5948.73
P&G Hygiene & Health28,858.2033.6938.30113.67%0.00155.91%232.122.87%4.93263.86

PATANJALI FOODS LIMITED Financials

Full statement

Income Statement · Consolidated

Income Statement · Consolidated — all values in INR Crore
ParticularsMar 2025Mar 2019Mar 2018Mar 2017
Revenue₹34,156.97₹12,729.23₹12,027.05₹19,172.89
Other Income₹132.43₹120.15₹36.89₹107.60
Total Revenue₹34,289.40₹12,849.38₹12,063.94₹19,280.49
Total Expenses₹32,563.87₹12,937.33₹18,249.60₹21,049.72
Profit Before Tax₹1,725.53-₹87.95-₹6,185.66-₹1,735.95
Tax₹424.82₹0.03-₹437.39-₹374.17
Profit After Tax₹1,300.71-₹87.97-₹5,748.27-₹1,361.78
EPS - Basic₹35.94-₹0.32-₹172.70-₹46.08
EPS - Diluted₹35.94-₹0.32-₹172.70-₹46.08

Cash Flow · Consolidated

Cash Flow · Consolidated — all values in INR Crore
ParticularsMar 2025Mar 2019Mar 2018Mar 2017
Profit before tax₹1,725.53-₹87.95-₹6,185.66-₹1,685.85
Income before WC changes₹2,199.36₹242.55₹125.64₹235.38
Change in Assets-₹2,699.01-₹141.23₹515.91₹2,070.00
Change in Liabilities₹1,152.07₹100.07₹337.16-₹1,890.35
Change in WC-₹1,546.94-₹41.17₹853.06₹179.65
Cash flow from Operations₹197.10₹225.30₹979.14₹441.39
Cash flow from Investing-₹14.10-₹98.18-₹68.14₹86.32
Cash flow from Financing-₹611.27-₹6.99-₹970.38-₹668.53
Total Cash Flow-₹428.27₹120.13-₹59.38-₹140.81
Cash (Start of the year)₹537.43₹39.00₹98.38₹239.19
Cash (End of the year)₹109.16₹159.13₹39.00₹98.38

Balance Sheet · Consolidated

Balance Sheet · Consolidated — all values in INR Crore
ParticularsMar 2025Mar 2019Mar 2018Mar 2017
Non-Current Assets₹6,117.81₹5,418.17₹5,606.36₹5,808.83
Current Assets₹9,399.37₹2,545.89₹2,187.14₹7,714.45
Total Assets₹15,517.18₹7,964.07₹7,793.51₹13,523.27
Current Liabilities₹4,103.78₹12,948.50₹12,642.18₹12,168.95
Net Current Asset₹5,295.60-₹10,402.61-₹10,455.04-₹4,454.50
Non-Current Liabilities₹42.51₹38.39₹84.35₹541.12
Equity Capital₹11,370.89-₹5,022.82-₹4,933.03₹813.20
Total Equity & Liabilities₹15,517.18₹7,964.07₹7,793.51₹13,523.27

Income Statement · Standalone

Income Statement · Standalone — all values in INR Crore
ParticularsMar 2025Mar 2024Mar 2023Mar 2022
Revenue₹34,156.97₹31,741.81₹31,524.66₹24,205.38
Other Income₹132.43₹219.82₹296.80₹79.01
Total Revenue₹34,289.40₹31,961.63₹31,821.45₹24,284.38
Total Expenses₹32,563.24₹30,901.54₹30,642.49₹23,210.00
Profit Before Tax₹1,726.16₹1,060.09₹1,178.96₹1,074.38
Tax₹424.82₹294.93₹292.52₹268.07
Profit After Tax₹1,301.34₹765.15₹886.44₹806.31
EPS - Basic₹35.96₹21.14₹24.54₹27.26
EPS - Diluted₹35.96₹21.14₹24.54₹27.26

Cash Flow · Standalone

Cash Flow · Standalone — all values in INR Crore
ParticularsMar 2025Mar 2024Mar 2023Mar 2022
Profit before tax₹1,726.16₹1,060.09₹1,178.96₹1,074.38
Income before WC changes₹2,199.99₹1,406.78₹1,327.02₹1,495.89
Change in Assets-₹2,698.98₹518.32-₹1,885.05-₹990.73
Change in Liabilities₹1,152.03₹160.53₹490.84₹335.78
Change in WC-₹1,546.95₹678.85-₹1,394.20-₹654.95
Cash flow from Operations₹197.73₹1,746.25-₹339.34₹724.21
Cash flow from Investing-₹35.67-₹911.88₹526.12-₹1,562.45
Cash flow from Financing-₹611.27-₹1,100.03₹241.36₹1,166.92
Total Cash Flow-₹449.21-₹265.67₹428.14₹328.69
Cash (Start of the year)₹537.43₹803.10₹374.96₹46.27
Cash (End of the year)₹88.22₹537.43₹803.10₹374.96

Balance Sheet · Standalone

Balance Sheet · Standalone — all values in INR Crore
ParticularsMar 2025Mar 2024Mar 2023Mar 2022
Non-Current Assets₹6,139.37₹5,492.55₹5,418.81₹5,128.85
Current Assets₹9,378.40₹7,769.53₹7,824.77₹6,351.36
Total Assets₹15,517.77₹13,262.07₹13,243.59₹11,480.21
Current Liabilities₹4,103.74₹3,026.12₹3,201.92₹2,253.61
Net Current Asset₹5,274.66₹4,743.40₹4,622.85₹4,097.74
Non-Current Liabilities₹42.51₹30.64₹195.10₹3,055.76
Equity Capital₹11,371.52₹10,205.31₹9,846.57₹6,170.84
Total Equity & Liabilities₹15,517.77₹13,262.07₹13,243.59₹11,480.21
* All values are in INR Crore
Qty
Bid
0
0
0
0
0
0
0
0
0
0
Ask
Qty
413.95
92
0
0
0
0
0
0
0
0
Bid Total: 0
Ask Total: 92
Buy orders: 0%
Sell orders: 100%
Bearish
2
Neutral
6
Bullish
0
Slightly Bearish
by SEBI experts
Expert Pick
EXPPICK
Stop-loss
Entry price
Target
Indicator
Value
Verdict

RSI (14)
34.23
Neutral

ATR (14)
7.57
Neutral

STOCH(9,6)
40.75
Neutral

STOCH RSI (14)
57.02
Neutral

ADX(9)
45.39
Bearish

UO(9)
49.92
Neutral

ROC(12)
-2.73
Bearish

WillR(14)
-73.52
Neutral
Period
Simple value
Exponential vaue

5D
412.85
413.6

10D
414.56
415.38

20D
418.34
421.47

50D
442.21
439.47

100D
468.33
464.6

About PATANJALI FOODS LIMITED

PATANJALI FOODS LIMITED logo
ISIN
INE619A01035
Sector Market Cap
₹ 45,064 Cr

Patanjali Foods, formerly Ruchi Soya Industries Ltd, is an Indian fast-moving consumer goods (FMCG) company. Since its establishment in 1986, Patanjali Foods has become a major player in the edible oil segment.

It has a significant presence throughout the value chain, from farmers to consumers. It is one of the largest FMCG companies and a big producer and promoter of a range of edible oils and soya foods within India. Patanjali Foods is also one of India's largest palm plantation companies.

In the early '90s, Ruchi Soya Industries Ltd established India's first soya seed processing facility entering into the edible oil industry. The company ventured into the import and distribution of edible oils by 1995.

The year 2000 witnessed a significant milestone with the inauguration of the first port-based edible oil refinery in Chennai, where the company introduced palm oil in a packaged format. Five years later in 2005, Ruchi Soya Industries Ltd started a domestic oil palm plantation.

The subsequent years were marked by strategic expansions and partnerships. 2006 witnessed the merger of multiple soya-based and other edible oil companies with Ruchi Soya Industries Limited. The company collaborated with Indian Oil Corporation Limited in 2011 for renewable energy.

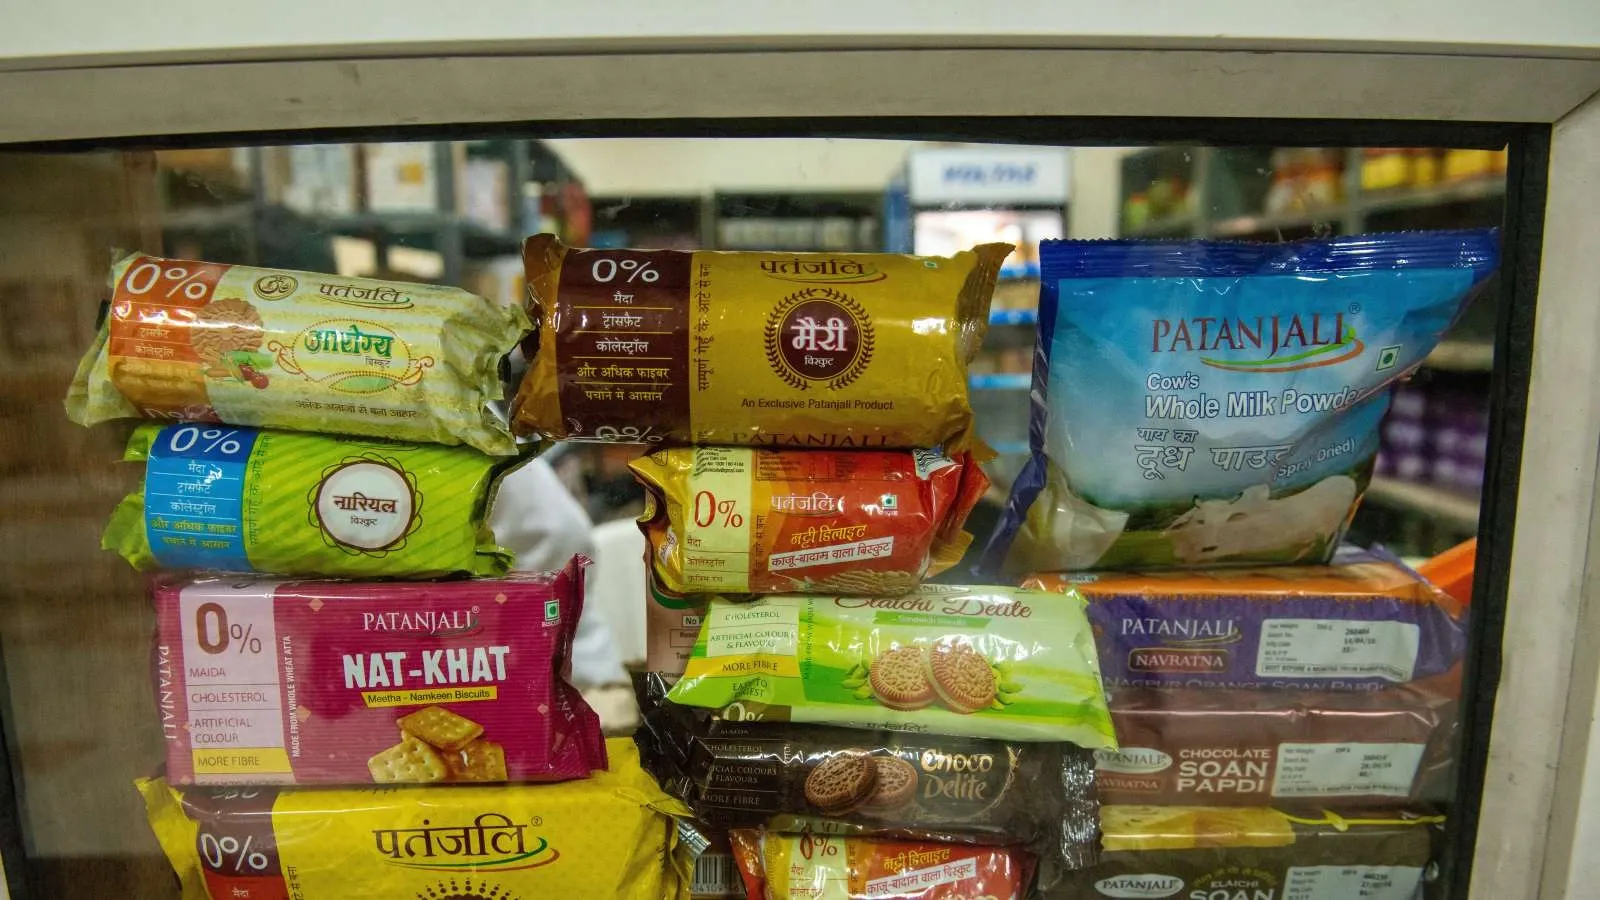
In 2020, the company launched premium edible oils, honey and high-protein chakki fresh atta under the Nutrela brand. The strategic acquisitions of biscuits, cookies and rusk business from Patanjali Natural Biscuits Private Limited in 2021 further solidified its position in the market. Ruchi Soya Industries Limited was rebranded as Patanjali Foods Limited in 2022.

The market capitalisation of Ruchi Soya parent Patanjali Foods stood at nearly ₹58,000 crore as of December 19, 2023. Ruchi Soya share price has gained more than 128% in three years.

Business operations

Patanjali Foods holds a strong brand presence in Indian households, allowing it to maintain its top position within the industry. It has successfully established Nutrela, Mahakosh, Sunrich, Ruchi Gold and Ruchi No.1 as iconic brands nationwide. Operating 22 manufacturing units, the company has a collective refining capacity exceeding 11,000 tonnes per day. Patanjali Foods also has a seed crushing capacity of 11,000 tonnes per day and a packaging capacity of 10,000 tonnes per day. It also enjoys exclusive procurement rights to over two lakh hectares of land in India for palm oil cultivation.

The company’s production infrastructure includes 43 contract manufacturing plants, 25 process manufacturing plants and oil palm plantations in 12 states across India.

The distribution network comprises over 7,500 distributors, 100 sales depots, nearly 15 lakh retail touch points and 30 super distributors.

Outside India, Patanjali Foods has a presence in 33 countries. It’s also one of the leading Indian exporters of value added soya products.

PATANJALI FOODS LIMITED Financial Highlights

  • Revenue: PATANJALI FOODS LIMITED reported revenue of ₹40,347.78 crore in FY26 vs ₹33,890.68 crore in FY25. It showed an increase of 19.05% on a yearly basis.
  • Operating Profit: PATANJALI FOODS LIMITED reported an operating profit of ₹1,353.54 crore in FY26 vs ₹1,725.53 crore in FY25. It showed a decrease of 21.56% on a year-on-year basis.
  • Net Profit: PATANJALI FOODS LIMITED reported a net profit of ₹1,814.47 crore in FY26 vs ₹1,300.71 crore in FY25. It showed an increase of 39.50% on a yearly basis.

PATANJALI FOODS LIMITED Quarterly Result Highlights

  • PATANJALI FOODS LIMITED reported revenue of ₹11,212.17 crore in Mar 2026, compared with ₹10,541.12 crore in Dec 2025, representing an increase of 6.37% on a quarter-on-quarter (QoQ) basis.
  • PATANJALI FOODS LIMITED reported an operating profit of ₹235.65 crore in Mar 2026, compared with ₹364.23 crore in Dec 2025, representing a decrease of 35.30% on a quarter-on-quarter (QoQ) basis.
  • PATANJALI FOODS LIMITED reported a profit of ₹523.98 crore in Mar 2026, compared with ₹593.44 crore in Dec 2025, reflecting a decrease of 11.70% on a QoQ basis.
  • The earnings per share (EPS) of PATANJALI FOODS LIMITED stood at ₹35.94 during Mar 2026.
Know more
Promoters
68.25%
FII
9.20%
Other DII
9.81%
Retail and other
10.49%
Mutual funds
2.25%
Foreign institutions - FII
Compare against other stocks
PATANJALI FOODS LIMITED logo
PATANJALI FOODS LIMITED
Consumer Food
Add Stock
Add Another

FAQs on PATANJALI FOODS LIMITED Share Price