Logo

BPCL Share Price

NSE: BPCL
|
Refineries
₹ 308.15
-₹2.30 (-0.74%)
1D
Last updated 03 Jul, 2026, 15:58 IST

BPCL Share Price Today

As of 5 Jul 2026, BPCL share price is ₹308.15. The stock opened at ₹313.60, compared to its previous close of ₹310.45. During today's trading session, BPCL share price moved in the range of ₹306.70 to ₹313.60, with an average price of ₹310.15 for the day. Looking at its last 52-week, the stock has touched a low of ₹266.60 and a high of ₹391.65. On the performance front, BPCL share price has declined by 19.22% over the last six months and is down 7.04% on a year-on-year basis.


₹306.70
0.74% down today
₹313.60
1D LOW
1D HIGH

BPCL Returns Calculator

Open
₹313.60
High
₹313.60
Low
₹306.70
Prev. close
₹310.45

Circuit
L
H
₹277.35
₹338.95
52-week
L
H
₹266.60
₹391.65

BPCL Shareholder Returns

BPCL Share Price History

Mkt Cap Cr
1,34,689.00

P/E
5.21

P/B
1.34

ROE
25.80%

D/E
0.22

ROCE
24.02%

Div. Yield
2.38%

EPS(TTM)
54.54
Turnover
4.56

EV/EBITDA
3.70

Net Margin
0.00%

Op. Margin
0.00%

ROA
10.39%

Quick Ratio
0.00

Curr. Ratio
1.00
Based on fundamentals, this stock's
Step 5 of 5
Performance
Excellent
B P C L outperforming all market indices
Step 3 of 5
Valuation
Fairly Valued
B P C L appears to be fairly valued compared to its peers
Step 3 of 5
Earnings
Neutral
B P C L earnings growth is positive
Peer Comparison
Peer comparison — key ratios
NameMkt Cap CrP/EP/BROED/EROCEBook ValueDiv. YieldTurnoverEPS(TTM)
Reliance17,64,370.0022.522.0110.94%0.3910.58%3.210.45%0.6532.40
IOC2,00,098.004.580.9119.18%0.6018.43%145.100.88%3.0526.72
Hindustan Petroleum Corp85,038.404.711.3027.53%0.8822.06%281.266.07%4.4980.72
MRPL26,306.5013.671.8513.56%1.0816.43%80.832.66%4.1311.02
Chennai Petroleum Corp16,875.405.441.5227.93%0.1831.74%725.265.47%6.27205.62
GANDHAR OIL REFINE IND L1,830.3513.341.3510.01%0.0713.08%132.850.40%2.4514.14

BPCL Financials

Full statement

Income Statement · Consolidated

Income Statement · Consolidated — all values in INR Crore
ParticularsMar 2025Mar 2024Mar 2023Mar 2022
Revenue₹440,271.86₹448,083.03₹473,187.18₹346,791.08
Other Income₹2,684.72₹2,234.73₹1,498.22₹2,268.54
Total Revenue₹442,956.58₹450,317.76₹474,685.40₹349,059.62
Total Expenses₹425,718.61₹414,921.15₹472,413.27₹335,693.77
Profit Before Tax₹18,182.30₹36,194.44₹2,821.13₹16,036.73
Tax₹4,845.75₹9,335.60₹690.08₹4,355.23
Profit After Tax₹13,336.55₹26,858.84₹2,131.05₹11,681.50
EPS - Basic₹31.21₹63.04₹10.01₹54.91
EPS - Diluted₹31.21₹63.04₹10.01₹54.91

Cash Flow · Consolidated

Cash Flow · Consolidated — all values in INR Crore
ParticularsMar 2025Mar 2024Mar 2023Mar 2022
Profit before tax₹18,182.30₹36,194.44₹2,821.13₹16,036.73
Income before WC changes₹26,760.71₹45,833.88₹13,443.12₹20,870.68
Change in Assets-₹4,577.67-₹6,687.28₹6,210.18-₹11,721.54
Change in Liabilities₹5,484.42₹5,482.54-₹6,386.32₹13,044.16
Change in WC₹906.75-₹1,204.74-₹176.14₹1,322.62
Cash flow from Operations₹23,677.79₹35,969.63₹12,465.60₹20,335.63
Cash flow from Investing-₹19,179.99-₹10,554.31-₹7,806.41-₹8,137.57
Cash flow from Financing-₹6,240.61-₹25,427.30-₹4,402.01-₹17,671.68
Total Cash Flow-₹1,742.81-₹11.98₹257.18-₹5,473.62
Cash (Start of the year)₹2,300.74₹2,312.72₹2,055.54₹7,529.16
Cash (End of the year)₹557.93₹2,300.74₹2,312.72₹2,055.54

Balance Sheet · Consolidated

Balance Sheet · Consolidated — all values in INR Crore
ParticularsMar 2025Mar 2024Mar 2023Mar 2022
Non-Current Assets₹145,550.00₹136,723.64₹132,095.84₹125,529.27
Current Assets₹72,832.22₹65,694.11₹56,012.93₹61,999.36
Total Assets₹218,382.22₹202,417.75₹188,108.77₹187,528.63
Current Liabilities₹90,672.00₹80,883.38₹74,841.71₹83,068.47
Net Current Asset-₹17,839.78-₹15,189.27-₹18,828.78-₹21,069.11
Non-Current Liabilities₹46,326.14₹45,899.26₹59,744.70₹52,554.54
Equity Capital₹81,384.08₹75,635.11₹53,522.36₹51,905.62
Total Equity & Liabilities₹218,382.22₹202,417.75₹188,108.77₹187,528.63

Income Statement · Standalone

Income Statement · Standalone — all values in INR Crore
ParticularsMar 2025Mar 2024Mar 2023Mar 2022
Revenue₹440,131.93₹447,907.60₹473,124.67₹346,643.94
Other Income₹3,086.20₹2,518.01₹2,183.99₹2,629.36
Total Revenue₹443,218.13₹450,425.61₹475,308.66₹349,273.30
Total Expenses₹423,779.87₹413,079.22₹471,732.00₹335,244.63
Profit Before Tax₹17,664.33₹35,548.37₹2,216.70₹15,671.74
Tax₹4,389.07₹8,874.87₹346.60₹4,308.39
Profit After Tax₹13,275.26₹26,673.50₹1,870.10₹11,363.35
EPS - Basic₹31.07₹62.60₹8.78₹53.41
EPS - Diluted₹31.07₹62.60₹8.78₹53.41

Cash Flow · Standalone

Cash Flow · Standalone — all values in INR Crore
ParticularsMar 2025Mar 2024Mar 2023Mar 2022
Profit before tax₹17,664.33₹35,548.37₹2,216.70₹15,671.74
Income before WC changes₹26,441.15₹45,720.46₹11,526.44₹20,761.16
Change in Assets-₹4,360.52-₹6,762.38₹6,283.88-₹11,368.58
Change in Liabilities₹5,505.96₹5,462.34-₹6,344.90₹13,243.59
Change in WC₹1,145.44-₹1,300.04-₹61.02₹1,875.01
Cash flow from Operations₹23,604.83₹35,762.21₹10,664.05₹20,813.45
Cash flow from Investing-₹18,795.63-₹11,661.16-₹6,397.31-₹7,743.73
Cash flow from Financing-₹4,916.09-₹25,466.04-₹3,665.87-₹18,661.77
Total Cash Flow-₹106.89-₹1,364.99₹600.87-₹5,592.05
Cash (Start of the year)₹516.33₹1,881.32₹1,280.45₹6,478.94
Cash (End of the year)₹409.44₹516.33₹1,881.32₹1,280.45

Balance Sheet · Standalone

Balance Sheet · Standalone — all values in INR Crore
ParticularsMar 2025Mar 2024Mar 2023Mar 2022
Non-Current Assets₹116,464.55₹109,149.12₹105,405.97₹103,078.32
Current Assets₹71,529.99₹63,843.85₹55,427.43₹61,106.15
Total Assets₹187,994.54₹172,992.97₹160,833.40₹164,184.47
Current Liabilities₹86,963.95₹72,233.30₹71,902.47₹75,906.90
Net Current Asset-₹15,433.96-₹8,389.45-₹16,475.04-₹14,800.75
Non-Current Liabilities₹20,070.50₹26,084.87₹36,934.59₹36,632.09
Equity Capital₹80,960.09₹74,674.80₹51,996.34₹51,645.48
Total Equity & Liabilities₹187,994.54₹172,992.97₹160,833.40₹164,184.47
* All values are in INR Crore
Qty
Bid
0
0
0
0
0
0
0
0
0
0
Ask
Qty
308.15
1601
0
0
0
0
0
0
0
0
Bid Total: 0
Ask Total: 1601
Buy orders: 0%
Sell orders: 100%
Bearish
2
Neutral
6
Bullish
0
Slightly Bearish
by SEBI experts
Expert Pick
EXPPICK
Stop-loss
Entry price
Target
Indicator
Value
Verdict

RSI (14)
53.17
Neutral

ATR (14)
8.09
Neutral

STOCH(9,6)
39.81
Neutral

STOCH RSI (14)
32.96
Neutral

ADX(9)
20.58
Bearish

UO(9)
42.67
Neutral

ROC(12)
-1.27
Bearish

WillR(14)
-61.56
Neutral
Period
Simple value
Exponential vaue

5D
305.43
307.48

10D
307.64
307.06

20D
303.96
305.2

50D
301.39
305.25

100D
317.22
314.39

About BPCL

BPCL logo
ISIN
INE029A01011
Sector Market Cap
₹ 1,34,689 Cr

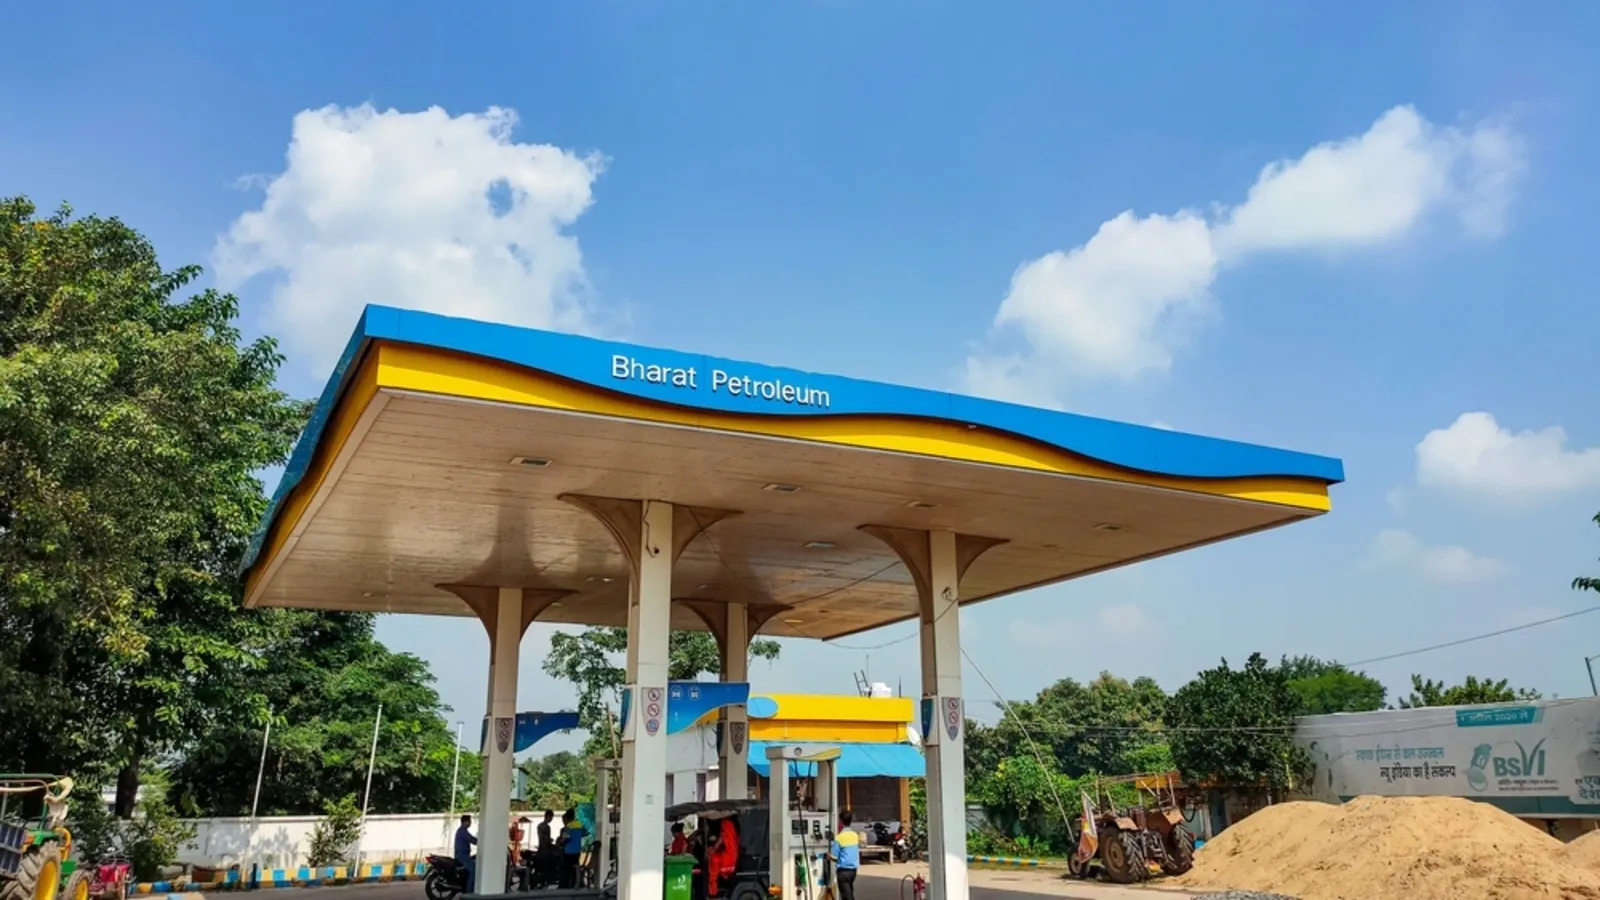
Bharat Petroleum Corporation Limited (BPCL) is a Maharatna public sector undertaking under the Ministry of Petroleum and Natural Gas. BPCL, with a market capitalisation of ₹97,399 crore, owns around 21,000 fuel station networks across India today.

Bharat Petroleum traces its journey to the early 1900s. What began as an oil and gas company has transformed into a Fortune 500 conglomerate.

It all began when Shell Transport, Royal Dutch and Paris Rothschilds joined forces to establish the Asiatic Petroleum Company (APC) in the early 1900s to market petroleum products in South Asia. In 1928, Asiatic Petroleum (India) collaborated with the Burmah Oil Company, a producer, refiner and distributor of petroleum products, particularly in Indian and Burmese markets, to form the Burmah-Shell Oil Storage and Distributing Company of India Limited.

Initially, Burmah Shell focused on importing and marketing kerosene. In the mid-1950s, Burmah Shell introduced LPG as a cooking fuel to Indian homes. In 1951, Burmah Shell embarked on building a refinery in Mahul, Maharashtra, under an agreement with the government. On January 24, 1976, the Government of India took over Burmah Shell, leading to the formation of Bharat Refineries Limited, later renamed Bharat Petroleum Corporation Limited.

Business operations

BPCL has refineries in Mumbai, Kochi and Bina, and an under-construction facility in Odisha.

The Mumbai refinery is a compact lube refinery located in the heart of the city. It can process 12 million tons of crude, with lowest SOx emission and lowest specific energy and water consumption in industry.

Massive expansion and upgradation of the Kochi refinery has catapulted its capacity to 15.5 MMTPA, making it the largest public sector refinery in the country.

The Mumbai and Kochi refineries together achieved best ever capacity utilisation of over 100% consistently. These refineries processed 96 different types of crudes from all six continents in the world.

The Bina refinery, located in Sagar district of Madhya Pradesh, has a capacity of 7.8 million metric tonnes per year. This refinery started as Bharat Oman Refinery Limited (BORL) and meets the demand of markets in north India. BPCL is also setting up a second-generation biofuel refinery in Odisha’s Bargarh district. The plant would be using rice straw to produce ethanol for mixing in petrol. Once functional, the plant will produce 100 kilolitres per day of 1G ethanol (ethanol from rice grain) and a similar volume of 2G ethanol (ethanol from rice straw).

BPCL marked its entry into the electric vehicle charging sector with the launch of its first station in Nagpur, Maharashtra, in 2018. To expand its EV charging infrastructure, in December 2023, the company signed an MoU with a Tata Motors subsidiary to install 7,000 EV charging points across India by 2024.

BPCL has also initiated the development of over 90 EV fast-charging highway corridors. This initiative will ensure the availability of fast-charging stations at about every 100 kilometres on both sides of highways. BPCL’s share price has surged nearly 14% in the last three years.

BPCL Financial Highlights

  • Revenue: BPCL reported revenue of ₹4,58,526.79 crore in FY26 vs ₹4,42,956.58 crore in FY25. It showed an increase of 3.52% on a yearly basis.
  • Operating Profit: BPCL reported an operating profit of ₹34,791.24 crore in FY26 vs ₹18,182.30 crore in FY25. It showed an increase of 91.35% on a year-on-year basis.
  • Net Profit: BPCL reported a net profit of ₹25,843.45 crore in FY26 vs ₹13,336.55 crore in FY25. It showed an increase of 93.78% on a yearly basis.

BPCL Quarterly Result Highlights

  • BPCL reported revenue of ₹1,19,651.49 crore in Mar 2026, compared with ₹1,19,675.10 crore in Dec 2025, representing a decrease of 0.02% on a quarter-on-quarter (QoQ) basis.
  • BPCL reported an operating profit of ₹7,837.77 crore in Mar 2026, compared with ₹9,737.19 crore in Dec 2025, representing a decrease of 19.51% on a quarter-on-quarter (QoQ) basis.
  • BPCL reported a profit of ₹5,624.54 crore in Mar 2026, compared with ₹7,188.40 crore in Dec 2025, reflecting a decrease of 21.76% on a QoQ basis.
  • The earnings per share (EPS) of BPCL stood at ₹31.21 during Mar 2026.
Know more
Promoters
52.98%
FII
19.58%
Other DII
10.39%
Retail and other
8.92%
Mutual funds
8.14%
Foreign institutions - FII
Compare against other stocks
BPCL logo
BPCL
Refineries
Add Stock
Add Another

FAQs on BPCL Share Price