Logo

GANDHAR OIL REFINE IND L Share Price

NSE: GANDHAR
|
Lubricants
₹ 186.73
-₹0.11 (-0.06%)
1D
Last updated 03 Jul, 2026, 15:51 IST

GANDHAR OIL REFINE IND L Share Price Today

As of 5 Jul 2026, GANDHAR OIL REFINE IND L share price is ₹186.73. The stock opened at ₹186.70, compared to its previous close of ₹186.84. During today's trading session, GANDHAR OIL REFINE IND L share price moved in the range of ₹184.00 to ₹188.01, with an average price of ₹186.00 for the day. Looking at its last 52-week, the stock has touched a low of ₹115.00 and a high of ₹188.89. On the performance front, GANDHAR OIL REFINE IND L share price has increased by 23.04% over the last six months and is up 9.01% on a year-on-year basis.


₹184.00
0.06% down today
₹188.01
1D LOW
1D HIGH

GANDHAR OIL REFINE IND L Returns Calculator

Open
₹186.70
High
₹188.01
Low
₹184.00
Prev. close
₹186.84

Circuit
L
H
₹149.39
₹224.07
52-week
L
H
₹115.00
₹188.89

GANDHAR OIL REFINE IND L Shareholder Returns

GANDHAR OIL REFINE IND L Share Price History

Mkt Cap Cr
1,830.35

P/E
13.34

P/B
1.35

ROE
10.01%

D/E
0.07

ROCE
13.08%

Div. Yield
0.40%

EPS(TTM)
14.14
Turnover
2.45

EV/EBITDA
8.02

Net Margin
0.00%

Op. Margin
0.00%

ROA
6.17%

Quick Ratio
0.00

Curr. Ratio
3.04
Based on fundamentals, this stock's
Step 5 of 5
Performance
Excellent
Gandhar Oil Ref. outperforming all market indices
Step 3 of 5
Valuation
Fairly Valued
Gandhar Oil Ref. appears to be fairly valued compared to its peers
Step 5 of 5
Earnings
Excellent
Gandhar Oil Ref. revenue, operating profit and net profit are growing
Peer Comparison
Peer comparison — key ratios
NameMkt Cap CrP/EP/BROED/EROCEBook ValueDiv. YieldTurnoverEPS(TTM)
Reliance17,64,370.0022.522.0110.94%0.3910.58%3.210.45%0.6532.40
IOC2,00,098.004.580.9119.18%0.6018.43%145.100.88%3.0526.72
Bharat Petroleum Corp1,34,689.005.211.3425.80%0.2224.02%219.662.38%4.5654.54
Hindustan Petroleum Corp85,038.404.711.3027.53%0.8822.06%281.266.07%4.4980.72
MRPL26,306.5013.671.8513.56%1.0816.43%80.832.66%4.1311.02
Chennai Petroleum Corp16,875.405.441.5227.93%0.1831.74%725.265.47%6.27205.62

GANDHAR OIL REFINE IND L Financials

Full statement

Income Statement · Consolidated

Income Statement · Consolidated — all values in INR Crore
ParticularsMar 2025Mar 2024Mar 2023Mar 2022
Revenue₹3,896.92₹4,113.21₹4,079.03₹3,543.37
Other Income₹13.00₹9.89₹23.99₹25.59
Total Revenue₹3,909.92₹4,123.10₹4,103.03₹3,568.96
Total Expenses₹3,795.58₹3,912.80₹3,831.17₹3,344.24
Profit Before Tax₹114.23₹210.30₹271.86₹225.23
Tax₹30.74₹44.99₹57.93₹61.65
Profit After Tax₹83.50₹165.32₹213.93₹163.58
EPS - Basic₹8.18₹16.27₹23.86₹18.42
EPS - Diluted₹8.18₹16.27₹23.86₹18.42

Cash Flow · Consolidated

Cash Flow · Consolidated — all values in INR Crore
ParticularsMar 2025Mar 2024Mar 2023Mar 2022
Profit before tax₹114.23₹210.30₹271.86₹225.23
Income before WC changes₹182.00₹279.67₹315.88₹275.57
Change in Assets-₹65.84-₹130.92-₹264.49-₹52.32
Change in Liabilities-₹70.54-₹170.59₹97.78-₹0.19
Change in WC-₹136.38-₹301.51-₹166.71-₹52.50
Cash flow from Operations₹14.71-₹69.34₹87.93₹166.65
Cash flow from Investing-₹48.10-₹65.92-₹72.19-₹115.96
Cash flow from Financing₹12.55₹159.84-₹28.57-₹4.13
Total Cash Flow-₹20.83₹24.58-₹12.83₹46.57
Cash (Start of the year)₹71.43₹46.85₹59.68₹13.11
Cash (End of the year)₹50.60₹71.43₹46.85₹59.68

Balance Sheet · Consolidated

Balance Sheet · Consolidated — all values in INR Crore
ParticularsMar 2025Mar 2024Mar 2023Mar 2022
Non-Current Assets₹469.60₹387.93₹376.63₹256.63
Current Assets₹1,489.49₹1,552.07₹1,255.14₹1,061.58
Total Assets₹1,959.09₹1,939.99₹1,631.77₹1,318.21
Current Liabilities₹511.86₹616.13₹781.35₹693.16
Net Current Asset₹977.64₹935.94₹473.79₹368.42
Non-Current Liabilities₹158.31₹100.26₹72.11₹64.34
Equity Capital₹1,288.93₹1,223.61₹778.31₹560.71
Total Equity & Liabilities₹1,959.09₹1,939.99₹1,631.77₹1,318.21

Income Statement · Standalone

Income Statement · Standalone — all values in INR Crore
ParticularsMar 2025Mar 2024Mar 2023Mar 2022
Revenue₹3,160.26₹2,841.74₹2,920.72₹2,924.53
Other Income₹14.86₹17.18₹25.49₹65.12
Total Revenue₹3,175.11₹2,858.92₹2,946.21₹2,989.65
Total Expenses₹3,069.66₹2,695.30₹2,718.92₹2,731.95
Profit Before Tax₹105.45₹163.62₹227.30₹258.21
Tax₹30.16₹44.91₹57.77₹61.61
Profit After Tax₹75.29₹118.71₹169.53₹196.61
EPS - Basic₹7.69₹13.75₹21.19₹24.58
EPS - Diluted₹7.69₹13.75₹21.19₹24.58

Cash Flow · Standalone

Cash Flow · Standalone — all values in INR Crore
ParticularsMar 2025Mar 2024Mar 2023Mar 2022
Profit before tax₹105.45₹163.62₹227.30₹258.21
Income before WC changes₹154.58₹204.05₹268.50₹243.89
Change in Assets-₹75.24-₹179.25-₹76.92-₹24.26
Change in Liabilities-₹54.78-₹60.79-₹77.58-₹44.45
Change in WC-₹130.02-₹240.05-₹154.50-₹68.72
Cash flow from Operations-₹5.72-₹83.49₹52.43₹117.30
Cash flow from Investing-₹42.56-₹29.45-₹39.60₹26.89
Cash flow from Financing₹35.88₹162.99-₹48.34-₹114.67
Total Cash Flow-₹12.40₹50.05-₹35.52₹29.53
Cash (Start of the year)₹52.56₹2.51₹38.02₹8.50
Cash (End of the year)₹40.16₹52.56₹2.51₹38.02

Balance Sheet · Standalone

Balance Sheet · Standalone — all values in INR Crore
ParticularsMar 2025Mar 2024Mar 2023Mar 2022
Non-Current Assets₹392.01₹314.39₹266.46₹169.54
Current Assets₹1,196.02₹1,237.70₹904.33₹922.10
Total Assets₹1,588.03₹1,552.09₹1,170.79₹1,091.64
Current Liabilities₹317.08₹398.09₹443.33₹546.95
Net Current Asset₹878.94₹839.62₹461.00₹375.15
Non-Current Liabilities₹97.44₹41.69₹23.72₹10.62
Equity Capital₹1,173.51₹1,112.31₹703.74₹534.07
Total Equity & Liabilities₹1,588.03₹1,552.09₹1,170.79₹1,091.64
* All values are in INR Crore
Qty
Bid
5467
186.73
0
0
0
0
0
0
0
0
Ask
Qty
0
0
0
0
0
0
0
0
0
0
Bid Total: 5467
Ask Total: 0
Buy orders: 100%
Sell orders: 0%
Bearish
4
Neutral
3
Bullish
1
Slightly Bearish
by SEBI experts
Expert Pick
EXPPICK
Stop-loss
Entry price
Target
Indicator
Value
Verdict

RSI (14)
69.16
Neutral

ATR (14)
8.47
Neutral

STOCH(9,6)
86.96
Bearish

STOCH RSI (14)
89.65
Bearish

ADX(9)
57.07
Bearish

UO(9)
49.73
Neutral

ROC(12)
18.33
Bullish

WillR(14)
-6.51
Bearish
Period
Simple value
Exponential vaue

5D
184.11
184.14

10D
181.21
180

20D
170.36
173.42

50D
158.7
161.96

100D
148.17
153.75

About GANDHAR OIL REFINE IND L

GANDHAR OIL REFINE IND L logo
ISIN
INE717W01049
Sector Market Cap
₹ 1,830.35 Cr

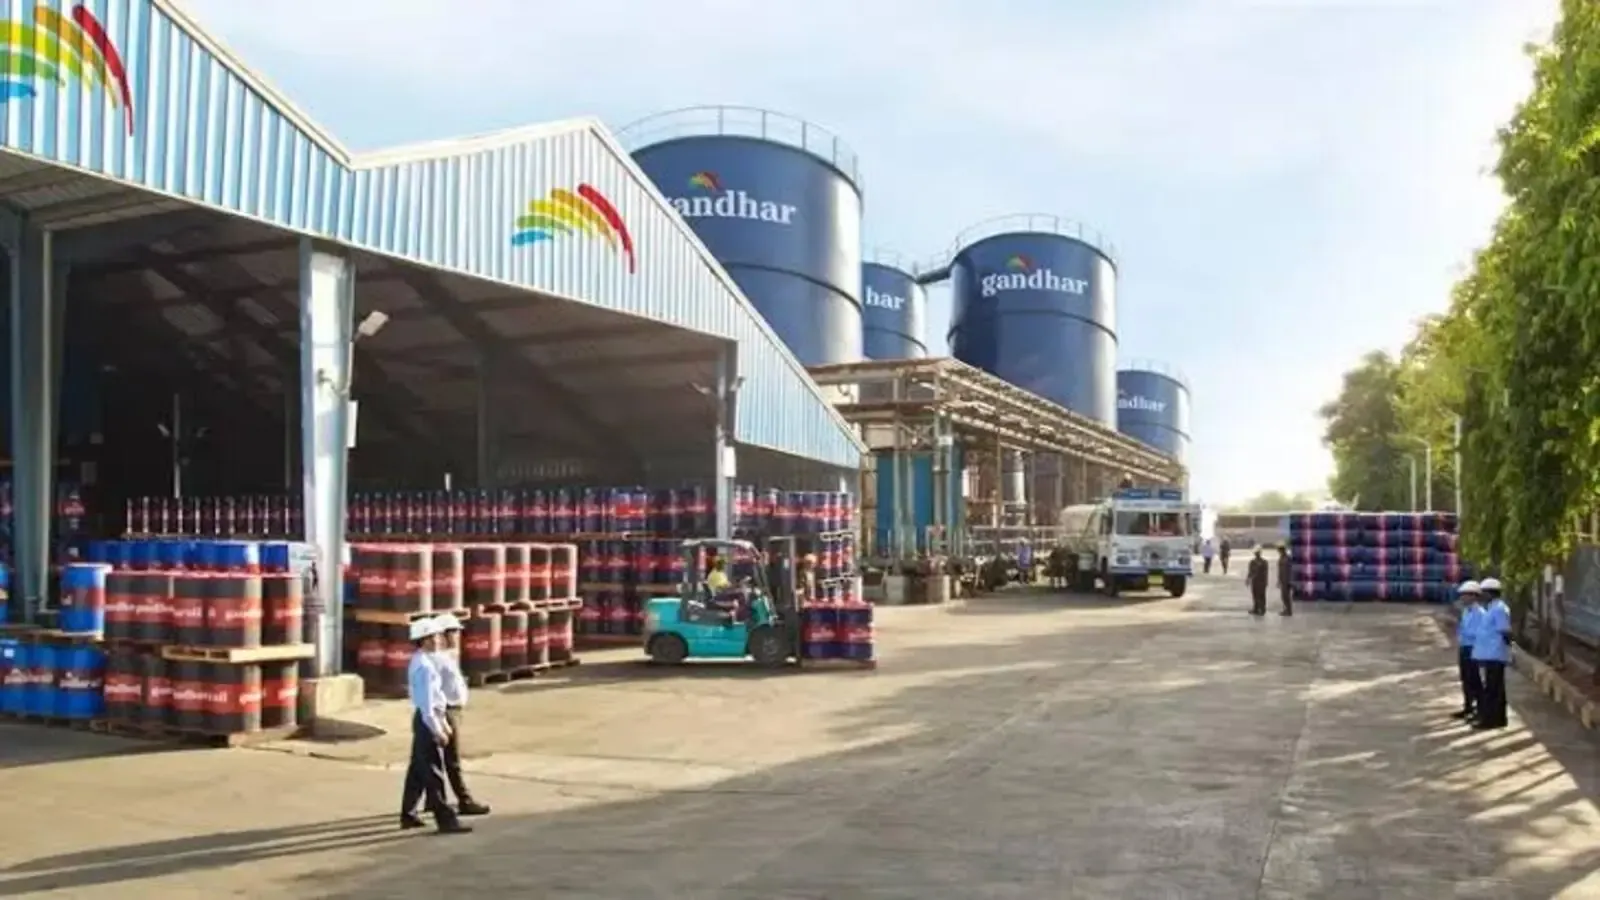
Gandhar Oil Refinery (India) Limited is an India-based company, which is engaged in the specialty oil industry. The Company manufactures and trades petroleum products / specialty oils, trading in non-coking coal and provides consignment / del-credere agency services for the sale of polymers to local markets. It manufactures white oils and other allied products that have applications in cosmetics, healthcare, and pharmaceuticals. Its products category includes industrial oil, which includes lube oil, hydraulic oil, and spark erosion oil; automotive oil, which includes agricultural oil and CNG engine oil; mineral oil & petroleum jelly, which include spray oil and white petroleum jelly, and rubber process oil. Its products are marketed under the Divyol brand. It operates three manufacturing facilities in Taloja (Maharashtra), Silvassa (Dadra and Nagar Haveli), and Sharjah (UAE). Its subsidiaries include Gandhar Shipping & Logistics Pvt. Ltd., Gandhar Foundation, and Texol Lubritech FZC.

GANDHAR OIL REFINE IND L Financial Highlights

  • Revenue: GANDHAR OIL REFINE IND L reported revenue of ₹4,254.60 crore in FY26 vs ₹3,909.93 crore in FY25. It showed an increase of 8.82% on a yearly basis.
  • Operating Profit: GANDHAR OIL REFINE IND L reported an operating profit of ₹180.54 crore in FY26 vs ₹114.25 crore in FY25. It showed an increase of 58.02% on a year-on-year basis.
  • Net Profit: GANDHAR OIL REFINE IND L reported a net profit of ₹137.25 crore in FY26 vs ₹83.52 crore in FY25. It showed an increase of 64.33% on a yearly basis.

GANDHAR OIL REFINE IND L Quarterly Result Highlights

  • GANDHAR OIL REFINE IND L reported revenue of ₹1,097.57 crore in Mar 2026, compared with ₹1,170.64 crore in Dec 2025, representing a decrease of 6.24% on a quarter-on-quarter (QoQ) basis.
  • GANDHAR OIL REFINE IND L reported an operating profit of ₹52.48 crore in Mar 2026, compared with ₹45.14 crore in Dec 2025, representing an increase of 16.26% on a quarter-on-quarter (QoQ) basis.
  • GANDHAR OIL REFINE IND L reported a profit of ₹37.05 crore in Mar 2026, compared with ₹34.33 crore in Dec 2025, reflecting an increase of 7.92% on a QoQ basis.
  • The earnings per share (EPS) of GANDHAR OIL REFINE IND L stood at ₹8.18 during Mar 2026.
Know more
Promoters
66.47%
FII
0.14%
Other DII
0.09%
Retail and other
33.30%
Mutual funds
0.00%
Foreign institutions - FII
Compare against other stocks
GANDHAR OIL REFINE IND L logo
GANDHAR OIL REFINE IND L
Lubricants
Add Stock
Add Another

FAQs on GANDHAR OIL REFINE IND L Share Price