Logo

CLEAN MAX ENVIRO EN SOL L Share Price

₹ 1,256.70
-₹85.40 (-6.36%)
1D
Last updated 03 Jul, 2026, 15:53 IST

₹1,244.00
6.36% down today
₹1,375.00
1D LOW
1D HIGH

CLEAN MAX ENVIRO EN SOL L Returns Calculator

Open
₹1,375.00
High
₹1,375.00
Low
₹1,244.00
Prev. close
₹1,342.10

Circuit
L
H
₹1,005.40
₹1,508.00
52-week
L
H
₹727.10
₹1,536.00

CLEAN MAX ENVIRO EN SOL L Shareholder Returns

CLEAN MAX ENVIRO EN SOL L Share Price History

Mkt Cap Cr
15,744.60

P/E
184.00

P/B
3.39

ROE
2.03%

D/E
0.38

ROCE
5.22%

Div. Yield
0.00%

EPS(TTM)
74.17
Turnover
0.81

EV/EBITDA
19.79

Net Margin
0.00%

Op. Margin
0.00%

ROA
0.37%

Quick Ratio
0.00

Curr. Ratio
1.01
Based on fundamentals, this stock's
Step 5 of 5
Performance
Excellent
Clean Max Enviro outperforming all market indices
Step 1 of 5
Valuation
Overvalued
Clean Max Enviro appears overvalued compared to its peers
Step 5 of 5
Earnings
Excellent
Clean Max Enviro revenue, operating profit and net profit are growing
Peer Comparison
Peer comparison — key ratios
NameMkt Cap CrP/EP/BROED/EROCEBook ValueDiv. YieldTurnoverEPS(TTM)
Adani Power4,33,134.0022.604.6821.39%0.8516.60%5.690.00%0.435.67
NTPC3,47,480.0012.611.7113.31%1.098.02%180.342.51%0.5123.89
Power Grid Corp2,68,043.0016.822.6715.85%1.488.81%107.444.68%0.1717.12
Adani Green2,56,185.0080.446.8913.72%1.857.96%8.920.00%0.593.59
Adani Energy Solution1,86,980.0049.174.4910.08%0.469.53%5.370.00%0.114.75
SIEMENS ENERGY INDIA LTD1,26,384.0093.8125.2925.11%0.0331.50%123.030.13%0.8630.89
Tata Power1,20,241.0032.283.1213.59%1.269.58%6.820.66%0.323.52
JSW Energy1,03,674.0037.052.769.51%0.538.34%3.510.42%0.094.92
NHPC80,952.9019.191.959.09%1.115.23%39.792.00%0.123.60
NTPC GREEN ENERGY LIMITED81,280.40155.584.292.76%0.482.95%22.420.00%0.060.48

CLEAN MAX ENVIRO EN SOL L Financials

Full statement

Income Statement · Consolidated

Income Statement · Consolidated — all values in INR Crore
ParticularsMar 2025Mar 2024Mar 2023Mar 2022
Revenue₹1,495.70₹1,389.84₹929.58₹701.73
Other Income₹114.64₹35.47₹31.40₹21.59
Total Revenue₹1,610.34₹1,425.31₹960.98₹723.32
Total Expenses₹1,558.15₹1,409.65₹889.90₹659.16
Profit Before Tax₹52.20₹4.89-₹18.11₹51.73
Tax₹40.32₹43.84₹43.32₹21.87
Profit After Tax₹11.88-₹38.95-₹61.43₹29.86
EPS - Basic₹2.88-₹3.94-₹9.01₹83.98
EPS - Diluted₹2.79-₹3.94-₹9.01₹83.98

Cash Flow · Consolidated

Cash Flow · Consolidated — all values in INR Crore
ParticularsMar 2025Mar 2024Mar 2023Mar 2022
Profit before tax₹52.20₹15.66₹71.08₹51.73
Income before WC changes₹963.37₹741.93₹406.14₹295.49
Change in Assets-₹22.03-₹212.42-₹134.72-₹149.73
Change in Liabilities₹544.81-₹343.27₹670.74₹282.99
Change in WC₹522.77-₹555.69₹536.02₹133.26
Cash flow from Operations₹1,404.20₹86.28₹927.65₹434.01
Cash flow from Investing-₹3,617.05-₹1,938.60-₹3,010.77-₹1,033.83
Cash flow from Financing₹2,481.24₹1,788.78₹2,144.33₹582.50
Total Cash Flow₹268.39-₹63.55₹61.21-₹17.32
Cash (Start of the year)₹49.62₹113.17₹51.95₹69.27
Cash (End of the year)₹328.59₹49.62₹113.17₹51.95

Balance Sheet · Consolidated

Balance Sheet · Consolidated — all values in INR Crore
ParticularsMar 2025Mar 2024Mar 2023Mar 2022
Non-Current Assets₹11,410.08₹8,069.94₹6,040.70₹3,127.26
Current Assets₹1,869.17₹1,006.61₹959.44₹642.04
Total Assets₹13,279.25₹9,076.55₹7,000.14₹3,769.30
Current Liabilities₹2,450.57₹1,285.44₹1,629.26₹725.67
Net Current Asset-₹581.40-₹278.84-₹669.82-₹83.63
Non-Current Liabilities₹7,623.91₹5,557.13₹3,902.12₹1,660.71
Equity Capital₹3,204.77₹2,233.98₹1,468.76₹1,382.92
Total Equity & Liabilities₹13,279.25₹9,076.55₹7,000.14₹3,769.30

Income Statement · Standalone

Income Statement · Standalone — all values in INR Crore
ParticularsMar 2024Mar 2023Mar 2022Mar 2021
Revenue₹2,106.38₹2,776.02₹927.22₹812.38
Other Income₹132.75₹66.43₹42.33₹18.98
Total Revenue₹2,239.14₹2,842.45₹969.55₹831.36
Total Expenses₹1,839.23₹2,544.11₹871.60₹781.89
Profit Before Tax₹389.14₹209.15₹85.52₹49.47
Tax₹106.73₹77.17₹23.36₹12.52
Profit After Tax₹282.41₹131.98₹62.16₹36.95
EPS - Basic₹638.66₹357.90₹225.48₹487.44
EPS - Diluted₹598.71₹348.87₹220.67₹487.44

Cash Flow · Standalone

Cash Flow · Standalone — all values in INR Crore
ParticularsMar 2024Mar 2023Mar 2022Mar 2021
Profit before tax₹399.91₹298.34₹97.95₹49.47
Income before WC changes₹488.60₹377.93₹105.40₹73.34
Change in Assets-₹76.04-₹233.00-₹300.82-₹52.72
Change in Liabilities-₹261.16₹812.27₹218.95₹107.28
Change in WC-₹337.20₹579.28-₹81.87₹54.56
Cash flow from Operations₹58.45₹947.10₹18.50₹124.55
Cash flow from Investing-₹707.16-₹1,552.76-₹473.69-₹32.10
Cash flow from Financing₹635.93₹596.96₹437.47-₹68.01
Total Cash Flow-₹12.78-₹8.71-₹17.72₹24.44
Cash (Start of the year)₹21.21₹29.91₹47.63₹23.19
Cash (End of the year)₹8.42₹21.21₹29.91₹47.63

Balance Sheet · Standalone

Balance Sheet · Standalone — all values in INR Crore
ParticularsMar 2024Mar 2023Mar 2022Mar 2021
Non-Current Assets₹3,788.87₹2,974.21₹1,277.93₹932.85
Current Assets₹1,140.63₹1,074.59₹938.35₹496.18
Total Assets₹4,929.49₹4,048.80₹2,216.27₹1,429.03
Current Liabilities₹1,243.80₹1,606.58₹593.44₹379.70
Net Current Asset-₹103.18-₹531.99₹344.90₹116.49
Non-Current Liabilities₹1,207.49₹888.36₹217.74₹890.29
Equity Capital₹2,478.21₹1,553.87₹1,405.09₹159.05
Total Equity & Liabilities₹4,929.49₹4,048.80₹2,216.27₹1,429.03
* All values are in INR Crore
Qty
Bid
0
0
0
0
0
0
0
0
0
0
Ask
Qty
1256.7
348
0
0
0
0
0
0
0
0
Bid Total: 0
Ask Total: 348
Buy orders: 0%
Sell orders: 100%
Bearish
2
Neutral
3
Bullish
3
Slightly Bullish
by SEBI experts
Expert Pick
EXPPICK
Stop-loss
Entry price
Target
Indicator
Value
Verdict

RSI (14)
47.08
Neutral

ATR (14)
91
Neutral

STOCH(9,6)
4.35
Bullish

STOCH RSI (14)
0
Bullish

ADX(9)
29.34
Bearish

UO(9)
34.87
Neutral

ROC(12)
-3.24
Bearish

WillR(14)
-95.65
Bullish
Period
Simple value
Exponential vaue

5D
1314.9
1314.8

10D
1366.97
1329.41

20D
1323.99
1309.09

50D
1222.78
1267.71

100D
1086.87
0

About CLEAN MAX ENVIRO EN SOL L

CLEAN MAX ENVIRO EN SOL L logo
ISIN
INE647U01026
Sector Market Cap
₹ 15,744.6 Cr

CLEAN MAX ENVIRO EN SOL L Financial Highlights

  • Revenue: CLEAN MAX ENVIRO EN SOL L reported revenue of ₹2,075.21 crore in FY26 vs ₹1,610.34 crore in FY25. It showed an increase of 28.87% on a yearly basis.
  • Operating Profit: CLEAN MAX ENVIRO EN SOL L reported an operating profit of ₹134.98 crore in FY26 vs ₹59.75 crore in FY25. It showed an increase of 125.91% on a year-on-year basis.
  • Net Profit: CLEAN MAX ENVIRO EN SOL L reported a net profit of ₹85.58 crore in FY26 vs ₹19.43 crore in FY25. It showed an increase of 340.45% on a yearly basis.

CLEAN MAX ENVIRO EN SOL L Quarterly Result Highlights

  • CLEAN MAX ENVIRO EN SOL L reported revenue of ₹639.58 crore in Mar 2026, compared with ₹466.29 crore in Dec 2025, representing an increase of 37.16% on a quarter-on-quarter (QoQ) basis.
  • CLEAN MAX ENVIRO EN SOL L reported an operating profit of ₹75.26 crore in Mar 2026, compared with ₹6.63 crore in Dec 2025, representing an increase of 1,035.14% on a quarter-on-quarter (QoQ) basis.
  • CLEAN MAX ENVIRO EN SOL L reported a profit of ₹45.40 crore in Mar 2026, compared with ₹21.18 crore in Dec 2025, reflecting an increase of 114.35% on a QoQ basis.
  • The earnings per share (EPS) of CLEAN MAX ENVIRO EN SOL L stood at ₹2.88 during Mar 2026.
Know more
Promoters
49.48%
FII
29.80%
Other DII
12.49%
Retail and other
5.97%
Mutual funds
2.26%
Foreign institutions - FII
Compare against other stocks
CLEAN MAX ENVIRO EN SOL L logo
CLEAN MAX ENVIRO EN SOL L
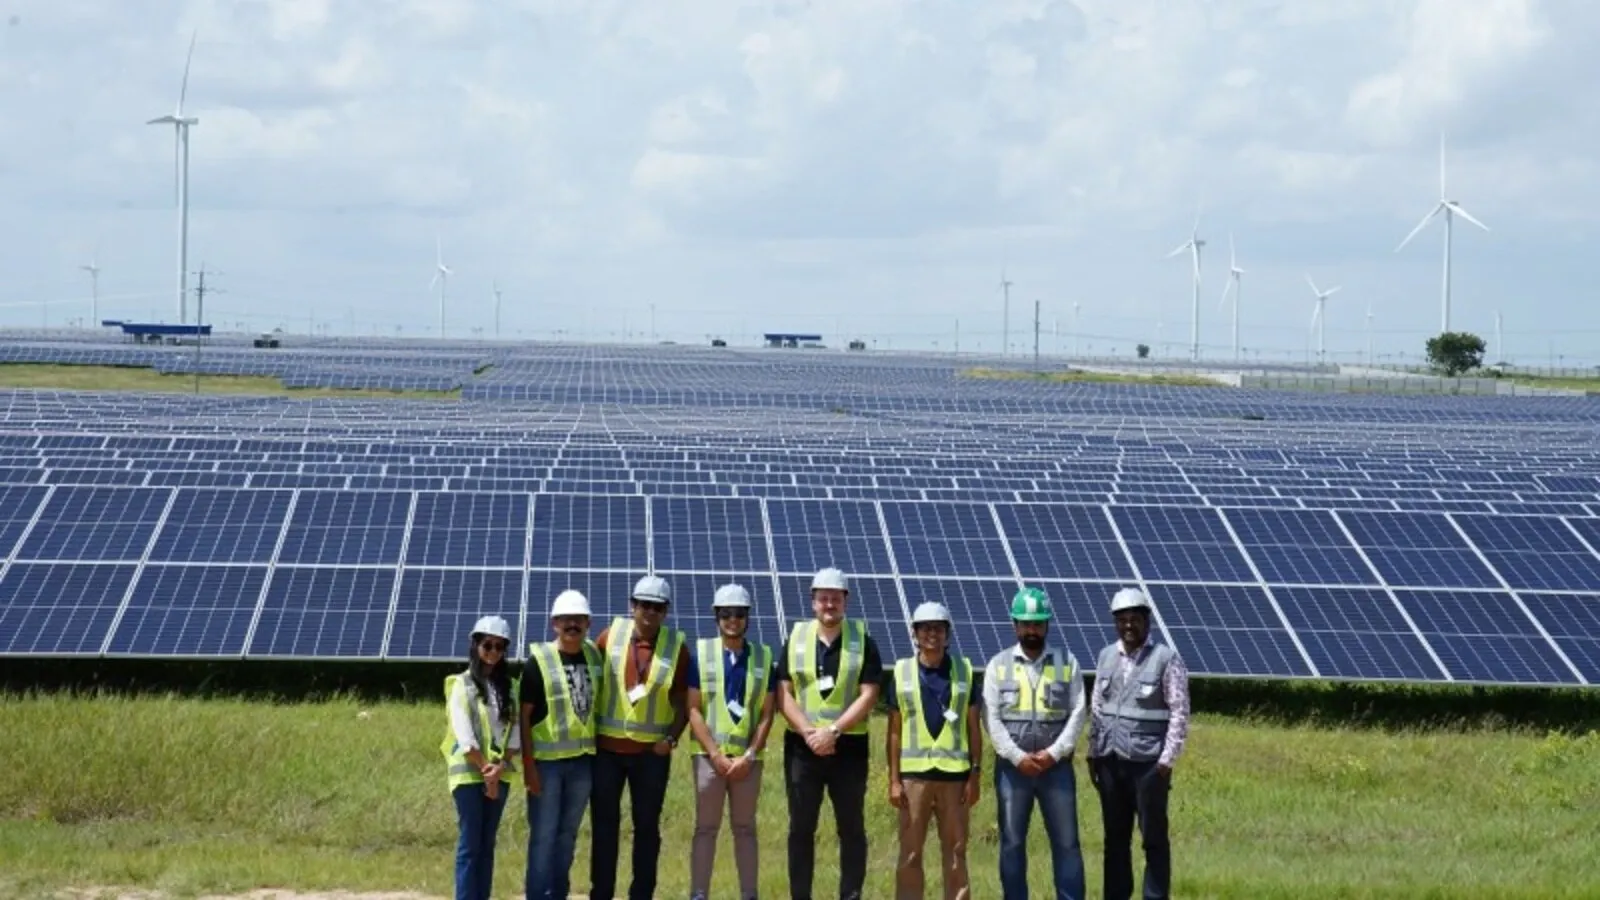
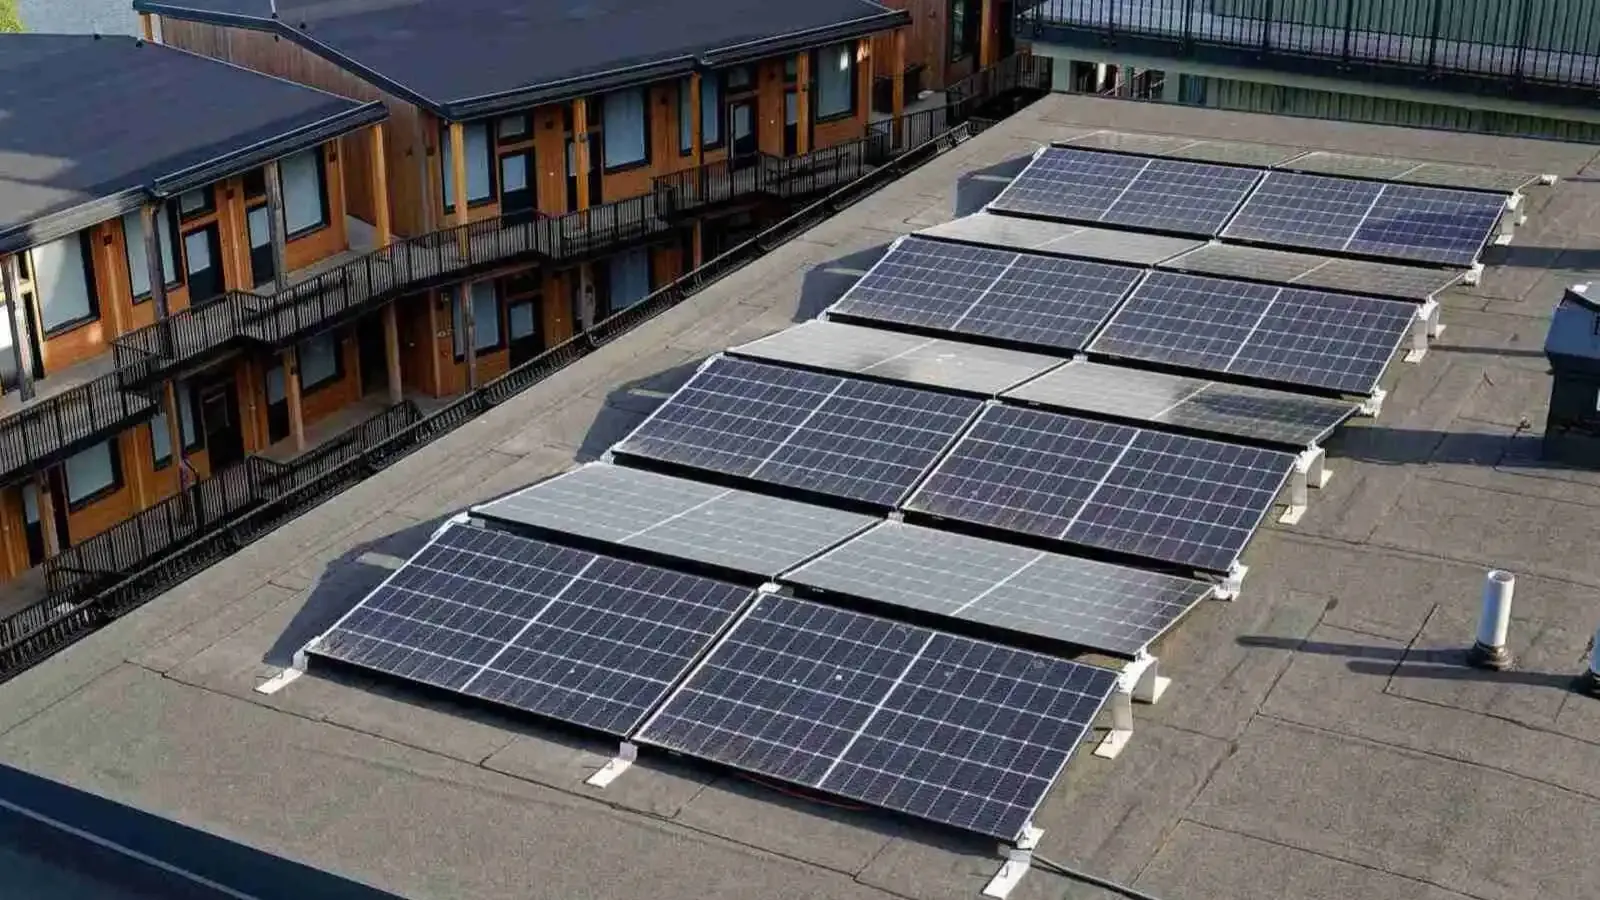
Power Generation & Distribution
Add Stock
Add Another

FAQs on CLEAN MAX ENVIRO EN SOL L Share Price