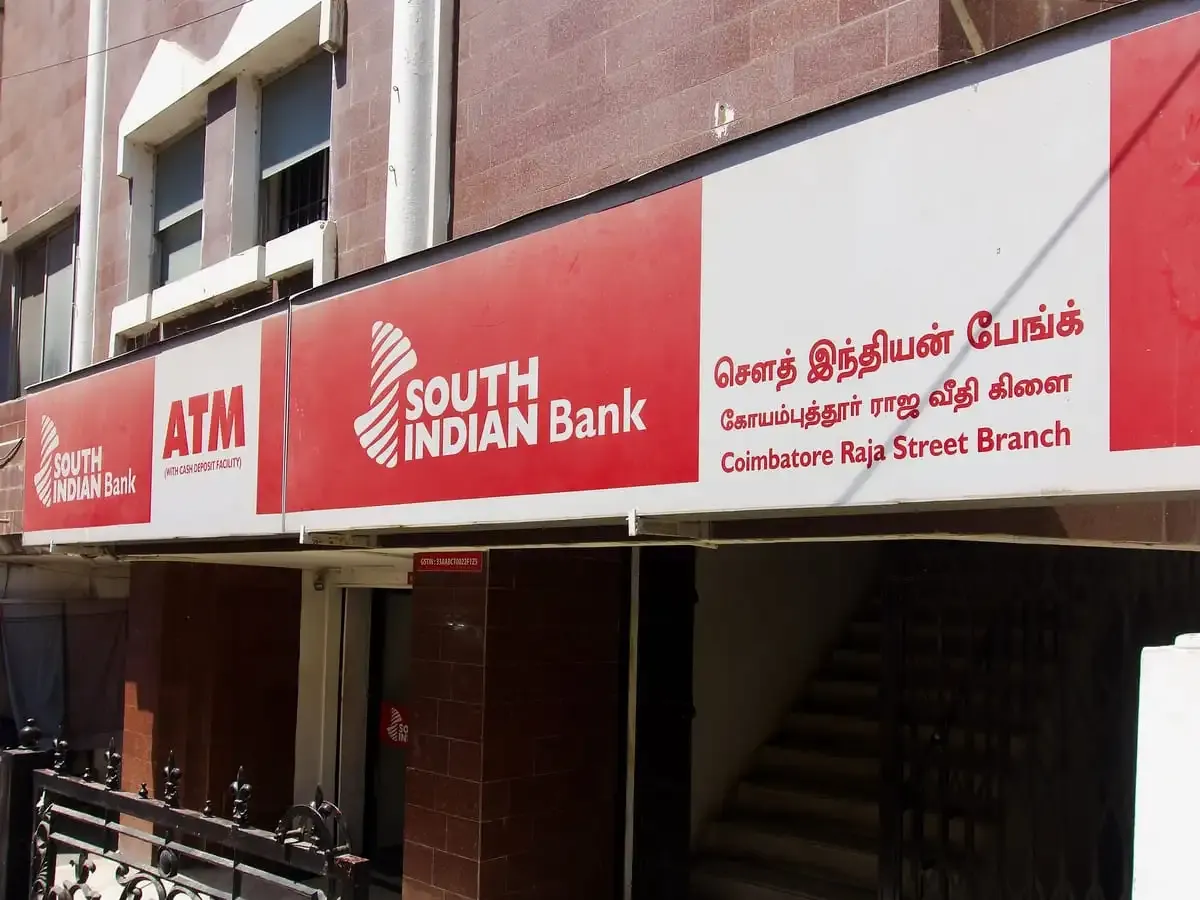
The South Indian Bank Share Price
The South Indian Bank Share Price Today
As of 25 Jul 2026, The South Indian Bank share price is ₹46.52. The stock opened at ₹47.50, compared to its previous close of ₹47.50. During today's trading session, The South Indian Bank share price moved in the range of ₹45.90 to ₹47.50, with an average price of ₹46.70 for the day. Looking at its last 52-week, the stock has touched a low of ₹28.11 and a high of ₹49.90. On the performance front, The South Indian Bank share price has increased by 3.38% over the last six months and is up 55.69% on a year-on-year basis.
The South Indian Bank Returns Calculator
The South Indian Bank Shareholder Returns
The South Indian Bank Share Price History
| Name | Mkt Cap Cr | P/E | P/B | ROE | D/E | ROCE | Book Value | Div. Yield | Turnover | EPS(TTM) |
|---|---|---|---|---|---|---|---|---|---|---|
| HDFC Bank | 11,43,990.00 | 13.86 | 1.90 | 13.61% | 0.00 | — | 375.33 | 2.09% | 0.00 | 48.62 |
| ICICI Bank | 10,28,220.00 | 17.21 | 2.75 | 15.63% | 0.00 | — | 483.51 | 0.84% | 0.00 | 70.21 |
| SBI | 9,34,923.00 | 10.86 | 1.61 | 16.68% | 0.00 | — | 1.77 | 1.77% | 0.00 | 87.59 |
| Kotak Mahindra Bank | 3,82,675.00 | 18.80 | 2.11 | 11.17% | 0.00 | — | 135.91 | 0.17% | 0.00 | 14.09 |
| Axis Bank | 3,80,470.00 | 13.62 | 1.72 | 12.50% | 0.00 | — | 680.45 | 0.08% | 0.00 | 78.82 |
| Union Bank of India | 1,30,153.00 | 6.31 | 0.98 | 14.33% | 0.00 | — | 166.85 | 2.97% | 0.00 | 24.49 |
| PNB | 1,26,940.00 | 5.73 | 0.87 | 13.18% | 0.00 | — | 120.20 | 2.72% | 0.00 | 14.71 |
| Bank of Baroda | 1,27,526.00 | 6.93 | 0.76 | 11.56% | 0.00 | — | 296.26 | 3.45% | 0.00 | 38.72 |
| Canara Bank | 1,13,610.00 | 6.27 | 1.01 | 18.03% | 0.00 | — | 0.99 | 3.40% | 0.00 | 21.15 |
| Indian Bank | 1,11,529.00 | 8.71 | 1.45 | 14.95% | 0.00 | — | 556.83 | 2.20% | 0.00 | 90.24 |
The South Indian Bank Financials
Income Statement · Consolidated
| Particulars | Mar 2025 | Mar 2024 | Mar 2023 | Mar 2022 |
|---|---|---|---|---|
| Other Income | ₹1,812.98 | ₹1,514.52 | ₹811.37 | ₹1,033.90 |
| Total Revenue | ₹11,226.29 | ₹10,127.33 | ₹8,044.55 | ₹7,620.43 |
| Total Expenses | ₹9,469.23 | ₹8,598.43 | ₹6,936.05 | ₹7,712.66 |
| Profit Before Tax | ₹1,757.06 | ₹1,528.91 | ₹1,108.50 | -₹92.22 |
| Tax | ₹453.97 | ₹458.71 | ₹333.19 | -₹137.03 |
| Profit After Tax | ₹1,303.09 | ₹1,070.20 | ₹775.31 | ₹44.81 |
| EPS - Basic | ₹4.98 | ₹5.01 | ₹3.49 | ₹0.21 |
| EPS - Diluted | ₹4.98 | ₹5.09 | ₹3.49 | ₹0.21 |
Cash Flow · Consolidated
| Particulars | Mar 2025 | Mar 2024 | Mar 2023 | Mar 2022 |
|---|---|---|---|---|
| Profit before tax | ₹1,757.07 | ₹1,528.90 | ₹1,108.50 | -₹92.22 |
| Income before WC changes | ₹2,719.83 | ₹2,333.02 | ₹2,517.70 | ₹2,027.58 |
| Change in Assets | -₹10,329.59 | -₹5,365.46 | -₹12,770.07 | -₹3,247.00 |
| Change in Liabilities | ₹5,598.65 | ₹10,657.86 | ₹3,210.48 | ₹6,424.33 |
| Change in WC | -₹4,730.95 | ₹5,292.40 | -₹9,559.58 | ₹3,177.33 |
| Cash flow from Operations | -₹2,352.95 | ₹7,075.21 | -₹7,260.82 | ₹5,165.34 |
| Cash flow from Investing | ₹4,434.02 | -₹1,985.91 | -₹386.06 | -₹1,740.60 |
| Cash flow from Financing | ₹156.85 | -₹2,147.61 | ₹3,523.93 | -₹989.19 |
| Total Cash Flow | ₹2,237.92 | ₹2,941.69 | -₹4,122.94 | ₹2,435.55 |
| Cash (Start of the year) | ₹10,022.18 | ₹7,080.49 | ₹11,203.43 | ₹8,767.88 |
| Cash (End of the year) | ₹12,260.10 | ₹10,022.18 | ₹7,080.49 | ₹11,203.43 |
Balance Sheet · Consolidated
| Particulars | Mar 2025 | Mar 2024 | Mar 2023 | Mar 2022 |
|---|---|---|---|---|
| Total Assets | ₹124,655.07 | ₹117,412.48 | ₹107,697.16 | ₹100,051.87 |
| Equity Capital | ₹10,108.03 | ₹8,826.34 | ₹6,674.74 | ₹5,854.25 |
| Total Equity & Liabilities | ₹124,655.07 | ₹117,412.48 | ₹107,697.16 | ₹100,051.87 |
Income Statement · Standalone
| Particulars | Mar 2025 | Mar 2024 | Mar 2023 | Mar 2022 |
|---|---|---|---|---|
| Other Income | ₹1,813.43 | ₹1,515.52 | ₹812.63 | ₹1,034.10 |
| Total Revenue | ₹11,226.74 | ₹10,128.32 | ₹8,045.81 | ₹7,620.64 |
| Total Expenses | ₹9,469.84 | ₹8,599.57 | ₹6,937.60 | ₹7,537.06 |
| Profit Before Tax | ₹1,756.90 | ₹1,528.75 | ₹1,108.21 | ₹83.58 |
| Tax | ₹454.01 | ₹458.67 | ₹333.12 | ₹38.60 |
| Profit After Tax | ₹1,302.89 | ₹1,070.08 | ₹775.09 | ₹44.98 |
| EPS - Basic | ₹4.98 | ₹5.10 | ₹3.49 | ₹0.21 |
| EPS - Diluted | ₹4.98 | ₹5.09 | ₹3.49 | ₹0.21 |
Cash Flow · Standalone
| Particulars | Mar 2025 | Mar 2024 | Mar 2023 | Mar 2022 |
|---|---|---|---|---|
| Profit before tax | ₹1,756.89 | ₹1,528.75 | ₹1,108.21 | -₹91.99 |
| Income before WC changes | ₹2,719.42 | ₹2,332.87 | ₹2,517.40 | ₹2,027.81 |
| Change in Assets | -₹10,331.52 | -₹5,368.72 | -₹12,771.61 | -₹3,247.17 |
| Change in Liabilities | ₹5,600.83 | ₹10,661.25 | ₹3,212.04 | ₹6,424.25 |
| Change in WC | -₹4,730.68 | ₹5,292.52 | -₹9,559.57 | ₹3,177.08 |
| Cash flow from Operations | -₹2,352.95 | ₹7,075.21 | -₹7,260.82 | ₹5,165.32 |
| Cash flow from Investing | ₹4,434.03 | -₹1,985.91 | -₹386.06 | -₹1,740.58 |
| Cash flow from Financing | ₹156.85 | -₹2,147.61 | ₹3,523.93 | -₹989.19 |
| Total Cash Flow | ₹2,237.92 | ₹2,941.69 | -₹4,122.94 | ₹2,435.55 |
| Cash (Start of the year) | ₹10,022.18 | ₹7,080.49 | ₹11,203.43 | ₹8,767.88 |
| Cash (End of the year) | ₹12,260.10 | ₹10,022.18 | ₹7,080.49 | ₹11,203.43 |
Balance Sheet · Standalone
| Particulars | Mar 2025 | Mar 2024 | Mar 2023 | Mar 2022 |
|---|---|---|---|---|
| Total Assets | ₹124,655.12 | ₹117,412.79 | ₹107,698.18 | ₹100,052.42 |
| Equity Capital | ₹10,107.66 | ₹8,826.18 | ₹6,674.69 | ₹5,854.42 |
| Total Equity & Liabilities | ₹124,655.12 | ₹117,412.79 | ₹107,698.18 | ₹100,052.42 |
About The South Indian Bank
South Indian Bank was established in 1929 in Thrissur, Kerala. Predominantly present in Kerala and the southern regions of India, the bank is expanding across the country. With 940 locations, three satellite branches and three ultra-small branches, South Indian Bank is growing its nationwide network. The bank’s focus is on corporate, personal, business and agricultural loans. The bank’s branch network covers 26 states and four Union Territories.
South Indian Bank was established during the Swadeshi movement. The bank was established with the objective of freeing the business sector from the clutches of moneylenders. The bank started by offering need-based loans at fair interest rates.
In 1946, South Indian Bank achieved the distinction of becoming the first private sector bank in Kerala to be scheduled under the RBI Act. It was also the first private sector bank in India to open a currency chest on behalf of the RBI in April 1992. South Indian Bank established its first NRI branch in November 1992.
With a market capitalisation of over ₹5,500 crore as of December 29, 2023) South Indian Bank is listed both in the BSE and NSE. South Indian Bank’s share price has gained more than 190% in three years.
In 2020, the bank unveiled six strategic priorities, or the 6Cs, leading to significant initiatives to restructure the control operations, liability and asset verticals.
These strategic priorities include:
Capital Adequacy:
The bank’s primary goal is to increase its capital reserves so that it would have a strong foundation for its future plans. Customer Focus: South Indian Bank uses a phygital approach that combines digital and physical elements at its branches. This approach of the bank is to improve the experience for its customers.
Competency Building:
Realising the value of the contributions made by its young staff members, the bank is investing in initiatives to help them hone their abilities. Cost-To-Income Ratio: One of South Indian Bank’s main priority is to optimise the cost-to-income ratio. By reducing this percentage, the bank seeks to improve both operational and overall financial performance.
CASA:
South Indian Bank wants to improve the portfolio of Customer Acquisition and Savings Accounts (CASA) by providing financial services that align with customer needs.
Compliance:
The bank strives to ensure that its compliance obligations are met out of a strong sense of duty.
The South Indian Bank Financial Highlights
- Revenue: The South Indian Bank reported revenue of ₹11,855.28 crore in FY26 vs ₹11,226.29 crore in FY25. It showed an increase of 5.60% on a yearly basis.
- Operating Profit: The South Indian Bank reported an operating profit of ₹1,956.51 crore in FY26 vs ₹1,757.07 crore in FY25. It showed an increase of 11.35% on a year-on-year basis.
- Net Profit: The South Indian Bank reported a net profit of ₹1,455.64 crore in FY26 vs ₹1,303.10 crore in FY25. It showed an increase of 11.71% on a yearly basis.
The South Indian Bank Quarterly Result Highlights
- The South Indian Bank reported revenue of ₹3,007.40 crore in Jun 2026, compared with ₹2,945.32 crore in Mar 2026, representing an increase of 2.11% on a quarter-on-quarter (QoQ) basis.
- The South Indian Bank reported an operating profit of ₹507.50 crore in Jun 2026, compared with ₹546.53 crore in Mar 2026, representing a decrease of 7.14% on a quarter-on-quarter (QoQ) basis.
- The South Indian Bank reported a profit of ₹377.66 crore in Jun 2026, compared with ₹407.40 crore in Mar 2026, reflecting a decrease of 7.30% on a QoQ basis.
- The earnings per share (EPS) of The South Indian Bank stood at ₹4.98 during Jun 2026.
Similar Stocks
FAQs on The South Indian Bank Share Price
What is The South Indian Bank share price today?
The South Indian Bank share price is ₹46.52 as on 24 Jul, 2026, 15:58 IST.
How has the The South Indian Bank share price performed in the past?
In the last 1 year, The South Indian Bank delivered a return of 55.69%. The The South Indian Bank share price hit a high of ₹49.90 and low of ₹28.11.
How much is the Mutual Fund shareholding in The South Indian Bank shares?
The Mutual Fund Shareholding in The South Indian Bank was 12.83% at the end of Jun 2026.
What is the the 52-week high and low of The South Indian Bank shares ?
The 52-week high and low of The South Indian Bank share is ₹49.90 and ₹28.11 as of 24 Jul, 2026.
What is the market cap of The South Indian Bank?
The market capitalisation of The South Indian Bank is ₹12,181.90 Crores as on 24 Jul, 2026.
What are the stock symbols of The South Indian Bank?
The stock symbol of The South Indian Bank is SOUTHBANK on the NSE, 532218 on the BSE, and the ISIN is INE683A01023.
What was yesterday's closing price of The South Indian Bank shares ?
The South Indian Bank shares closed yesterday at ₹47.50 on NSE & ₹47.51 on BSE
How to buy The South Indian Bank shares?
To buy The South Indian Bank shares, open a demat account with Upstox and complete the KYC process. Once your account is set up, search for the stock and place your order.
Can I buy The South Indian Bank shares on Holidays?
No, shares of The South Indian Bank or any other publicly traded company cannot be bought or sold on holidays when the stock exchanges are closed. You can only buy or sell The South Indian Bank shares on days when the stock exchanges are open for trading. It's important to check the NSE & BSE holidays calendar, before placing any trades to avoid any inconvenience.
What is the PE and PB ratio of The South Indian Bank?
The PE and PB ratio of The South Indian Bank is 8.06 and 1.03 respectively, as on 24 Jul, 2026, 15:58 IST.