Intraday PCR Trend Reversal Strategy

Here is a simple ** intraday trading** setup based on Put Call Ratio(PCR) technique. The chart timeframe for this intraday strategy is 5 minutes.
You can use this setup to trade in equity indices ( ** Nifty 50** and ** Nifty Bank**) along with the stocks that are part of ** futures and options**. With this strategy you can trade in a bullish as well as a bearish market.
We will use Put Call Ratio to look for a trend reversal and a candlestick pattern to confirm the trade reversal and trade accordingly. Hence this strategy is going to be a combination of both PCR and a candlestick pattern.
What is a pull call ratio? It is the ratio of put option writers vis-a-vis call option writers. Put Writers are bullish whereas call writers are bearish. If put writers are more than the call writers then the trend is most likely to be bullish and if the call writers are more than the put writers then the trend is most likely to be bearish. We will see two sets of columns in the option chain one being the ‘open interest’ column and the other being ‘ change in the open interest’ which is also called OI. In our strategy we will be looking at the ‘change in open interest’ numbers and not the ‘open interest’ numbers. The change in open interest number is the number which reflects the daily shift of both call writers and put writers from their respective positions. In short, we are not looking at specific strike price data but all strike prices data
We will be using PCR to identify a trend reversal in the live market and look for a candlestick pattern to confirm the trend reversal and take a trade.
Let’s understand the step by step process as to how we analyze and trade this strategy. At the moment, let's look at a bearish reversal or short only setup.Steps of the setup: We’re analysing the Nifty spot chart in the example below.
Step 1 : We have to follow the PCR trend in the live market. Before looking for a trend reversal, PCR should show us a strong trend first. Once we figure out a trend, we have to look for a trend reversal signal. Our job is to pick this trend reversal signs early and quickly act on it. Let me show you step 1 analysis with the help of an example.

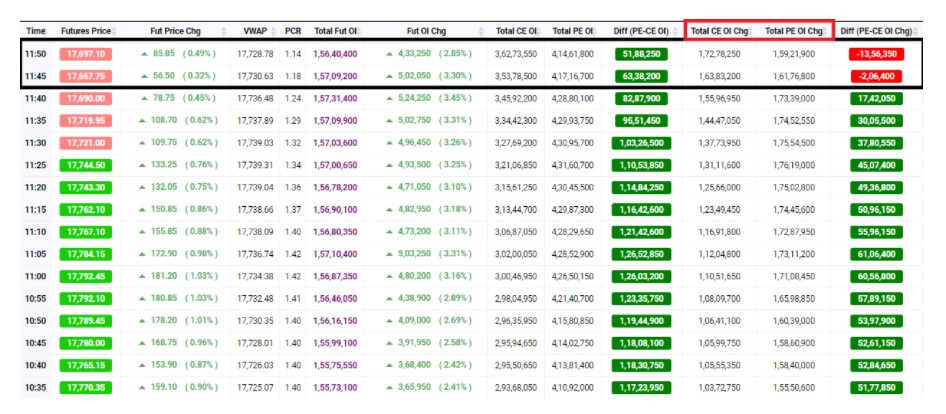
One can check icharts.com for live PCR data. We get live PCR data for every 5 mins. The above chart is of Nifty 17th September (23rd September expiry) PCR data.
We can clearly see how Put writers were dominating from 10.35 am to 11.40 am and were maintaining an edge over call writers. Both call writers and put writers were creating positions but put writers were more aggressive than the call writers.
But something happened between 11.40 am and 11.50 am. Call writers kept creating more positions and put writers started squaring off their existing positions (with open interest going down)
This is a clear case of trend reversal from bullish to bearish. As you can see in the above chart that at Nifty spot 17767, the call writers surpassed the PE writers at 11:45 am.This is what we need to look for in the live market, but this is just one part of the strategy.
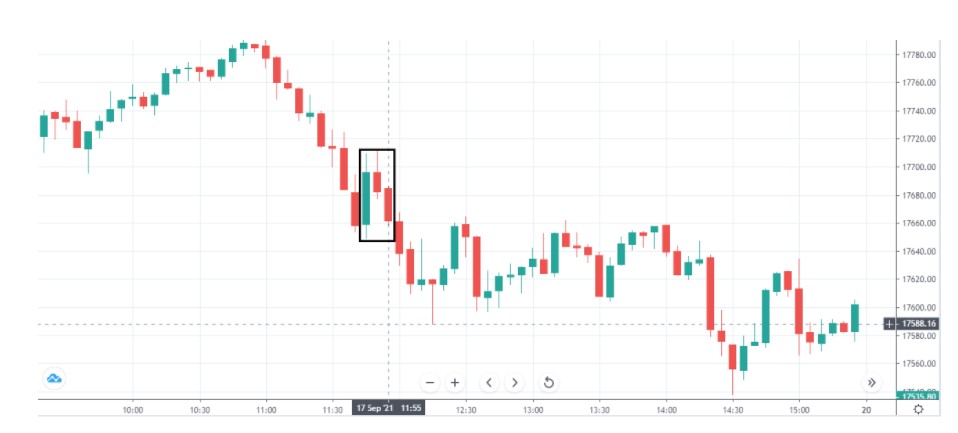
Step 2. We will look at the Nifty spot 17th September 5 minutes chart and spot the bearish candlestick pattern between 11.40 and 11.50 am
- This is the same time where we got our first confirmation of trend reversal by spotting change in PCR. We will look at a price chart on ** Upstox pro web**** platform**.

In the chart above we can see price was already down since 10.35 am and at 11.45 am there was a big green candle(looks like a trap since PCR was showing a different data)
It turned out to be a trap as expected and we got an evening star candle pattern (marked in black box) which confirmed our trend reversal signal.
If we didn’t know how to interpret the PCR or change in Open interest data along with what is happening with price, we would take this as a bullish reversal (since it’s bullish engulfing) and end up losing money. It is always better to have a dual confirmation rather than a single confirmation before taking the trade.
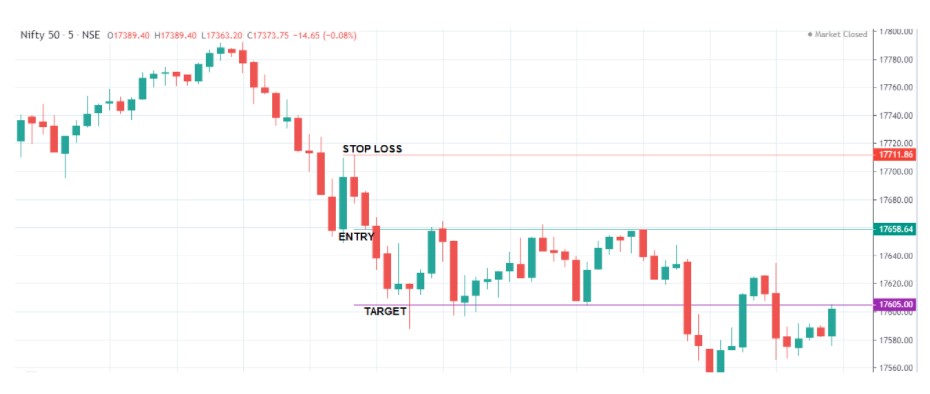
Step 3 : Let's understand with the help of a chart as to what price we execute the trade and keeping in mind our stop loss and when do we exit (target)

You can see the GREEN line (17658.54) that's where the evening star pattern was formed as we previously observed the PCR trend reversal at the same price .That is our entry point. We will execute the setup around those levels at 17658. Since Nifty spot can’t be traded, you can look to trade Nifty futures or Options. If you choose to trade in options, one way to go about it is that you can buy an ATM**(at the money) strike price put option** to trade. The market price is 17658 in our example and the nearest strike price seems to be the 17650** put option. So, the 16650 becomes our ATM(at the money) put option.. Since it’s an intraday setup, you can go for a weekly expiry** rather than a monthly expiry contract.
Coming to stop loss. As you can see the RED line (17711) which is the high of the second candle of the evening star pattern. That's 53 points above the entry point of 17658. If the Nifty goes up and hits 17711 (our stop loss) we will take a small loss and exit from our position.
Since it’s an intraday and a quick trade, the timeframe being 5 minutes, we will aim for a risk to reward of 1:1. In our example the risk being 53 points, we will aim for a target of 53 points from our entry price which comes to 17605 (17658
- 53)
You can see the PURPLE line(17605). Once our price hits 17605, we will exit our 17650 put option position and exit the trade with profit.
We hope this PCR & Candlestick technique strategy was simple and easy to understand.
Majority of times, Derivative analysis along with price action works like a charm.
You might want to know what was the PCR data showing after taking the trade

We got our target hit around 12.15 pm and call writers just didn’t stop creating positions and we can clearly see put writers gave up and started offloading their positions.
I hope this was fun. We’ll come up with an article on how to use the same strategy to identify a bullish setup.
Until then, happy trading!