Ultratech Cement Share Price
Ultratech Cement Share Price Today
As of 25 Jul 2026, Ultratech Cement share price is ₹11,840.00. The stock opened at ₹11,750.00, compared to its previous close of ₹11,908.00. During today's trading session, Ultratech Cement share price moved in the range of ₹11,690.00 to ₹11,899.00, with an average price of ₹11,794.50 for the day. Looking at its last 52-week, the stock has touched a low of ₹10,325.00 and a high of ₹13,110.00. On the performance front, Ultratech Cement share price has declined by 4.23% over the last six months and is down 3.72% on a year-on-year basis.
Ultratech Cement Returns Calculator
Ultratech Cement Shareholder Returns
Ultratech Cement Share Price History
| Name | Mkt Cap Cr | P/E | P/B | ROE | D/E | ROCE | Book Value | Div. Yield | Turnover | EPS(TTM) |
|---|---|---|---|---|---|---|---|---|---|---|
| Ambuja Cements | 1,05,269.00 | 20.96 | 1.67 | 10.55% | 0.01 | 6.68% | 1.89 | 0.50% | 0.46 | 14.41 |
| Shree Cement | 96,477.60 | 47.64 | 3.57 | 7.81% | 0.06 | 10.42% | 3.69 | 0.65% | 0.82 | 472.90 |
| JK Cement | 43,682.10 | 46.66 | 6.22 | 14.10% | 0.87 | 13.35% | 900.85 | 0.35% | 0.76 | 133.73 |
| Dalmia Bharat | 34,799.10 | 29.62 | 1.88 | 6.55% | 0.01 | 7.80% | 4.28 | 0.51% | 0.04 | 7.54 |
| ACC | 25,058.30 | 11.02 | 1.15 | 10.93% | 0.02 | 11.22% | 1,087.20 | 0.56% | 0.94 | 121.78 |
| The Ramco Cements | 21,636.10 | 31.40 | 2.71 | 0.29% | 0.55 | 6.07% | 2.69 | 0.27% | 0.73 | 29.33 |
| JSW CEMENT LIMITED | 18,241.80 | 0.00 | 2.26 | 15.50% | 0.64 | 10.95% | 2.08 | 4.46% | 0.57 | -5.72 |
| Nuvoco Vistas Corp | 12,704.00 | 33.47 | 1.26 | 3.51% | 0.41 | 6.22% | 264.06 | 0.00% | 0.58 | 7.28 |
| The India Cements | 12,643.80 | 136.91 | 2.63 | 0.79% | 0.13 | 1.62% | 152.09 | 0.00% | 0.34 | 2.11 |
| Star Cement | 8,281.66 | 21.21 | 2.60 | 12.33% | 0.26 | 15.20% | 41.42 | 0.49% | 1.14 | 3.22 |
Ultratech Cement Financials
Income Statement · Consolidated
| Particulars | Mar 2025 | Mar 2024 | Mar 2023 | Mar 2022 |
|---|---|---|---|---|
| Revenue | ₹75,955.13 | ₹70,908.14 | ₹63,239.98 | ₹52,598.83 |
| Other Income | ₹744.17 | ₹616.95 | ₹503.08 | ₹507.81 |
| Total Revenue | ₹76,699.30 | ₹71,525.09 | ₹63,743.06 | ₹53,106.64 |
| Total Expenses | ₹69,063.17 | ₹62,052.88 | ₹56,330.84 | ₹44,743.94 |
| Profit Before Tax | ₹7,528.13 | ₹9,422.22 | ₹7,416.25 | ₹8,364.40 |
| Tax | ₹1,488.49 | ₹2,418.26 | ₹2,342.85 | ₹1,190.06 |
| Profit After Tax | ₹6,039.64 | ₹7,003.96 | ₹5,073.40 | ₹7,174.34 |
| EPS - Basic | ₹205.30 | ₹243.05 | ₹175.63 | ₹254.64 |
| EPS - Diluted | ₹205.13 | ₹242.87 | ₹175.54 | ₹254.53 |
Cash Flow · Consolidated
| Particulars | Mar 2025 | Mar 2024 | Mar 2023 | Mar 2022 |
|---|---|---|---|---|
| Profit before tax | ₹7,528.13 | ₹9,422.22 | ₹7,416.25 | ₹8,364.40 |
| Income before WC changes | ₹12,645.13 | ₹13,029.11 | ₹10,529.77 | ₹11,311.15 |
| Change in Assets | -₹161.75 | -₹2,410.66 | -₹2,223.54 | -₹2,547.98 |
| Change in Liabilities | -₹509.32 | ₹1,929.61 | ₹1,886.59 | ₹2,074.96 |
| Change in WC | -₹671.07 | -₹481.05 | -₹336.95 | -₹473.02 |
| Cash flow from Operations | ₹10,673.43 | ₹10,897.54 | ₹9,068.51 | ₹9,283.24 |
| Cash flow from Investing | -₹16,504.45 | -₹8,788.12 | -₹7,187.07 | ₹2,257.01 |
| Cash flow from Financing | ₹5,075.76 | -₹1,925.65 | -₹1,631.00 | -₹12,497.93 |
| Total Cash Flow | -₹755.26 | ₹183.77 | ₹250.44 | -₹957.68 |
| Cash (Start of the year) | ₹553.58 | ₹370.37 | ₹120.54 | ₹177.21 |
| Cash (End of the year) | ₹467.21 | ₹553.58 | ₹370.37 | -₹780.94 |
Balance Sheet · Consolidated
| Particulars | Mar 2025 | Mar 2024 | Mar 2023 | Mar 2022 |
|---|---|---|---|---|
| Non-Current Assets | ₹110,097.64 | ₹77,658.54 | ₹70,662.08 | ₹66,347.85 |
| Current Assets | ₹23,599.51 | ₹23,143.47 | ₹20,724.88 | ₹17,479.94 |
| Total Assets | ₹133,697.15 | ₹100,802.01 | ₹91,386.96 | ₹83,827.79 |
| Current Liabilities | ₹32,364.97 | ₹26,905.96 | ₹23,431.79 | ₹20,155.19 |
| Net Current Asset | -₹8,765.46 | -₹3,762.49 | -₹2,706.91 | -₹2,675.25 |
| Non-Current Liabilities | ₹27,438.82 | ₹13,612.63 | ₹13,575.00 | ₹13,240.39 |
| Equity Capital | ₹73,893.36 | ₹60,283.42 | ₹54,380.17 | ₹50,432.21 |
| Total Equity & Liabilities | ₹133,697.15 | ₹100,802.01 | ₹91,386.96 | ₹83,827.79 |
Income Statement · Standalone
| Particulars | Mar 2025 | Mar 2024 | Mar 2023 | Mar 2022 |
|---|---|---|---|---|
| Revenue | ₹71,894.97 | ₹68,640.63 | ₹61,237.28 | ₹50,663.49 |
| Other Income | ₹693.42 | ₹662.15 | ₹504.54 | ₹611.80 |
| Total Revenue | ₹72,588.39 | ₹69,302.78 | ₹61,741.82 | ₹51,275.29 |
| Total Expenses | ₹64,803.30 | ₹59,914.80 | ₹54,479.87 | ₹42,982.20 |
| Profit Before Tax | ₹7,697.01 | ₹9,315.98 | ₹7,261.95 | ₹8,293.09 |
| Tax | ₹1,504.38 | ₹2,411.11 | ₹2,310.46 | ₹1,226.55 |
| Profit After Tax | ₹6,192.63 | ₹6,904.87 | ₹4,951.49 | ₹7,066.54 |
| EPS - Basic | ₹210.52 | ₹239.58 | ₹171.73 | ₹245.00 |
| EPS - Diluted | ₹210.35 | ₹239.40 | ₹171.64 | ₹244.90 |
Cash Flow · Standalone
| Particulars | Mar 2025 | Mar 2024 | Mar 2023 | Mar 2022 |
|---|---|---|---|---|
| Profit before tax | ₹7,697.01 | ₹9,315.98 | ₹7,261.95 | ₹8,293.09 |
| Income before WC changes | ₹12,242.15 | ₹12,667.55 | ₹10,260.56 | ₹10,790.61 |
| Change in Assets | -₹995.19 | -₹2,295.34 | -₹1,076.16 | -₹2,335.44 |
| Change in Liabilities | -₹436.34 | ₹2,173.89 | ₹1,696.34 | ₹1,768.45 |
| Change in WC | -₹1,431.53 | -₹121.45 | ₹620.18 | -₹566.99 |
| Cash flow from Operations | ₹9,576.49 | ₹10,898.79 | ₹9,757.09 | ₹8,669.66 |
| Cash flow from Investing | -₹15,450.04 | -₹7,830.00 | -₹7,121.59 | ₹789.27 |
| Cash flow from Financing | ₹5,566.31 | -₹2,860.52 | -₹2,378.83 | -₹9,500.93 |
| Total Cash Flow | -₹307.24 | ₹208.27 | ₹256.67 | -₹42.00 |
| Cash (Start of the year) | ₹542.40 | ₹334.13 | ₹77.46 | ₹118.58 |
| Cash (End of the year) | ₹311.92 | ₹542.40 | ₹334.13 | ₹76.58 |
Balance Sheet · Standalone
| Particulars | Mar 2025 | Mar 2024 | Mar 2023 | Mar 2022 |
|---|---|---|---|---|
| Non-Current Assets | ₹101,431.51 | ₹75,594.93 | ₹68,974.83 | ₹61,669.94 |
| Current Assets | ₹19,908.76 | ₹21,036.06 | ₹19,439.68 | ₹18,991.79 |
| Total Assets | ₹121,340.27 | ₹96,630.99 | ₹88,414.51 | ₹80,661.73 |
| Current Liabilities | ₹27,883.55 | ₹24,961.05 | ₹22,502.84 | ₹19,172.59 |
| Net Current Asset | -₹7,974.79 | -₹3,924.99 | -₹3,063.16 | -₹180.80 |
| Non-Current Liabilities | ₹23,778.93 | ₹12,574.70 | ₹12,503.59 | ₹12,218.50 |
| Equity Capital | ₹69,677.79 | ₹59,095.24 | ₹53,408.08 | ₹49,270.64 |
| Total Equity & Liabilities | ₹121,340.27 | ₹96,630.99 | ₹88,414.51 | ₹80,661.73 |
About Ultratech Cement
Established in: 1983
Managing Director: K. C. Jhanwar
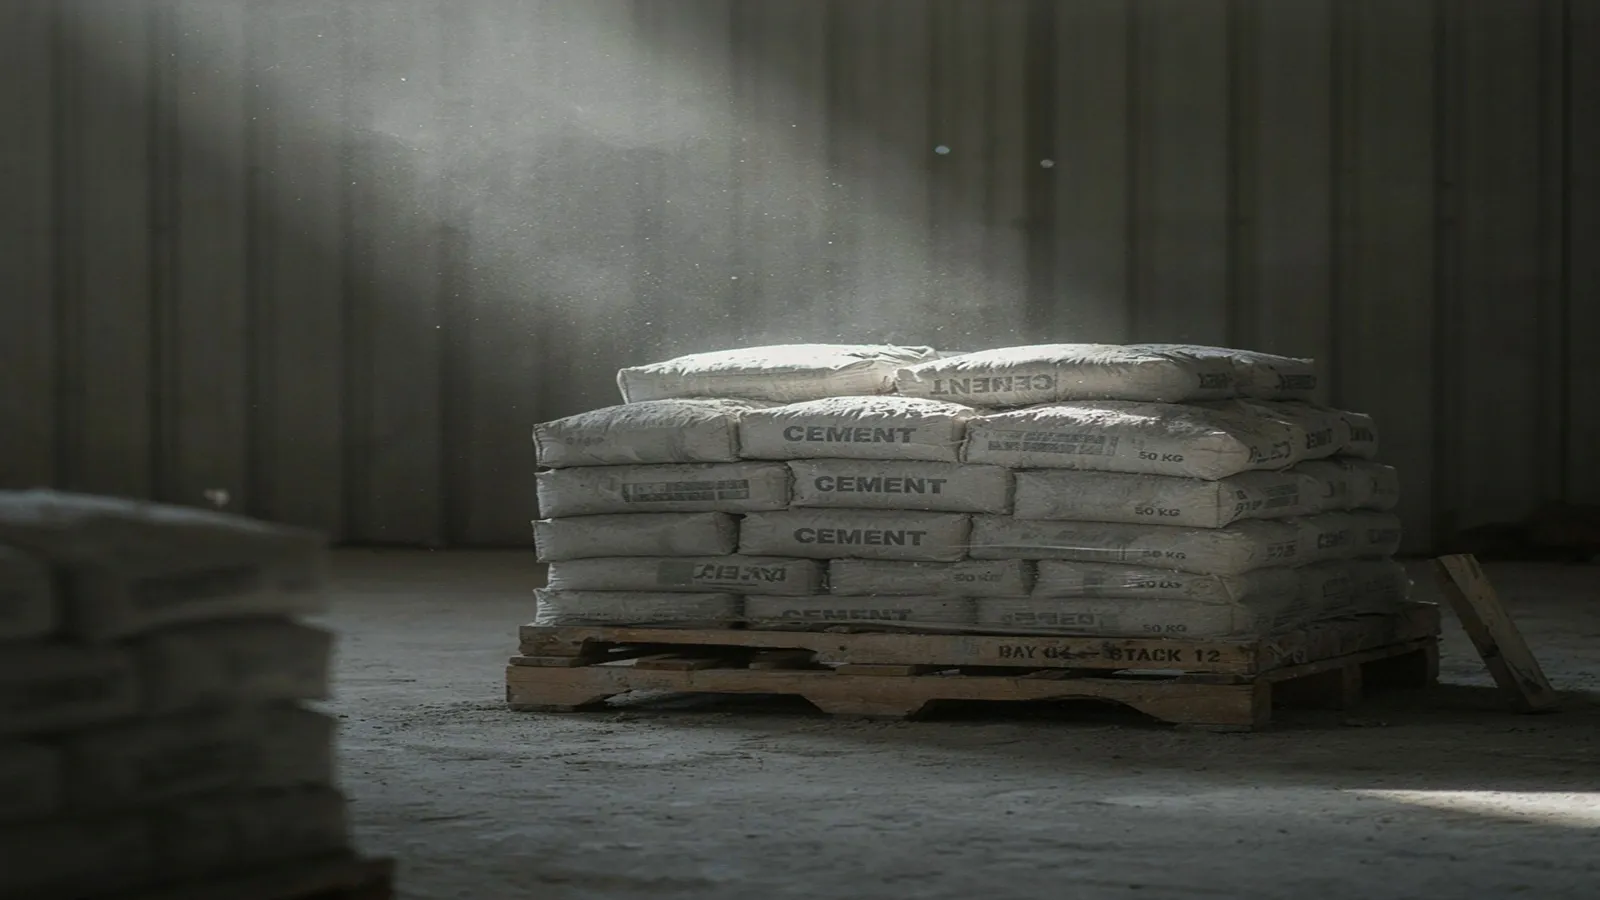
UltraTech Cement Limited is a multinational cement-producing company headquartered in Mumbai, Maharashtra. The company is the largest manufacturer of grey cement, ready-mix concrete (RMC), and white cement in India, with the highest market capitalisation in the country’s cement industry. It is also the largest cement-producing company in the world, excluding China.
The company operates more than 465 Ready-Mix Concrete plants across 167 cities in India to meet increasing industrial demand. It also reaches 80% of cities and towns across the country, supported by a dealer and retail network of 1.5 lakh+ channel partners.
UltraTech Cement Limited launched its IPO and went public in November 2004, issuing 5.98 crore shares at ₹430 per share. The company is listed on the BSE and NSE under the scrip code 532538 and the ticker symbol ULTRACEMCO, respectively.
UltraTech Cement Limited Global Depository Receipts (GDRS) are listed on the Luxembourg Stock Exchange.
History of UltraTech Cement Limited
Ultra Cement Limited was incorporated in 1983 as the cement division of Larsen & Toubro (L&T) Limited, which was later demerged and established as a separate entity in 2000. The company set up its first cement plant for Grasim (Vikram Cement) and Indian Rayon (Rajashree Cement). Later, in mid 1998, Indian Rayon and Grasim Cement merged, leading to a total capacity of 8.5 MTPA and focused on increasing its capacity.
In 2000, the cement division of L&T was officially established as a wholly-owned subsidiary known as L&T Cement Limited. In 2003, the company was renamed as UltraTech Cemco Limited after L&T demerged its cement assets. Grasim Industries acquired the company and renamed it UltraTech Cement Limited.
In 2010, the company acquired Star Cement in the Middle East to expand its presence internationally. Later, it acquired and integrated multiple companies to increase its capacity and strengthen its market presence.
Business Segments of UltraTech Cement Limited
The following are the business segments of UltraTech Cement Limited.
- Grey Cement
This segment is the core revenue driver of the company, accounting for around 95% of the overall turnover. The company manufactures products such as Ordinary Portland Cement (OPC), Portland Pozzolana Cement (PPC), and Portland Slag Cement (PSC). It manages a large production network and caters to individual customers, commercial developers and infrastructure projects.

- Ready Mix Concrete (RMC)
This segment supplies standard concrete mixes and other products developed for specific architectural, structural, and engineering requirements.
- White Cement
The company also produces and sells white cement and wall care putty to residential and commercial users.
- Building Products Division
This segment manufactures a wide range of scientifically engineered, ready-to-use construction materials, such as tile adhesive, waterproofing products, industrial grouts, plasters, mortars and flooring solutions.
Future Plans of UltraTech Cement Limited
The following are the future plans of UltraTech Cement Limited.
- Capacity Expansion
Backed by an ongoing capex program of over ₹16,000 crore, UltraTech Cement has committed a fresh ₹10,255 crore to expand its production capacity past 240 MTPA, fueling the next phase of its ambitious growth strategy.
- Diversficiation
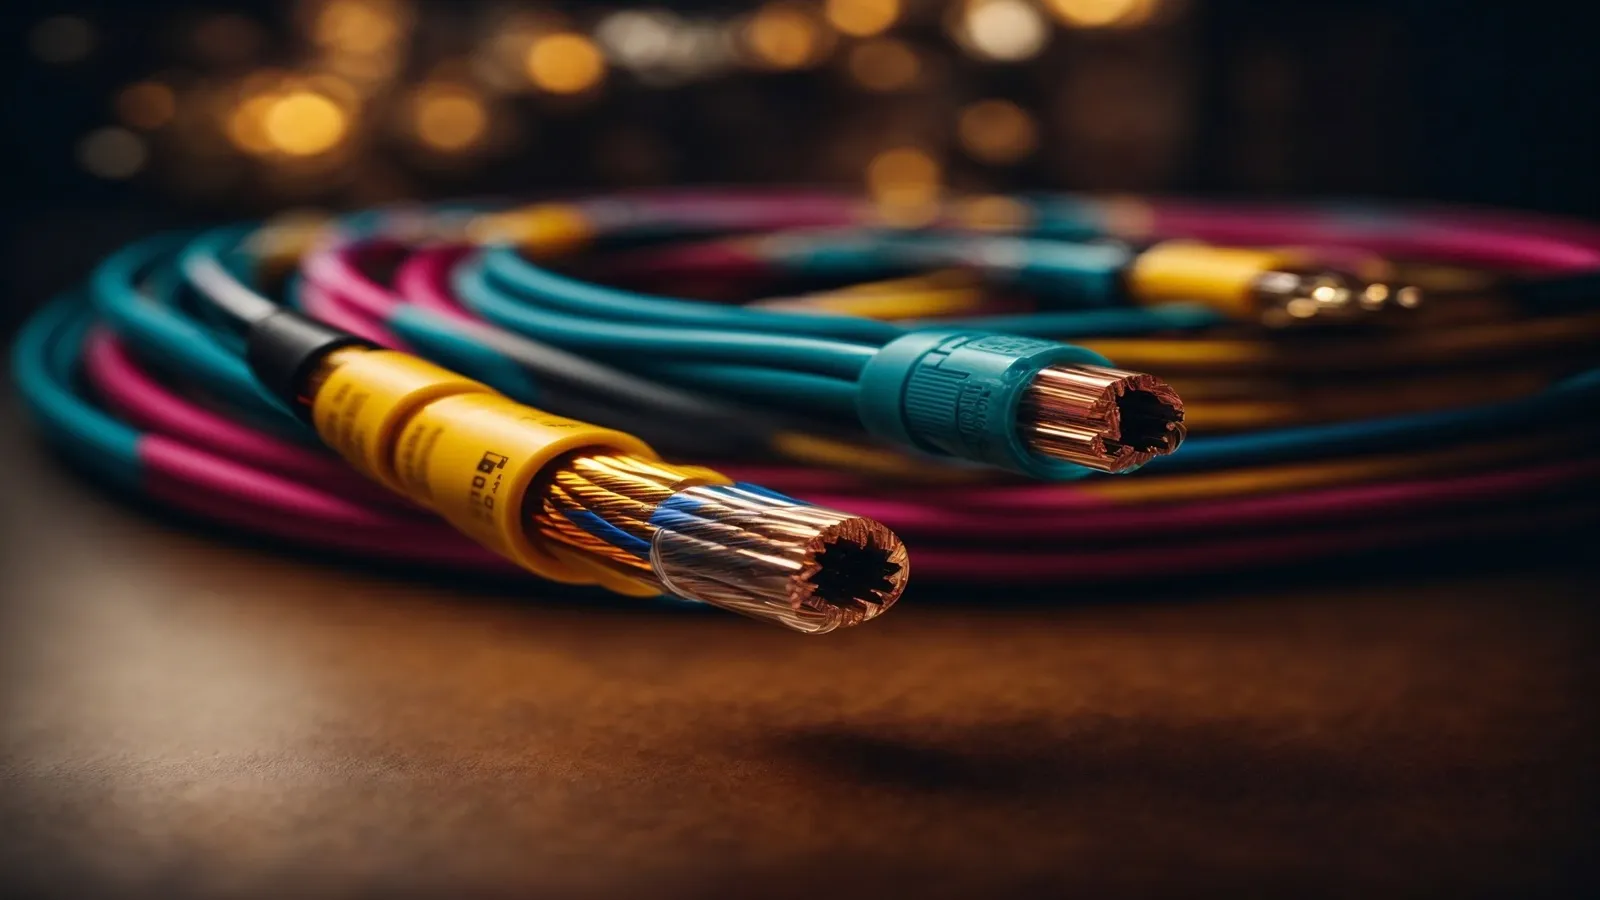
The company is setting up a manufacturing facility in Jhagadia, Gujarat, that is expected to produce 35-40 lakh km of wires and cables to capture the growing market.
- Green Energy Goals
The company aims to achieve 100% of its electricity requirements from renewable sources by 2050. It is committed to the GCCA (Global Cement and Concrete Association) Net Zero Concrete Roadmap and uses technology to reduce its carbon footprint.
Subsidiaries of UltraTech Cement Limited
The following are the subsidiary companies of UltraTech Cement Limited.
- Bhagwati Limestone Company Private Limited
- Gotan Limestone Khanij Udyog Private Limited
- Harish Cement Limited
- UltraTech Cement Lanka (Private) Limited
- UltraTech Cement Middle East Investments Limited
- Bhumi Resources (Singapore) Pte. Ltd
- Letein Valley Cement Limited
- The India Cements Limited
Ultratech Cement Financial Highlights
- Revenue: Ultratech Cement reported revenue of ₹89,089.04 crore in FY26 vs ₹76,699.30 crore in FY25. It showed an increase of 16.15% on a yearly basis.
- Operating Profit: Ultratech Cement reported an operating profit of ₹10,927.19 crore in FY26 vs ₹7,528.13 crore in FY25. It showed an increase of 45.15% on a year-on-year basis.
- Net Profit: Ultratech Cement reported a net profit of ₹8,188.35 crore in FY26 vs ₹6,039.64 crore in FY25. It showed an increase of 35.58% on a yearly basis.
Ultratech Cement Quarterly Result Highlights
- Ultratech Cement reported revenue of ₹24,778.47 crore in Jun 2026, compared with ₹25,887.03 crore in Mar 2026, representing a decrease of 4.28% on a quarter-on-quarter (QoQ) basis.
- Ultratech Cement reported an operating profit of ₹3,480.43 crore in Jun 2026, compared with ₹3,980.54 crore in Mar 2026, representing a decrease of 12.56% on a quarter-on-quarter (QoQ) basis.
- Ultratech Cement reported a profit of ₹2,603.72 crore in Jun 2026, compared with ₹3,000.02 crore in Mar 2026, reflecting a decrease of 13.21% on a QoQ basis.
- The earnings per share (EPS) of Ultratech Cement stood at ₹205.30 during Jun 2026.
Similar Stocks
FAQs on Ultratech Cement Share Price
What is Ultratech Cement share price today?
Ultratech Cement share price is ₹11,840.00 as on 24 Jul, 2026, 15:29 IST.
How has the Ultratech Cement share price performed in the past?
In the last 1 year, Ultratech Cement delivered a return of -3.72%. The Ultratech Cement share price hit a high of ₹13,110.00 and low of ₹10,325.00.
How much is the Mutual Fund shareholding in Ultratech Cement shares?
The Mutual Fund Shareholding in Ultratech Cement was 15.98% at the end of Jun 2026.
What is the the 52-week high and low of Ultratech Cement shares ?
The 52-week high and low of Ultratech Cement share is ₹13,110.00 and ₹10,325.00 as of 24 Jul, 2026.
What is the market cap of Ultratech Cement?
The market capitalisation of Ultratech Cement is ₹3,50,914.00 Crores as on 24 Jul, 2026.
What are the stock symbols of Ultratech Cement?
The stock symbol of Ultratech Cement is ULTRACEMCO on the NSE, 532538 on the BSE, and the ISIN is INE481G01011.
What was yesterday's closing price of Ultratech Cement shares ?
Ultratech Cement shares closed yesterday at ₹11,908.00 on NSE & ₹11,908.35 on BSE
How to buy Ultratech Cement shares?
To buy Ultratech Cement shares, open a demat account with Upstox and complete the KYC process. Once your account is set up, search for the stock and place your order.
Can I buy Ultratech Cement shares on Holidays?
No, shares of Ultratech Cement or any other publicly traded company cannot be bought or sold on holidays when the stock exchanges are closed. You can only buy or sell Ultratech Cement shares on days when the stock exchanges are open for trading. It's important to check the NSE & BSE holidays calendar, before placing any trades to avoid any inconvenience.
What is the PE and PB ratio of Ultratech Cement?
The PE and PB ratio of Ultratech Cement is 40.71 and 4.55 respectively, as on 24 Jul, 2026, 15:29 IST.