Berger Paints Share Price
Berger Paints Share Price Today
As of 26 Jul 2026, Berger Paints share price is ₹497.95. The stock opened at ₹489.70, compared to its previous close of ₹493.60. During today's trading session, Berger Paints share price moved in the range of ₹488.90 to ₹499.90, with an average price of ₹494.40 for the day. Looking at its last 52-week, the stock has touched a low of ₹391.10 and a high of ₹594.55. On the performance front, Berger Paints share price has declined by 1.30% over the last six months and is down 13.71% on a year-on-year basis.
Berger Paints Returns Calculator
Berger Paints Shareholder Returns
Berger Paints Share Price History
| Name | Mkt Cap Cr | P/E | P/B | ROE | D/E | ROCE | Book Value | Div. Yield | Turnover | EPS(TTM) |
|---|---|---|---|---|---|---|---|---|---|---|
| Asian Paints | 2,53,065.00 | 48.00 | 9.71 | 21.56% | 0.09 | 25.94% | 9.99 | 1.27% | 1.33 | 44.27 |
| Kansai Nerolac Paints | 15,616.30 | 22.91 | 2.01 | 8.77% | 0.03 | 12.04% | 2.02 | 2.24% | 1.10 | 8.25 |
| Akzo Nobel India | 13,378.20 | 6.55 | 5.27 | 19.11% | 0.04 | 21.70% | 5.40 | 7.25% | 1.39 | 421.10 |
| Indigo Paints | 4,995.94 | 33.85 | 4.33 | 12.57% | 0.02 | 16.22% | 247.71 | 0.48% | 1.08 | 30.51 |
| Sirca Paint India | 2,236.78 | 35.07 | 4.80 | 15.77% | 0.10 | 19.96% | 4.80 | 0.50% | 0.96 | 11.64 |
| Shalim Paints | 578.53 | -8.91 | 4.06 | -25.86% | 0.69 | -9.62% | 15.40 | 0.00% | 2.29 | -7.57 |
Berger Paints Financials
Income Statement · Consolidated
| Particulars | Mar 2026 | Mar 2025 | Mar 2024 | Mar 2023 |
|---|---|---|---|---|
| Revenue | ₹11,880.25 | ₹11,544.71 | ₹11,198.92 | ₹10,567.84 |
| Other Income | ₹106.70 | ₹94.78 | ₹63.68 | ₹51.57 |
| Total Revenue | ₹11,986.95 | ₹11,639.49 | ₹11,262.60 | ₹10,619.41 |
| Total Expenses | ₹10,496.61 | ₹10,106.08 | ₹9,746.73 | ₹9,443.90 |
| Profit Before Tax | ₹1,488.10 | ₹1,568.47 | ₹1,556.89 | ₹1,162.34 |
| Tax | ₹360.08 | ₹385.66 | ₹387.07 | ₹301.94 |
| Profit After Tax | ₹1,128.02 | ₹1,182.81 | ₹1,169.82 | ₹860.40 |
| EPS - Basic | ₹9.67 | ₹10.13 | ₹10.02 | ₹7.37 |
| EPS - Diluted | ₹9.66 | ₹10.12 | ₹10.02 | ₹7.37 |
Cash Flow · Consolidated
| Particulars | Mar 2026 | Mar 2025 | Mar 2024 | Mar 2023 |
|---|---|---|---|---|
| Profit before tax | ₹1,488.10 | ₹1,568.47 | ₹1,556.89 | ₹1,162.34 |
| Income before WC changes | ₹1,895.96 | ₹1,916.64 | ₹1,909.41 | ₹1,542.78 |
| Change in Assets | -₹104.26 | -₹241.01 | ₹112.32 | -₹285.11 |
| Change in Liabilities | ₹86.89 | -₹28.73 | -₹82.12 | ₹25.68 |
| Change in WC | -₹17.37 | -₹269.74 | ₹30.20 | -₹259.43 |
| Cash flow from Operations | ₹1,540.04 | ₹1,269.05 | ₹1,591.05 | ₹975.57 |
| Cash flow from Investing | -₹976.04 | -₹649.88 | -₹398.06 | -₹600.25 |
| Cash flow from Financing | -₹612.59 | -₹605.54 | -₹1,068.87 | -₹362.85 |
| Total Cash Flow | -₹48.59 | ₹13.63 | ₹124.12 | ₹12.47 |
| Cash (Start of the year) | ₹253.95 | ₹240.26 | ₹116.17 | ₹103.30 |
| Cash (End of the year) | ₹207.24 | ₹253.95 | ₹240.26 | ₹116.17 |
Balance Sheet · Consolidated
| Particulars | Mar 2026 | Mar 2025 | Mar 2024 | Mar 2023 |
|---|---|---|---|---|
| Non-Current Assets | ₹4,630.16 | ₹4,241.34 | ₹4,050.63 | ₹3,802.72 |
| Current Assets | ₹5,427.10 | ₹4,890.30 | ₹4,318.03 | ₹4,164.45 |
| Total Assets | ₹10,057.26 | ₹9,131.64 | ₹8,368.66 | ₹7,967.17 |
| Current Liabilities | ₹2,565.88 | ₹2,379.71 | ₹2,362.51 | ₹2,974.55 |
| Net Current Asset | ₹2,861.22 | ₹2,510.59 | ₹1,955.52 | ₹1,189.90 |
| Non-Current Liabilities | ₹561.48 | ₹585.24 | ₹616.98 | ₹490.36 |
| Equity Capital | ₹6,929.90 | ₹6,166.69 | ₹5,389.17 | ₹4,502.26 |
| Total Equity & Liabilities | ₹10,057.26 | ₹9,131.64 | ₹8,368.66 | ₹7,967.17 |
Income Statement · Standalone
| Particulars | Mar 2026 | Mar 2025 | Mar 2024 | Mar 2023 |
|---|---|---|---|---|
| Revenue | ₹10,420.10 | ₹10,169.22 | ₹10,002.93 | ₹9,470.62 |
| Other Income | ₹192.87 | ₹122.21 | ₹57.44 | ₹77.15 |
| Total Revenue | ₹10,612.97 | ₹10,291.43 | ₹10,060.37 | ₹9,547.77 |
| Total Expenses | ₹9,124.76 | ₹8,860.69 | ₹8,692.91 | ₹8,445.05 |
| Profit Before Tax | ₹1,438.22 | ₹1,430.74 | ₹1,367.46 | ₹1,102.72 |
| Tax | ₹342.56 | ₹353.24 | ₹352.41 | ₹274.33 |
| Profit After Tax | ₹1,095.66 | ₹1,077.50 | ₹1,015.05 | ₹828.39 |
| EPS - Basic | ₹9.40 | ₹9.24 | ₹8.71 | ₹7.11 |
| EPS - Diluted | ₹9.39 | ₹9.24 | ₹8.71 | ₹7.11 |
Cash Flow · Standalone
| Particulars | Mar 2026 | Mar 2025 | Mar 2024 | Mar 2023 |
|---|---|---|---|---|
| Profit before tax | ₹1,438.22 | ₹1,430.74 | ₹1,367.46 | ₹1,102.72 |
| Income before WC changes | ₹1,744.78 | ₹1,729.64 | ₹1,712.22 | ₹1,398.96 |
| Change in Assets | -₹64.05 | -₹260.81 | ₹159.17 | -₹219.17 |
| Change in Liabilities | ₹32.48 | -₹1.50 | -₹80.55 | ₹34.01 |
| Change in WC | -₹31.57 | -₹262.31 | ₹78.62 | -₹185.16 |
| Cash flow from Operations | ₹1,406.43 | ₹1,118.83 | ₹1,482.90 | ₹934.29 |
| Cash flow from Investing | -₹811.23 | -₹543.16 | -₹296.32 | -₹659.14 |
| Cash flow from Financing | -₹584.65 | -₹585.48 | -₹1,092.25 | -₹284.26 |
| Total Cash Flow | ₹10.55 | -₹9.81 | ₹94.33 | -₹9.11 |
| Cash (Start of the year) | ₹141.39 | ₹151.20 | ₹56.87 | ₹65.98 |
| Cash (End of the year) | ₹151.94 | ₹141.39 | ₹151.20 | ₹56.87 |
Balance Sheet · Standalone
| Particulars | Mar 2026 | Mar 2025 | Mar 2024 | Mar 2023 |
|---|---|---|---|---|
| Non-Current Assets | ₹4,265.69 | ₹4,042.71 | ₹3,957.79 | ₹3,799.88 |
| Current Assets | ₹4,680.51 | ₹4,133.80 | ₹3,623.87 | ₹3,600.21 |
| Total Assets | ₹8,946.20 | ₹8,176.51 | ₹7,581.66 | ₹7,400.09 |
| Current Liabilities | ₹2,142.11 | ₹1,985.76 | ₹2,036.27 | ₹2,696.03 |
| Net Current Asset | ₹2,538.40 | ₹2,148.04 | ₹1,587.60 | ₹904.18 |
| Non-Current Liabilities | ₹461.19 | ₹509.69 | ₹540.15 | ₹408.87 |
| Equity Capital | ₹6,342.90 | ₹5,681.06 | ₹5,005.24 | ₹4,295.19 |
| Total Equity & Liabilities | ₹8,946.20 | ₹8,176.51 | ₹7,581.66 | ₹7,400.09 |

About Berger Paints
Berger Paints is an Indian company that makes and sells paints. Founded in 1923, it is headquartered in Kolkata. It is the second-largest paint company in the country.
Berger Paints India Limited had very humble beginnings. Its origins trace back to the 18th century when Lewis Berger founded the brand in the UK in 1760.
Berger’s journey in India started in 1923 when Hadfields (India) Limited set up its office on 2 acres of land in one of India’s first industrial towns close to Kolkata in Howrah, West Bengal. Subsequently, British Paints (Holdings) Limited bought over Hadfield’s (India) Limited, and the name changed to British Paints (India) Ltd in 1947.
In 1965, a US-based company, Celanese Corporation, acquired British Paints (Holdings) Limited, and the controlling interests of British Paints India Ltd were captured by CELEURO NV, Holland, a Celanese subsidiary. By 1969, the Celanese corporation sold the Indian interests to Berger, Jenson & Nicholson, UK, and from then on, British Paints (India) Ltd came to be known as a member of the Berger group.
In 1976, the foreign holding in the company was below 40% and the majority of the shares were taken over by the UB Group. In 1983, British Paints (India) Limited became Berger Paints India Limited with its new name. In 1991, again a major change happened in the company’s ownership when the Delhi-based Dhingra brothers, KS Dhingra and GS Dhingra, bought stakes. Presently, Dhingras hold a 73% stake in Berger Paints India.
Berger Paints India Ltd. has a total market capitalization of over ₹69,000 crores. Berger Paints share price fell by over 12% in the last 3 years.
Business operations
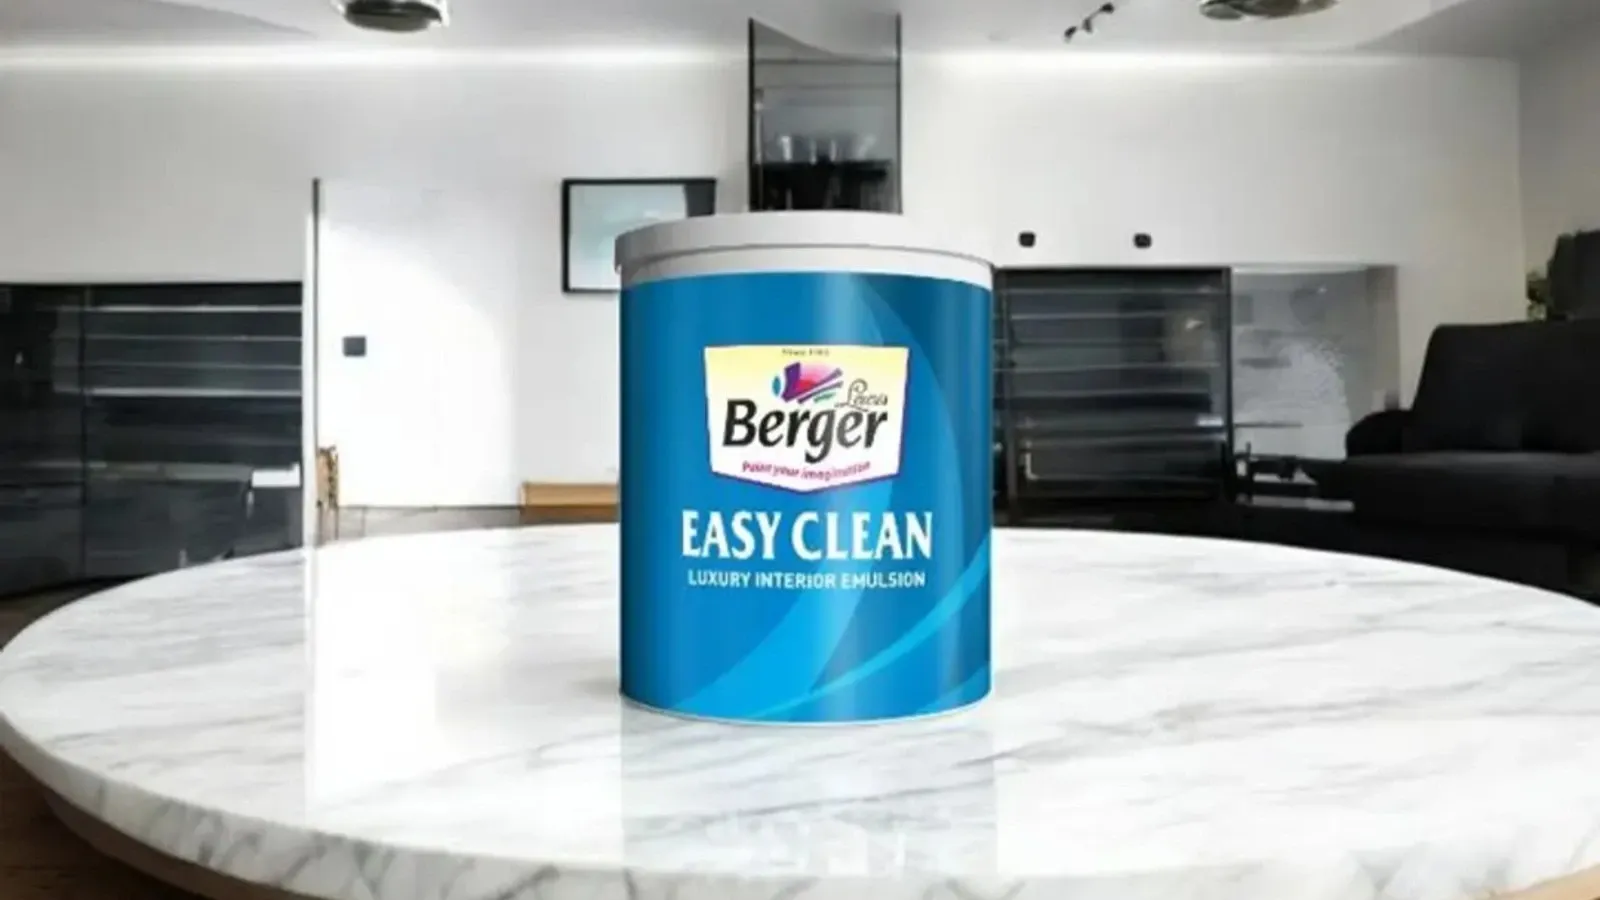
Berger Paints’ product range comprises paints, primers, enamels and coatings for various surfaces. Some of its signature brands are Berger Silk Glamor, Berger Easy Clean and Berger WeatherCoat LongLife Flexo.
The company has 25 strategically located manufacturing facilities including its subsidiaries across the nation. The company shares its global reach in four countries – Nepal, Bangladesh, Poland and Russia.
Berger Paints has two overseas manufacturing units in Nepal and one each in Poland and Russia. It has a massive strength of over 3,600 workers. The brand has a nationwide distribution chain with over 60,000 dealers and 184 warehouses, making it a game changer in the paint industry. Berger Paints also has an expansive network with over 60,000 touchpoints, supported by a dedicated team of more than 1,000 on-roll sales personnel and an additional 2,000 contractual sales personnel.
On the capacity expansion front, Berger’s biggest plant at Sandila, Uttar Pradesh, started producing 33,000 metric tonnes of products in all categories this fiscal year. Further, the company aims to expand its capacity with a new plant at Panagarh in West Bengal in 2025-26, which will produce industrial paints, solvent-based paint, and construction chemicals.
Berger Paints Financial Highlights
- Revenue: Berger Paints reported revenue of ₹11,986.95 crore in FY26 vs ₹11,639.49 crore in FY25. It showed an increase of 2.99% on a yearly basis.
- Operating Profit: Berger Paints reported an operating profit of ₹1,488.10 crore in FY26 vs ₹1,568.47 crore in FY25. It showed a decrease of 5.12% on a year-on-year basis.
- Net Profit: Berger Paints reported a net profit of ₹1,128.02 crore in FY26 vs ₹1,182.81 crore in FY25. It showed a decrease of 4.63% on a yearly basis.
Berger Paints Quarterly Result Highlights
- Berger Paints reported revenue of ₹2,889.74 crore in Mar 2026, compared with ₹3,014.50 crore in Dec 2025, representing a decrease of 4.14% on a quarter-on-quarter (QoQ) basis.
- Berger Paints reported an operating profit of ₹438.49 crore in Mar 2026, compared with ₹352.23 crore in Dec 2025, representing an increase of 24.49% on a quarter-on-quarter (QoQ) basis.
- Berger Paints reported a profit of ₹335.25 crore in Mar 2026, compared with ₹271.35 crore in Dec 2025, reflecting an increase of 23.55% on a QoQ basis.
- The earnings per share (EPS) of Berger Paints stood at ₹9.67 during Mar 2026.
FAQs on Berger Paints Share Price
What is Berger Paints share price today?
Berger Paints share price is ₹497.95 as on 24 Jul, 2026, 15:47 IST.
How has the Berger Paints share price performed in the past?
In the last 1 year, Berger Paints delivered a return of -13.71%. The Berger Paints share price hit a high of ₹594.55 and low of ₹391.10.
How much is the Mutual Fund shareholding in Berger Paints shares?
The Mutual Fund Shareholding in Berger Paints was 7.01% at the end of Jun 2026.
What is the the 52-week high and low of Berger Paints shares ?
The 52-week high and low of Berger Paints share is ₹594.55 and ₹391.10 as of 24 Jul, 2026.
What is the market cap of Berger Paints?
The market capitalisation of Berger Paints is ₹58,055.30 Crores as on 24 Jul, 2026.
What are the stock symbols of Berger Paints?
The stock symbol of Berger Paints is BERGEPAINT on the NSE, 509480 on the BSE, and the ISIN is INE463A01038.
What was yesterday's closing price of Berger Paints shares ?
Berger Paints shares closed yesterday at ₹493.60 on NSE & ₹493.05 on BSE
How to buy Berger Paints shares?
To buy Berger Paints shares, open a demat account with Upstox and complete the KYC process. Once your account is set up, search for the stock and place your order.
Can I buy Berger Paints shares on Holidays?
No, shares of Berger Paints or any other publicly traded company cannot be bought or sold on holidays when the stock exchanges are closed. You can only buy or sell Berger Paints shares on days when the stock exchanges are open for trading. It's important to check the NSE & BSE holidays calendar, before placing any trades to avoid any inconvenience.
What is the PE and PB ratio of Berger Paints?
The PE and PB ratio of Berger Paints is 42.46 and 6.92 respectively, as on 24 Jul, 2026, 15:47 IST.