Zomato Share Price
Zomato Share Price Today
As of 27 Jul 2026, Zomato share price is ₹280.00. The stock opened at ₹285.00, compared to its previous close of ₹287.10. During today's trading session, Zomato share price moved in the range of ₹276.55 to ₹285.00, with an average price of ₹280.77 for the day. Looking at its last 52-week, the stock has touched a low of ₹212.60 and a high of ₹368.45. On the performance front, Zomato share price has increased by 8.23% over the last six months and is down 10.59% on a year-on-year basis.
Zomato Returns Calculator
Zomato Shareholder Returns
Zomato Share Price History
| Name | Mkt Cap Cr | P/E | P/B | ROE | D/E | ROCE | Book Value | Div. Yield | Turnover | EPS(TTM) |
|---|---|---|---|---|---|---|---|---|---|---|
| Nykaa | 92,446.30 | 454.65 | 64.29 | 13.87% | 0.12 | 16.71% | 6.30 | 0.00% | 0.19 | 0.31 |
| MEESHO LIMITED | 85,629.60 | -71.25 | 19.50 | -28.13% | 0.00 | -23.81% | 71.74 | 0.00% | 0.19 | 62.51 |
| Paytm | 82,263.90 | 126.75 | 5.13 | 4.55% | 0.01 | 4.84% | 204.67 | 0.00% | 0.36 | 1.05 |
| INFO EDGE (I) LTD | 75,547.50 | 42.85 | 1.99 | 3.82% | 0.01 | 5.63% | 535.88 | 0.72% | 0.08 | 85.49 |
| SWIGGY LIMITED | 69,394.30 | -16.70 | 3.79 | -22.68% | 0.01 | -18.92% | 75.55 | 0.00% | 0.38 | -13.88 |
| URBAN COMPANY LIMITED | 20,017.50 | 0.00 | 8.08 | 0.00% | 0.05 | 0.00% | 6.57 | 0.00% | 0.39 | -1.31 |
| PINE LABS LIMITED | 16,823.20 | 148.78 | 2.85 | 1.91% | 0.06 | 3.48% | 55.10 | 0.00% | 0.30 | 1.39 |
| TBO TEK LIMITED | 15,527.00 | 63.55 | 10.01 | 15.76% | 0.12 | 14.37% | 79.60 | 0.00% | 0.60 | 5.29 |
| NAZARA TECHNOLOGIES LTD | 11,202.90 | 136.83 | 3.23 | 27.81% | 0.01 | 26.67% | 60.52 | 0.00% | 0.03 | -25.52 |
| IndiaMART InterMESH | 10,572.30 | 21.43 | 4.40 | 19.78% | 0.01 | 20.54% | 422.62 | 3.41% | 0.32 | 87.49 |
Zomato Financials
Income Statement · Consolidated
| Particulars | Mar 2025 | Mar 2024 | Mar 2023 | Mar 2022 |
|---|---|---|---|---|
| Revenue | ₹20,243.00 | ₹12,114.00 | ₹7,079.00 | ₹4,192.40 |
| Other Income | ₹1,077.00 | ₹847.00 | ₹682.00 | ₹494.90 |
| Total Revenue | ₹21,320.00 | ₹12,961.00 | ₹7,761.00 | ₹4,687.30 |
| Total Expenses | ₹20,623.00 | ₹12,670.00 | ₹8,775.00 | ₹6,205.50 |
| Profit Before Tax | ₹697.00 | ₹291.00 | -₹1,015.00 | -₹1,220.50 |
| Tax | ₹170.00 | -₹60.00 | -₹44.00 | ₹2.00 |
| Profit After Tax | ₹527.00 | ₹351.00 | -₹971.00 | -₹1,222.50 |
| EPS - Basic | ₹0.60 | ₹0.41 | -₹1.20 | -₹1.67 |
| EPS - Diluted | ₹0.58 | ₹0.40 | -₹1.20 | -₹1.67 |
Cash Flow · Consolidated
| Particulars | Mar 2025 | Mar 2024 | Mar 2023 | Mar 2022 |
|---|---|---|---|---|
| Profit before tax | ₹697.00 | ₹291.00 | -₹1,015.00 | -₹1,220.50 |
| Income before WC changes | ₹1,519.00 | ₹633.00 | -₹637.00 | -₹922.10 |
| Change in Assets | -₹2,017.00 | -₹512.00 | -₹448.00 | ₹15.20 |
| Change in Liabilities | ₹924.00 | ₹630.00 | ₹272.00 | ₹233.10 |
| Change in WC | -₹1,093.00 | ₹118.00 | -₹176.00 | ₹248.30 |
| Cash flow from Operations | ₹308.00 | ₹646.00 | -₹844.00 | -₹693.00 |
| Cash flow from Investing | -₹7,993.00 | -₹347.00 | ₹457.00 | -₹7,937.80 |
| Cash flow from Financing | ₹8,042.00 | -₹207.00 | -₹127.00 | ₹8,749.80 |
| Total Cash Flow | ₹357.00 | ₹92.00 | -₹514.00 | ₹119.00 |
| Cash (Start of the year) | ₹309.00 | ₹218.00 | ₹392.00 | ₹306.50 |
| Cash (End of the year) | ₹666.00 | ₹309.00 | ₹218.00 | ₹392.30 |
Balance Sheet · Consolidated
| Particulars | Mar 2025 | Mar 2024 | Mar 2023 | Mar 2022 |
|---|---|---|---|---|
| Non-Current Assets | ₹23,922.00 | ₹17,898.00 | ₹10,768.00 | ₹9,782.00 |
| Current Assets | ₹11,701.00 | ₹5,458.00 | ₹10,831.00 | ₹7,545.00 |
| Total Assets | ₹35,623.00 | ₹23,356.00 | ₹21,599.00 | ₹17,327.00 |
| Current Liabilities | ₹3,326.00 | ₹2,083.00 | ₹1,441.00 | ₹711.50 |
| Net Current Asset | ₹8,375.00 | ₹3,375.00 | ₹9,390.00 | ₹6,833.50 |
| Non-Current Liabilities | ₹1,987.00 | ₹867.00 | ₹705.00 | ₹116.60 |
| Equity Capital | ₹30,310.00 | ₹20,406.00 | ₹19,453.00 | ₹16,498.90 |
| Total Equity & Liabilities | ₹35,623.00 | ₹23,356.00 | ₹21,599.00 | ₹17,327.00 |
Income Statement · Standalone
| Particulars | Mar 2025 | Mar 2024 | Mar 2023 | Mar 2022 |
|---|---|---|---|---|
| Revenue | ₹8,617.00 | ₹6,622.00 | ₹4,707.00 | ₹3,611.00 |
| Other Income | ₹1,260.00 | ₹920.00 | ₹800.00 | ₹497.50 |
| Total Revenue | ₹9,877.00 | ₹7,542.00 | ₹5,507.00 | ₹4,108.50 |
| Total Expenses | ₹7,676.00 | ₹6,131.00 | ₹5,390.00 | ₹5,377.30 |
| Profit Before Tax | ₹2,190.00 | ₹1,372.00 | ₹117.00 | -₹1,097.80 |
| Tax | ₹230.00 | ₹1.00 | ₹0.00 | ₹0.20 |
| Profit After Tax | ₹1,960.00 | ₹1,371.00 | ₹117.00 | -₹1,098.00 |
| EPS - Basic | ₹2.22 | ₹1.61 | ₹0.14 | -₹1.52 |
| EPS - Diluted | ₹2.15 | ₹1.57 | ₹0.13 | -₹1.52 |
Cash Flow · Standalone
| Particulars | Mar 2025 | Mar 2024 | Mar 2023 | Mar 2022 |
|---|---|---|---|---|
| Profit before tax | ₹2,190.00 | ₹1,372.00 | ₹117.00 | -₹1,097.80 |
| Income before WC changes | ₹1,721.00 | ₹1,126.00 | ₹29.00 | -₹741.00 |
| Change in Assets | -₹125.00 | -₹103.00 | -₹50.00 | ₹66.50 |
| Change in Liabilities | ₹112.00 | ₹437.00 | ₹272.00 | ₹200.60 |
| Change in WC | -₹13.00 | ₹334.00 | ₹222.00 | ₹267.10 |
| Cash flow from Operations | ₹1,614.00 | ₹1,379.00 | ₹224.00 | -₹508.60 |
| Cash flow from Investing | -₹9,752.00 | -₹1,301.00 | -₹382.00 | -₹8,130.80 |
| Cash flow from Financing | ₹8,388.00 | -₹20.00 | -₹14.00 | ₹8,762.80 |
| Total Cash Flow | ₹250.00 | ₹58.00 | -₹172.00 | ₹123.40 |
| Cash (Start of the year) | ₹181.00 | ₹123.00 | ₹294.00 | ₹168.60 |
| Cash (End of the year) | ₹431.00 | ₹181.00 | ₹123.00 | ₹294.10 |
Balance Sheet · Standalone
| Particulars | Mar 2025 | Mar 2024 | Mar 2023 | Mar 2022 |
|---|---|---|---|---|
| Non-Current Assets | ₹29,540.00 | ₹20,778.00 | ₹13,183.00 | ₹10,163.90 |
| Current Assets | ₹6,311.00 | ₹3,547.00 | ₹8,744.00 | ₹7,336.80 |
| Total Assets | ₹35,851.00 | ₹24,325.00 | ₹21,927.00 | ₹17,500.70 |
| Current Liabilities | ₹1,532.00 | ₹1,394.00 | ₹938.00 | ₹663.10 |
| Net Current Asset | ₹4,779.00 | ₹2,153.00 | ₹7,806.00 | ₹6,673.70 |
| Non-Current Liabilities | ₹204.00 | ₹156.00 | ₹183.00 | ₹70.40 |
| Equity Capital | ₹34,115.00 | ₹22,775.00 | ₹20,806.00 | ₹16,767.20 |
| Total Equity & Liabilities | ₹35,851.00 | ₹24,325.00 | ₹21,927.00 | ₹17,500.70 |
About Zomato
Incorporated in: 18 January 2010
Eternal Group CEO: Albinder Dhindsa appointed in January 2026
Eternal Limited, formerly known as Zomato Limited, is a prominent India-based internet company focused on food, dining, and quick commerce.
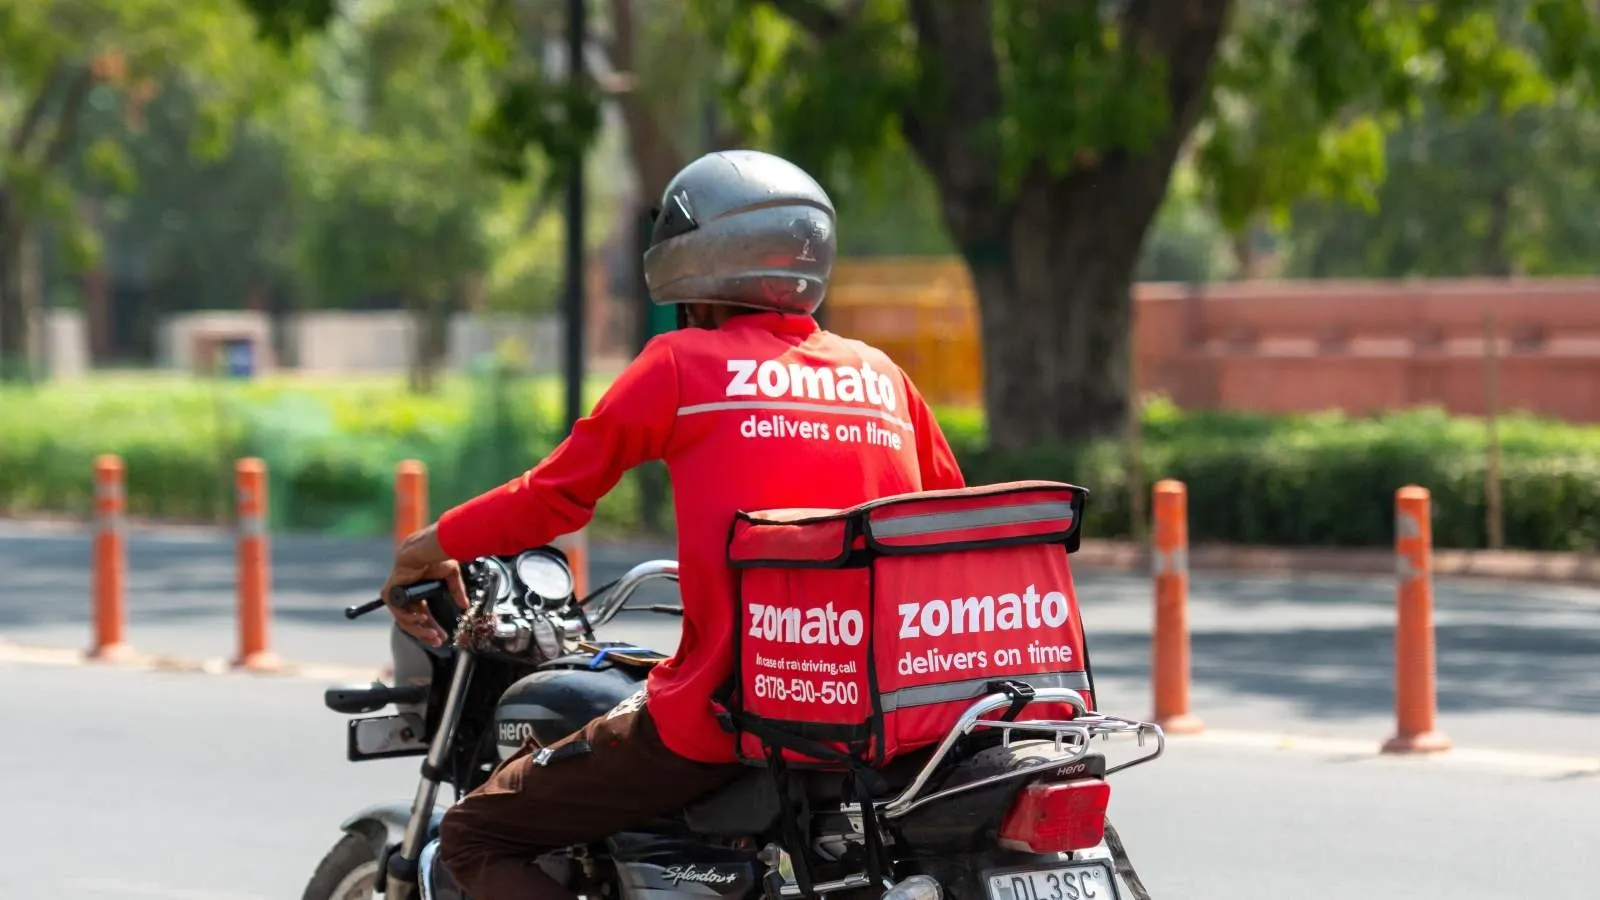
Eternal’s mobile app is named Zomato, which connects millions of users with restaurant delivery partners and merchants across India.
The company has steadily evolved beyond food delivery, building a broader ecosystem around convenience, dining out experiences and everyday consumption technology-driven platforms.
At present, there are four brands comes under the Eternal’s umbrella.
- Zomato: A food delivery app
- Blinkit: A quick commerce app for ordering groceries online.
- District by Zomato: An app for reserving tables in restaurants, booking movie tickets, sports and concerts.
- Hyperpure: A B2B platform that provides restaurants with fresh fruits, vegetables, dairy, and seafood.
History of Eternal Limited (Zomato)
Eternal Limited's journey began in 2008 when a simple restaurant discovery website was launched, named Foodiebay. Later, it was remanded to Zomato. Earlier, the team was led by Deepinder Goyal and Pankaj Chaddah.
Over the years, it grew rapidly, adding an online food delivery service, table reservations, and reviews, becoming a household name in India.
As the business expanded, Eternal (Zomato) acquired a quick commerce platform, Blinkit in an all-stock deal valued at ₹4,447 crores in June 2022. Blinkit’s acquisition turned out to be a major success for Eternal, which now contributes a major share to the company’s revenue.
In 2024, Zomato rebranded its corporate entity as Eternal Limited to reflect its long-term vision beyond food delivery, while retaining Zomato as its flagship consumer brand. This shift marked a new phase focused on building enduring, scalable digital businesses.
Eternal Limited Core Business Segment
Currently, Eternal Limited operates in four segments mentioned below:
-
Food Delivery (Zomato App): This segment is the heart of the business. The Zomato app connects customers with nearby restaurants, enabling quick and reliable food delivery. Meanwhile, it also supports restaurants with visibility and other management tools.
-
Dining Out (District App): From browsing menus and reviews to booking tables and discovering new restaurants for dining out experiences. The District app helps users to decide where and what to eat, both for casual and for special occasions.
-
Quick Commerce (Blinkit App): Through Blinkit, Eternal delivers groceries and daily essentials in minutes. The demand for instant groceries is rising, and Blinkit fulfils it with 2000+ dark stores located strategically.
-
Restaurant Services and Advertising: Eternal also earns by offering marketing solutions, data insights, and operational support to restaurants.
Eternal Limited (Zomato) Growth Outlook
Below are key components of Eternal’s growth plans.
- Eternal’s quick commerce segment Blinkit targets 3000 dark stores by March 2027.
- Eternal predicts food delivery growth to reach 20% YoY.
- The company aims to gain market share from Flipkart and Amazon in e-commerce and disrupt the ad market.
- Growing the dining out business segment by promoting the District app.
- Deepinder Goyal’s commitment to make Eternal as India’s most valuable company, serving a billion customers and creating societal impact.
Eternal Limited (Zomato) Financials (FY25 vs FY24)
Revenue: Eternal Limited (Zomato) reported a consolidated revenue of ₹21,320 crore in FY25 vs ₹12,961 crore in FY24. It showed an increase of 64.49% on a yearly basis, reflecting robust growth.
Operating Profit: The company reported an operating profit of ₹697 crore in FY25 vs ₹291 crore in FY24. It showed an increase of 139.51% on a year-on-year basis, indicating that the company's operating profit is growing well.
Net Profit: Eternal reported a net profit of ₹527 crore in FY25 compared to ₹351 crore in FY24. It showed an increase of 50.12% on a yearly basis, indicating a massive improvement in overall performance.
Eternal Limited (Zomato) Q3 FY26 Results
In Q3 FY26, Eternal Limited (Zomato) reported a net profit of ₹102 crore compared to ₹59 crore in Q3 FY25, up by 72% on a YoY basis. In the last quarter, Eternal’s net profit was ₹65 crore. Therefore, on a quarter-on-quarter (QoQ) basis, net profit rose by 56.92%.
During the quarter, Eternal recorded a strong revenue of ₹16,315 crore vs ₹5,405 crore in Q3 FY25. It reflects a revenue growth of 201% on a YoY basis. In Q2 FY26, the revenue was ₹13,590 crore. Therefore, on a quarter-on-quarter (QoQ) basis, it witnessed a revenue growth of 20.05%.
Eternal’s EBITDA rose by 28% at ₹364 crore compared to ₹285 crore in Q3 FY25. The EBITDA margin declined to 2.3%, compared with 3% in the same period last year.
Zomato Financial Highlights
- Revenue: Zomato reported revenue of ₹55,760.00 crore in FY26 vs ₹21,320.00 crore in FY25. It showed an increase of 161.54% on a yearly basis.
- Operating Profit: Zomato reported an operating profit of ₹615.00 crore in FY26 vs ₹697.00 crore in FY25. It showed a decrease of 11.76% on a year-on-year basis.
- Net Profit: Zomato reported a net profit of ₹366.00 crore in FY26 vs ₹527.00 crore in FY25. It showed a decrease of 30.55% on a yearly basis.
Zomato Quarterly Result Highlights
- Zomato reported revenue of ₹20,586.00 crore in Jun 2026, compared with ₹17,634.00 crore in Mar 2026, representing an increase of 16.74% on a quarter-on-quarter (QoQ) basis.
- Zomato reported an operating profit of ₹272.00 crore in Jun 2026, compared with ₹228.00 crore in Mar 2026, representing an increase of 19.30% on a quarter-on-quarter (QoQ) basis.
- Zomato reported a profit of ₹92.00 crore in Jun 2026, compared with ₹174.00 crore in Mar 2026, reflecting a decrease of 47.13% on a QoQ basis.
- The earnings per share (EPS) of Zomato stood at ₹0.60 during Jun 2026.

Similar Stocks
FAQs on Zomato Share Price
What is Zomato share price today?
Zomato share price is ₹280.00 as on 24 Jul, 2026, 15:59 IST.
How has the Zomato share price performed in the past?
In the last 1 year, Zomato delivered a return of -10.59%. The Zomato share price hit a high of ₹368.45 and low of ₹212.60.
How much is the Mutual Fund shareholding in Zomato shares?
The Mutual Fund Shareholding in Zomato was 31.68% at the end of Jun 2026.

What is the the 52-week high and low of Zomato shares ?
The 52-week high and low of Zomato share is ₹368.45 and ₹212.60 as of 24 Jul, 2026.

What is the market cap of Zomato?
The market capitalisation of Zomato is ₹2,70,210.00 Crores as on 24 Jul, 2026.
What are the stock symbols of Zomato?
The stock symbol of Zomato is ETERNAL on the NSE, 543320 on the BSE, and the ISIN is INE758T01015.
What was yesterday's closing price of Zomato shares ?
Zomato shares closed yesterday at ₹287.10 on NSE & ₹286.70 on BSE
How to buy Zomato shares?
To buy Zomato shares, open a demat account with Upstox and complete the KYC process. Once your account is set up, search for the stock and place your order.
Can I buy Zomato shares on Holidays?
No, shares of Zomato or any other publicly traded company cannot be bought or sold on holidays when the stock exchanges are closed. You can only buy or sell Zomato shares on days when the stock exchanges are open for trading. It's important to check the NSE & BSE holidays calendar, before placing any trades to avoid any inconvenience.
What is the PE and PB ratio of Zomato?
The PE and PB ratio of Zomato is 622.22 and 8.71 respectively, as on 24 Jul, 2026, 15:59 IST.