Established in: 1986
Managing Director: Mohit Joshi
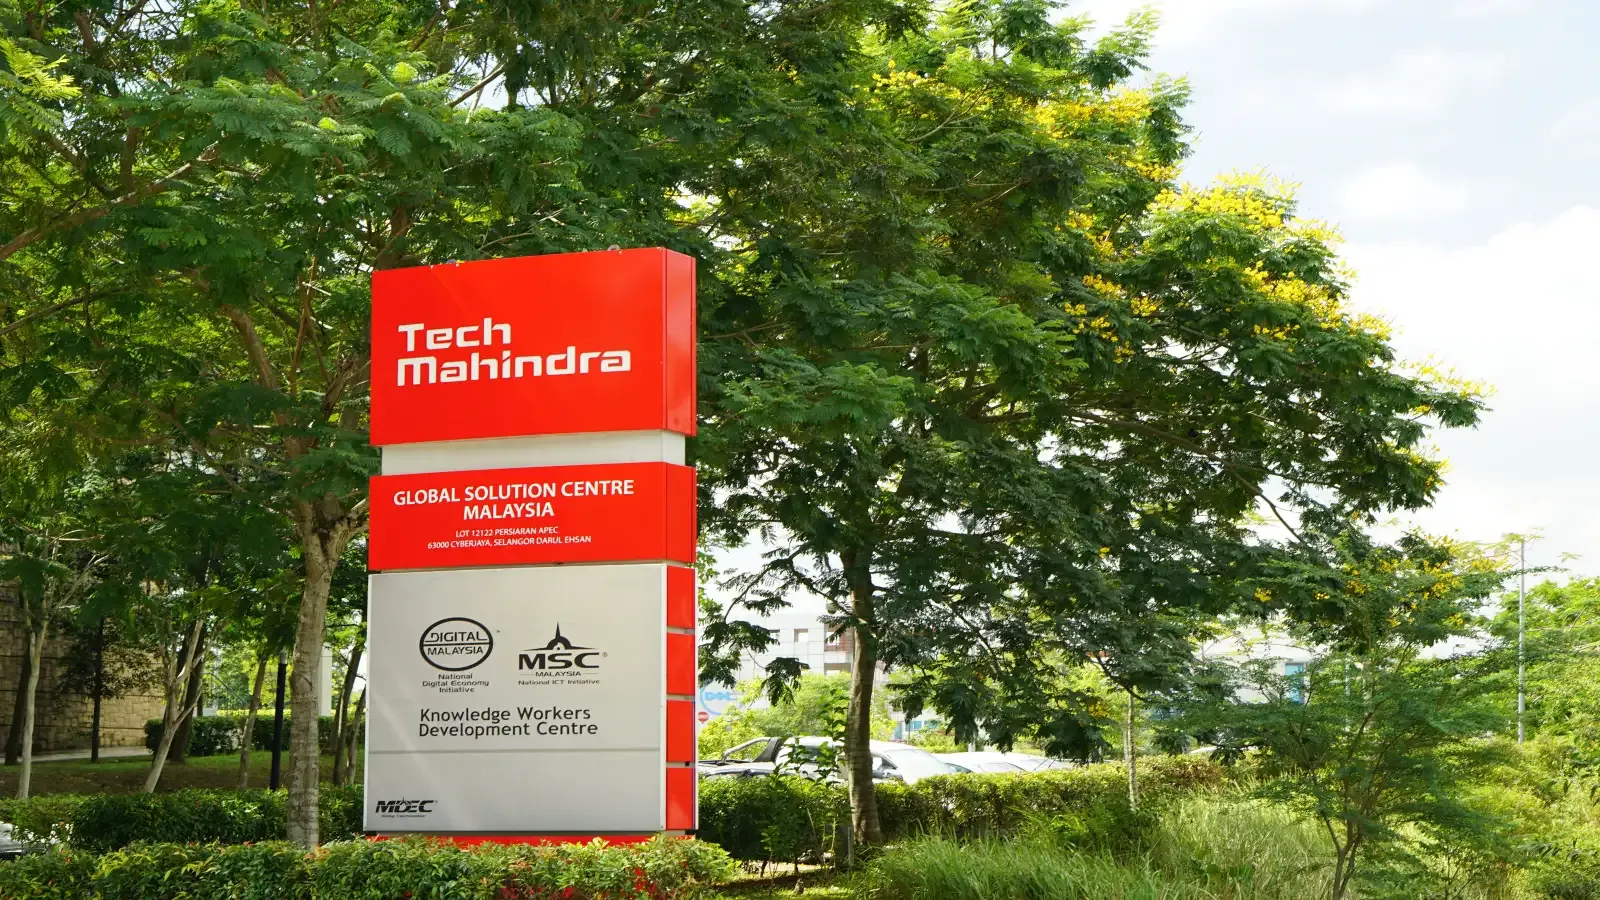
Tech Mahindra is a global consulting service and systems integrator operating in 90+ countries. The company was established in 1986 as a joint venture between Mahindra & Mahindra and BT Group and is headquartered in Pune, with a registered office based in Mumbai, Maharashtra.
Tech Mahindra Limited launched its IPO and went public in August 2006, issuing shares at ₹365 per share and raising around ₹465 crore. Following the successful IPO, the company was listed on NSE and BSE on August 28, 2006.
History of Tech Mahindra Limited
Tech Mahindra Limited was established in 1986 as a 60:40 joint venture between Mahindra & Mahindra and British Telecom, initially known as Mahindra British Telecom. In its early years, the company primarily catered to the telecommunications industry and had British Telecom as its biggest client.
In 2006, Mahindra British Telecom was renamed Tech Mahindra and went public through an IPO. The company is a part of the Mahindra Group, which was founded in 1945 and is one of the largest multinational federations of companies.
Business Segments of Tech Mahindra Limited
The following are the business segments of Tech Mahindra Limited.
- IT and Business Process Services
IT business operations are the core revenue driver of the company and account for around 80-90% of the business. The company offers IT consulting, software application development, maintenance services, cloud infrastructure, engineering and AI solutions.
The company also provides business re-engineering, enterprise support services and global customer lifecycle management services designed to enhance productivity and reduce the rate at which customers stop doing business with the company.
Tech Mahindra offers digital transformation and technology services to over 1,200 global customers across sectors such as communications and media, manufacturing, banking and financial services, healthcare, and retail and logistics.
Future Plans of Tech Mahindra Limited
The following are the future plans of Tech Mahindra Limited.
Tech Mahindra Limited is shifting from AI experimentation to full-scale AI applications. It is focusing on smart data practices, generative AI studios and integrating AI-led productivity into core business processes.
The company has developed and launched cyber-resilient and AI-powered GCCs that combine domain expertise with ESG principles. The company is increasing AI-driven 5G deployment, Network-as-a-Service (NaaS), and adaptive network edge capabilities through its strategic alliances, such as the AI-RAN alliance.
Tech Mahindra is implementing a long-term collaboration with AMD and IBM to develop a hyper-scalable, secure computing infrastructure. The company is also migrating older legacy computer systems to modern cloud environments. Furthermore, Tech Mahindra offers advanced digital twin and manufacturing solutions customised to optimise processes, moving client infrastructure from traditional automation to autonomic operations.
The company has a strong presence in North America and is currently scaling operations in the Middle East countries and Japan. Tech Mahindra Limited is shifting from high-volume and small-scale acquisitions to integrating strategic assets that could help build high-value intellectual property. It is targeting to increase its wallet share of its top 30 accounts.
The company is endeavouring to achieve zero-waste-to-landfill status for its various properties and hit net-zero emissions by 2035.
Subsidiaries of Tech Mahindra Limited
The following companies are subsidiaries of Tech Mahindra Limited.
- Comviva Technologies
- Pininfarina
- BORN Group
- HCI Group
- Target Group
- Perigord
- Tenzing
- Tech Mahindra Incorporated in the United States of America
- Tech Mahindra GmbH in Germany
- Tech Mahindra Pte Limited in Singapore
Tech Mahindra Financial Highlights
- Revenue: Tech Mahindra reported revenue of ₹56,847.30 crore in FY26 vs ₹53,843.70 crore in FY25. It showed an increase of 5.58% on a yearly basis.
- Operating Profit: Tech Mahindra reported an operating profit of ₹6,573.10 crore in FY26 vs ₹5,653.20 crore in FY25. It showed an increase of 16.27% on a year-on-year basis.
- Net Profit: Tech Mahindra reported a net profit of ₹4,805.50 crore in FY26 vs ₹4,253.00 crore in FY25. It showed an increase of 12.99% on a yearly basis.
Tech Mahindra Quarterly Result Highlights
- Tech Mahindra reported revenue of ₹15,605.50 crore in Jun 2026, compared with ₹14,871.40 crore in Mar 2026, representing an increase of 4.94% on a quarter-on-quarter (QoQ) basis.
- Tech Mahindra reported an operating profit of ₹2,041.90 crore in Jun 2026, compared with ₹1,790.60 crore in Mar 2026, representing an increase of 14.03% on a quarter-on-quarter (QoQ) basis.
- Tech Mahindra reported a profit of ₹1,486.30 crore in Jun 2026, compared with ₹1,356.40 crore in Mar 2026, reflecting an increase of 9.58% on a QoQ basis.
- The earnings per share (EPS) of Tech Mahindra stood at ₹54.28 during Jun 2026.