
MCX Share Price

₹ 3,720.00

+₹95.30 (2.63%)
1D
Last updated 13 Nov, 2026, 15:58 IST

MCX Share Price Today

As of 14 Nov 2026, MCX share price is ₹3,720.00. The stock opened at ₹3,600.00, compared to its previous close of ₹3,624.70. During today's trading session, MCX share price moved in the range of ₹3,595.00 to ₹3,767.40, with an average price of ₹3,681.20 for the day. Looking at its last 52-week, the stock has touched a low of ₹1,921.00 and a high of ₹3,767.40. On the performance front, MCX share price has increased by 16.10% over the last six months and is up 93.81% on a year-on-year basis.

Share price over the last 1 day rose from 3620.90 to 3720.00, ranging between 3620.90 and 3762.90.

₹3,595.00
2.63% up today
₹3,767.40
1D LOW
1D HIGH

MCX Stock Insights

Latest Earning
Op Profit TrendUp by 22.20% QoQ
Latest Earning
Net Profit TrendUp by 9.95% QoQ
Latest Earning
Revenue TrendUp by 13.23% QoQ
Stock Performance
OutperformingBeat Nifty by 20.67 % in last 3 month
Shareholding Pattern
DIIDII decreased stake by 2.51%
Shareholding Pattern
FIIFII decreased stake by 9.31%
MCX stock performance
Open₹3,600.00
High₹3,767.40
Low₹3,595.00
Prev. close₹3,624.70
MCX trading activity
Volume32,53,739
Average traded price₹3,709.06
Last traded time03:58:53 13 Nov
Last traded quantity2

Circuit
L
H
₹3,348.00
₹4,092.00
52-week
L
H
₹1,921.00
₹3,767.40
Mkt Cap Cr
94,984.46

P/E
52.8

P/B
27.05

ROA
23.1%
ROE
51.22%

ROCE
65.14%

Quick Ratio
1.31

EV/EBITDA
36.68

Based on fundamentals, this stock's

Performance: 5 out of 5, Excellent
Performance
Excellent
Multi Comm. Exc. outperforming all market indices
Valuation: 1 out of 5, Overvalued
Valuation
Overvalued
Multi Comm. Exc. appears overvalued compared to its peers
Earnings: 5 out of 5, Excellent
Earnings
Excellent
Multi Comm. Exc. revenue, operating profit and net profit are growing
Peer Comparison
Peer comparison — key ratios
NameMkt Cap CrP/EP/BROAROEROCEQuick RatioEV/EBITDA
BSE1,59,445.9652.2820.221.0%38.76%51.28%1.5335.93
CDSL30,409.5060.0415.2518.5%25.46%33.77%2.9240.67
COMPUTER AGE MNGT SER LTD18,390.1735.5812.5326.94%35.49%45.59%3.4322.93
KFin Technologies16,599.2947.3410.1612.27%21.47%20.36%3.327.93
Indian Energy Exchange10,361.4719.837.0919.95%35.8%46.63%2.014.38

Auto-generated based on historical fundamentals; not a recommendation to buy/sell.

MCX Company Background

ISIN
INE745G01043
Sector Market Cap
₹ 94,984.46 Cr

Multi Commodity Exchange of India Limited (MCX) is an Indian commodity exchange company. It was founded by the Government of India in 2003 and is headquartered in Mumbai. The exchange operates within the regulatory framework of the Securities and Exchange Board of India.

MCX secured the 5th spot globally in the ranking of commodity options contracts traded in 2022, according to data released by the Futures Industry Association (FIA). MCX Crude Oil Options secured the top position as the most traded crude oil options worldwide. On the other hand, MCX Silver Options and MCX Natural Gas Futures claimed the second spot in their respective categories. MCX was also the 7th largest exchange globally by the volume of commodity futures contracts traded in 2022.

The market capitalisation of MCX is over ₹15,600 crore as of January 12, 2024. MCX share price has gained over 80% in the last three years.

Business Operations

MCX operates as a demutualised exchange. It facilitates nationwide online trading, clearing and settlement operations for commodity futures transactions. MCX functions as a single-segment business. It provides futures trading to many commodities across various classes, including bullion, energy, ferrous and non-ferrous metals, oils and oilseeds, cereals and other commodities.

MCX is also India's first exchange to introduce commodity options and futures contracts on bullion, base metals and energy indices. The company has 548 registered members and 50,228 authorised persons. It has a reach to approximately 700 cities and towns across India. MCX has a market share of over 96% in terms of the value of traded commodity futures contracts.

The company has also established strategic partnerships with prominent international exchanges, including the CME Group and the London Metal Exchange. The exchange has signed MoUs with well-known global exchanges such as the Dalian Commodity Exchange, Taiwan Futures Exchange and European Energy Exchange AG.

MCX has a fully-owned subsidiary called Multi Commodity Exchange Clearing Corporation Limited (MCXCCL). It is the first clearing corporation in the Indian commodity derivatives market. MCXCCL offers collateral management and risk management services and oversees the clearing and settlement processes for trades conducted on MCX. The company also serves as the central counterparty for all transactions carried out on the MCX trading platform.

For efficient business operations, MCXCCL ensures that members of MCX have access to warehousing arrangements and related facilities. It has a network of warehouses and vaults for the delivery of commodities traded on the MCX platform. MCXCCL has established agreements with six warehouse service providers to facilitate physical deliveries of agricultural commodities and base metals. The clearing corporation operates from 33 accredited warehouses, with 18 of them registered with the Warehousing Development and Regulatory Authority.

MCXCCL has also entered into agreements with four vault service providers for the physical deliveries in the bullion segment. These agreements cover 25 accredited vaults situated at various delivery centres.

MCX Financial Highlights

  • Revenue: MCX reported revenue of ₹2,429.05 crore in FY26 vs ₹1,208.86 crore in FY25. It showed an increase of 100.94% on a yearly basis.
  • Operating Profit: MCX reported an operating profit of ₹1,690.33 crore in FY26 vs ₹699.40 crore in FY25. It showed an increase of 141.68% on a year-on-year basis.
  • Net Profit: MCX reported a net profit of ₹1,331.55 crore in FY26 vs ₹560.04 crore in FY25. It showed an increase of 137.76% on a yearly basis.

MCX Quarterly Result Highlights

  • MCX reported revenue of ₹851.28 crore in Sep 2026, compared with ₹751.79 crore in Jun 2026, representing an increase of 13.23% on a quarter-on-quarter (QoQ) basis.
  • MCX reported an operating profit of ₹639.24 crore in Sep 2026, compared with ₹523.13 crore in Jun 2026, representing an increase of 22.20% on a quarter-on-quarter (QoQ) basis.
  • MCX reported a profit of ₹454.57 crore in Sep 2026, compared with ₹413.44 crore in Jun 2026, reflecting an increase of 9.95% on a QoQ basis.
  • The earnings per share (EPS) of MCX stood at ₹52.22 during Sep 2026.

Data Source: BSE, Company announcements

Securities shown are illustrative, not recommendations. Past performance does not guarantee future results.

Promoters
0.00%
FII
27.07%
Other DII
20.22%
Retail and other
18.77%
Mutual funds
33.95%
Foreign Institutional Investor (FII)
FII shareholding by period
Dec 202520.64%
Mar 202626.08%
Jun 202629.84%
Sep 202627.07%

MCX Investment Returns

1 day
+2.63%

1 week
+5.44%

1 month
+12.45%

1 year
+93.81%

3 years
+570.34%

5 years
+854.51%

MCX Share Price History

MCX share price history by day, showing open and close prices and the percentage change
Day
Open / Close
Change %
13 Nov 26
₹3,600.00 / ₹3,720.00
+2.63%
12 Nov 26
₹3,610.00 / ₹3,624.70
+0.20%
11 Nov 26
₹3,581.30 / ₹3,617.60
+2.05%
09 Nov 26
₹3,557.00 / ₹3,545.00
-0.34%
Show more

MCX Financials

Full statement

Income Statement · Consolidated

Income Statement · Consolidated — all values in INR Crore
ParticularsMar 2026Mar 2025Mar 2024Mar 2023
Revenue₹2,302.00₹1,112.66₹683.55₹513.51
Other Income₹127.05₹96.20₹75.39₹67.66
Total Revenue₹2,429.05₹1,208.86₹758.94₹581.17
Total Expenses₹733.82₹511.55₹655.44₹385.62
Profit Before Tax₹1,690.33₹699.40₹101.98₹190.57
Tax₹358.78₹139.36₹18.87₹41.60
Profit After Tax₹1,331.55₹560.04₹83.11₹148.97
EPS - Basic₹52.22₹21.96₹16.30₹29.27
EPS - Diluted₹52.22₹21.96₹16.30₹29.27

Cash Flow · Consolidated

Cash Flow · Consolidated — all values in INR Crore
ParticularsMar 2026Mar 2025Mar 2024Mar 2023
Profit before tax₹1,690.33₹699.40₹101.98₹190.57
Income before WC changes₹1,500.27₹586.04-₹9.82₹158.38
Change in Assets-₹82.55₹32.13₹70.20-₹118.45
Change in Liabilities₹1,891.62₹372.05₹432.85₹151.02
Change in WC₹1,809.07₹404.18₹503.05₹32.57
Cash flow from Operations₹3,034.72₹950.13₹442.12₹141.42
Cash flow from Investing-₹2,399.10-₹750.83-₹345.51-₹8.08
Cash flow from Financing-₹154.47-₹40.20-₹98.18-₹89.48
Total Cash Flow₹481.15₹159.10-₹1.57₹43.86
Cash (Start of the year)₹338.61₹179.51₹181.08₹137.22
Cash (End of the year)₹819.76₹338.61₹179.51₹181.08

Balance Sheet · Consolidated

Balance Sheet · Consolidated — all values in INR Crore
ParticularsMar 2026Mar 2025Mar 2024Mar 2023
Non-Current Assets₹3,348.79₹1,664.45₹1,958.42₹1,396.81
Current Assets₹4,151.84₹2,660.72₹1,450.37₹1,625.94
Total Assets₹7,500.63₹4,325.17₹3,408.79₹3,022.75
Current Liabilities₹3,169.74₹1,422.54₹1,183.87₹897.60
Net Current Asset₹982.10₹1,238.18₹266.50₹728.34
Non-Current Liabilities₹1,482.95₹1,018.23₹846.45₹645.85
Equity Capital₹2,847.94₹1,884.40₹1,378.47₹1,479.30
Total Equity & Liabilities₹7,500.63₹4,325.17₹3,408.79₹3,022.75

Income Statement · Standalone

Income Statement · Standalone — all values in INR Crore
ParticularsMar 2026Mar 2025Mar 2024Mar 2023
Revenue₹2,153.67₹1,011.58₹594.95₹449.22
Other Income₹128.09₹95.79₹76.29₹72.25
Total Revenue₹2,281.76₹1,107.37₹671.24₹521.47
Total Expenses₹907.31₹553.32₹600.63₹350.12
Profit Before Tax₹1,374.45₹554.05₹70.61₹171.35
Tax₹345.41₹139.27₹18.65₹41.52
Profit After Tax₹1,029.04₹414.78₹51.96₹129.83
EPS - Basic₹40.36₹16.27₹10.19₹25.51
EPS - Diluted₹40.36₹16.27₹10.19₹25.51

Cash Flow · Standalone

Cash Flow · Standalone — all values in INR Crore
ParticularsMar 2026Mar 2025Mar 2024Mar 2023
Profit before tax₹1,374.45₹554.05₹70.61₹171.35
Income before WC changes₹1,332.60₹530.37₹35.64₹133.29
Change in Assets-₹56.46₹34.42₹100.29-₹135.35
Change in Liabilities₹416.17₹91.95₹28.03-₹4.80
Change in WC₹359.71₹126.37₹128.32-₹140.15
Cash flow from Operations₹1,463.86₹611.07₹117.12-₹63.77
Cash flow from Investing-₹1,310.07-₹570.33-₹19.22₹151.18
Cash flow from Financing-₹154.40-₹39.92-₹98.15-₹89.45
Total Cash Flow-₹0.61₹0.82-₹0.25-₹2.04
Cash (Start of the year)₹0.98₹0.16₹0.41₹2.45
Cash (End of the year)₹0.37₹0.98₹0.16₹0.41

Balance Sheet · Standalone

Balance Sheet · Standalone — all values in INR Crore
ParticularsMar 2026Mar 2025Mar 2024Mar 2023
Non-Current Assets₹2,357.32₹1,632.23₹1,370.01₹1,484.40
Current Assets₹1,372.73₹663.34₹438.10₹372.86
Total Assets₹3,730.05₹2,295.57₹1,808.11₹1,857.26
Current Liabilities₹801.93₹284.48₹196.35₹207.63
Net Current Asset₹570.80₹378.86₹241.75₹165.23
Non-Current Liabilities₹111.88₹83.59₹64.75₹53.93
Equity Capital₹2,816.24₹1,927.50₹1,547.01₹1,595.70
Total Equity & Liabilities₹3,730.05₹2,295.57₹1,808.11₹1,857.26
* All values are in INR Crore
MCX market depth
Bid quantityBid priceAsk priceAsk quantity
0037201193
0000
0000
0000
0000
Total bid quantity0
Total ask quantity1,193
MCX technical summary
Bearish indicators5
Neutral indicators2
Bullish indicators1
OverallStrong Bearish
by SEBI experts

Expert Pick

EXPPICK
Stop-loss
Stop-loss is locked. Sign in to view.
Entry price
Entry price is locked. Sign in to view.
Target
Target is locked. Sign in to view.
Indicator
Value
Verdict

RSI (14)
68.58
Neutral

ATR (14)
130.57
Neutral

STOCH(9,6)
90.8
Bearish

STOCH RSI (14)
100
Bearish

ADX(9)
43.44
Bearish

UO(9)
70.77
Bearish

ROC(12)
16.96
Bullish

WillR(14)
-7.08
Bearish
Period
Simple value
Exponential vaue

5D
3612.86
3612.53

10D
3501.24
3517.3

20D
3323.94
3412.63

50D
3298.19
3286.95

100D
3092.86
3157.16
Volume trend — traded volume by day
13 Nov32L
12 Nov15L
11 Nov26L
9 Nov21L
8 Nov7L
Average20L

Technical indicators used here are for indicative purposes only. Kindly do not treat it as an investment or trading advice

Compare against other stocks

MCX
Financial Services
Add Stock
Add Another

Mutual Funds Invested in MCX

Fund name
AUM
Tata Nifty Capital Markets Index Fund
17.53%

Motilal Oswal Nifty Capital Market Index Fund
17.45%

Groww Nifty Capital Markets ETF FOF
17.42%

MCX Returns Calculator

Ex-date: 28 Aug 2026

Ex-date: 02 Jan 2026

MCX Latest News

1 week ago
Emcure Pharma, BHEL, Fractal Analytics among buzzing stocks; SENSEX recovers 400 pts, NIFTY above 23,850
1 week ago
MCX shares tumble 7% despite strong performance in Q2 FY27 results; further earnings growth potential ahead?
1 week ago
Q2 results, Nov 3: SBI, NSE, Bajaj Finserv, Solar Industries, Lupin, MCX, Graphite India, Gujarat Fluorochemicals, GSK, others to post earnings
1 month ago
Welspun Corp., MCX to Zydus Life: Top five Nifty 500 stocks that hit 52-week high on Sept 25; check full list

1 month ago
NSE IPO opens: BSE, CDSL, other capital market stocks rally; here’s why

1 month ago
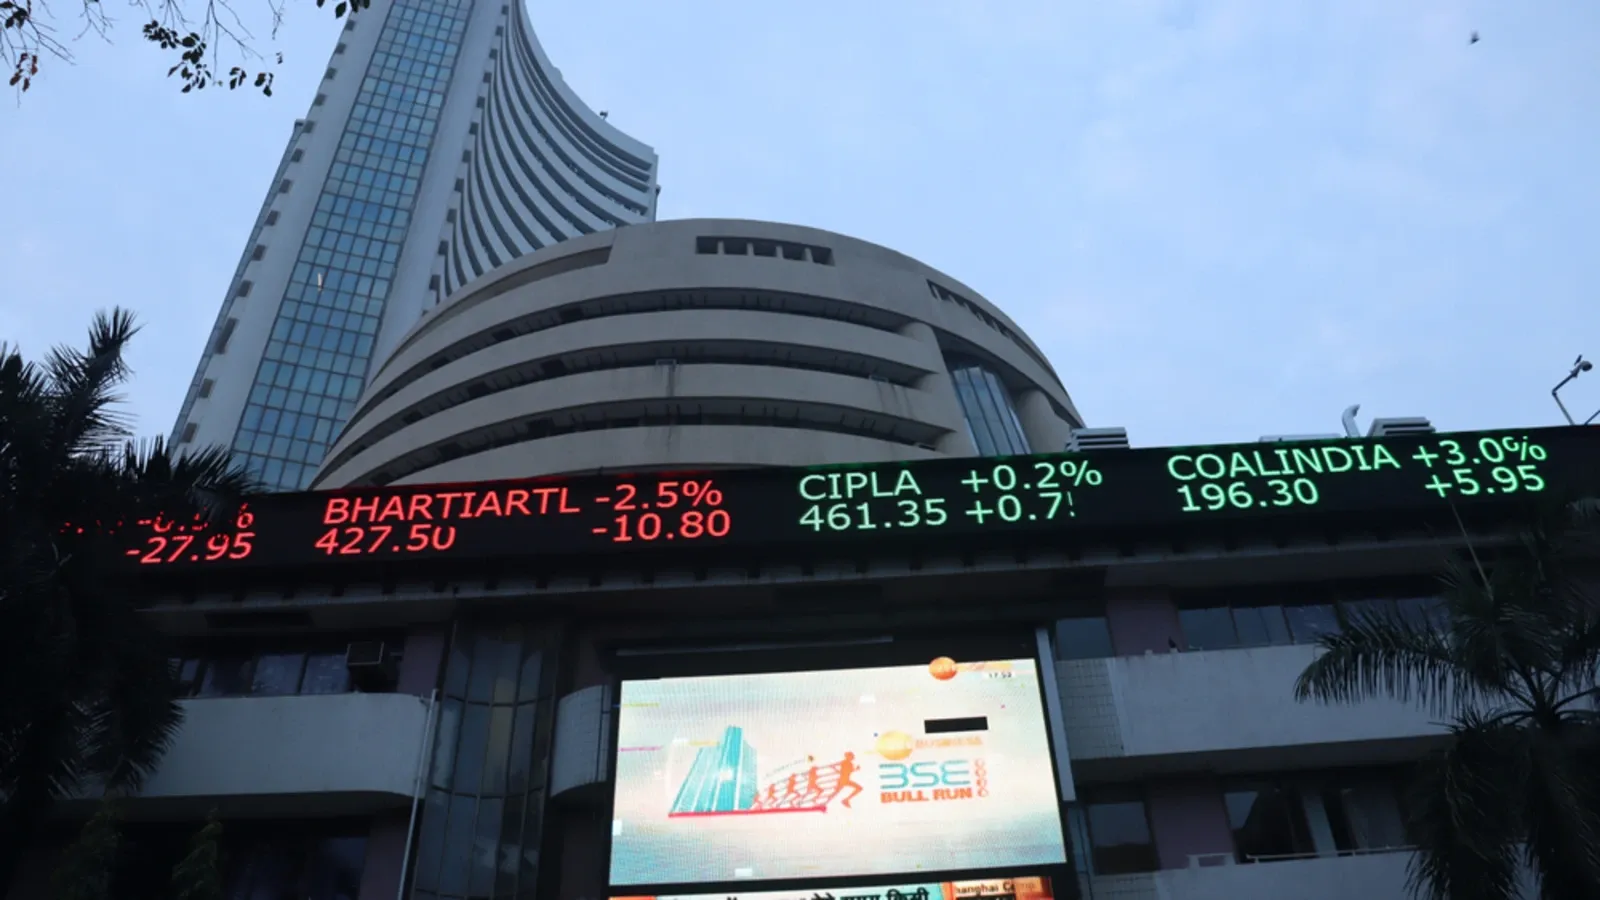
MCX, Groww, BSE, CDSL, among others drag Nifty Capital Market index down 2%; key triggers
2 months ago
BSE share price declines nearly 4% over conservative outlook; Here’s what Bernstein analysts predict

2 months ago
MCX, Honasa Consumer, Paras Defence, other upcoming dividend stocks, bonus issues in focus this week; check list
3 months ago
Q1 results: ITC, Adani Power, LIC Housing Finance, Tata Power, MCX, Godrej Properties, others to post earnings on August 1; check list

5 months ago
NIFTY50, SENSEX trade lower in noon deals; Wockhardt, Coal India, IndiGo among buzzing stocks
Showing news item 1 of 10

MCX Share Price FAQs


Please be aware that MCX stock prices are subject to continuous fluctuations due to various factors.