Logo

Interglobe Aviation Share Price

NSE: INDIGO
|
Airlines
₹ 5,426.50
-₹17.50 (-0.32%)
1D
Last updated 03 Jul, 2026, 15:55 IST

Interglobe Aviation Share Price Today

As of 5 Jul 2026, Interglobe Aviation share price is ₹5,426.50. The stock opened at ₹5,459.50, compared to its previous close of ₹5,444.00. During today's trading session, Interglobe Aviation share price moved in the range of ₹5,385.00 to ₹5,476.50, with an average price of ₹5,430.75 for the day. Looking at its last 52-week, the stock has touched a low of ₹3,895.20 and a high of ₹6,232.50. On the performance front, Interglobe Aviation share price has increased by 6.28% over the last six months and is down 5.89% on a year-on-year basis.


₹5,385.00
0.32% down today
₹5,476.50
1D LOW
1D HIGH

Interglobe Aviation Returns Calculator

Open
₹5,459.50
High
₹5,476.50
Low
₹5,385.00
Prev. close
₹5,444.00

Circuit
L
H
₹4,884.00
₹5,969.00
52-week
L
H
₹3,895.20
₹6,232.50

Interglobe Aviation Shareholder Returns

Interglobe Aviation Share Price History

Mkt Cap Cr
2,10,622.00

P/E
-88.00

P/B
30.21

ROE
-14.24%

D/E
13.21

ROCE
5.32%

Div. Yield
0.00%

EPS(TTM)
-64.74
Turnover
0.82

EV/EBITDA
17.81

Net Margin
0.00%

Op. Margin
0.00%

ROA
-1.76%

Quick Ratio
0.00

Curr. Ratio
2.31
Based on fundamentals, this stock's
Step 5 of 5
Performance
Excellent
Interglobe Aviat outperforming all market indices
Step 1 of 5
Valuation
Overvalued
Interglobe Aviat appears overvalued compared to its peers
Step 2 of 5
Earnings
Poor
Interglobe Aviat earnings have been degrowing
Peer Comparison
Peer comparison — key ratios
NameMkt Cap CrP/EP/BROED/EROCEBook ValueDiv. YieldTurnoverEPS(TTM)
Raymond3,929.510.400.75168.44%0.003.41%1.200.00%0.00790.71
TAAL TECH LTD.1,128.9419.914.6123.14%0.0030.36%680.210.97%0.90172.48
FLYSBS AVIATION LIMITED792.080.003.1319.37%0.1224.03%146.160.00%1.0038.76
GLOBAL VECTRA HELICORP224.63-6.960.00398.47%-74.22-1.65%-5.790.00%1.36-23.06
ZEAL GLOBAL SERVICES LTD160.187.500.9612.83%0.2216.02%67.572.31%3.148.67

Interglobe Aviation Financials

Full statement

Income Statement · Consolidated

Income Statement · Consolidated — all values in INR Crore
ParticularsMar 2025Mar 2024Mar 2023Mar 2022
Revenue₹80,802.90₹68,904.34₹54,446.45₹25,930.93
Other Income₹3,295.30₹2,326.82₹1,434.97₹725.60
Total Revenue₹84,098.20₹71,231.16₹55,881.42₹26,656.53
Total Expenses₹76,504.80₹63,181.85₹56,185.80₹32,810.21
Profit Before Tax₹7,593.40₹8,049.31-₹304.39-₹6,153.68
Tax₹335.00-₹123.16₹1.40₹8.16
Profit After Tax₹7,258.40₹8,172.47-₹305.79-₹6,161.85
EPS - Basic₹187.93₹211.84-₹7.93-₹160.01
EPS - Diluted₹187.67₹211.61-₹7.93-₹160.01

Cash Flow · Consolidated

Cash Flow · Consolidated — all values in INR Crore
ParticularsMar 2025Mar 2024Mar 2023Mar 2022
Profit before tax₹7,593.40₹8,049.31-₹304.39-₹6,153.68
Income before WC changes₹20,066.10₹17,378.75₹9,984.56₹1,527.41
Change in Assets-₹4,506.50-₹2,687.64-₹896.47-₹677.79
Change in Liabilities₹9,024.20₹7,037.87₹4,029.12₹1,439.35
Change in WC₹4,517.70₹4,350.22₹3,132.64₹761.55
Cash flow from Operations₹24,151.30₹21,217.58₹12,727.94₹2,090.58
Cash flow from Investing-₹12,759.30-₹11,808.99-₹4,059.49₹1,502.45
Cash flow from Financing-₹11,015.40-₹9,978.53-₹8,432.46-₹3,087.84
Total Cash Flow₹376.60-₹569.95₹235.99₹505.19
Cash (Start of the year)₹695.30₹1,267.97₹1,015.33₹508.89
Cash (End of the year)₹1,073.10₹695.28₹1,267.97₹1,015.33

Balance Sheet · Consolidated

Balance Sheet · Consolidated — all values in INR Crore
ParticularsMar 2025Mar 2024Mar 2023Mar 2022
Non-Current Assets₹65,140.40₹46,371.40₹33,021.11₹25,733.72
Current Assets₹50,703.10₹35,853.12₹26,148.71₹20,228.88
Total Assets₹115,843.50₹82,224.52₹59,169.82₹45,962.60
Current Liabilities₹34,217.80₹30,798.32₹23,851.15₹22,417.14
Net Current Asset₹16,485.30₹5,054.80₹2,297.57-₹2,188.26
Non-Current Liabilities₹72,257.50₹49,429.77₹41,565.19₹29,533.52
Equity Capital₹9,368.20₹1,996.43-₹6,246.52-₹5,988.06
Total Equity & Liabilities₹115,843.50₹82,224.52₹59,169.82₹45,962.60

Income Statement · Standalone

Income Statement · Standalone — all values in INR Crore
ParticularsMar 2025Mar 2024Mar 2023Mar 2022
Revenue₹80,803.00₹68,904.30₹54,446.45₹25,930.93
Other Income₹3,306.80₹2,325.60₹1,431.44₹724.54
Total Revenue₹84,109.80₹71,229.90₹55,877.89₹26,655.47
Total Expenses₹76,522.30₹63,186.70₹56,194.60₹32,826.49
Profit Before Tax₹7,587.50₹8,043.20-₹316.72-₹6,171.03
Tax₹334.20-₹124.30₹0.00₹0.00
Profit After Tax₹7,253.30₹8,167.50-₹316.72-₹6,171.03
EPS - Basic₹187.79₹211.71-₹8.22-₹160.25
EPS - Diluted₹187.54₹211.48-₹8.22-₹160.25

Cash Flow · Standalone

Cash Flow · Standalone — all values in INR Crore
ParticularsMar 2025Mar 2024Mar 2023Mar 2022
Profit before tax₹7,587.50₹8,043.20-₹316.72-₹6,171.03
Income before WC changes₹20,014.10₹17,355.20₹9,974.39₹1,511.61
Change in Assets-₹4,513.30-₹2,680.90-₹895.00-₹676.90
Change in Liabilities₹8,976.90₹7,019.20₹4,015.40₹1,422.93
Change in WC₹4,463.60₹4,338.30₹3,120.41₹746.03
Cash flow from Operations₹24,064.70₹21,182.80₹12,703.14₹2,064.10
Cash flow from Investing-₹12,783.60-₹11,756.40-₹4,055.18₹1,525.91
Cash flow from Financing-₹10,974.90-₹9,978.50-₹8,432.46-₹3,087.84
Total Cash Flow₹306.20-₹552.10₹215.50₹502.17
Cash (Start of the year)₹689.00₹1,243.80₹1,011.71₹508.28
Cash (End of the year)₹996.50₹689.00₹1,243.86₹1,011.71

Balance Sheet · Standalone

Balance Sheet · Standalone — all values in INR Crore
ParticularsMar 2025Mar 2024Mar 2023Mar 2022
Non-Current Assets₹65,434.30₹46,316.30₹32,971.34₹25,713.02
Current Assets₹50,479.60₹35,752.50₹26,071.35₹20,147.09
Total Assets₹115,913.90₹82,068.80₹59,042.68₹45,860.11
Current Liabilities₹34,118.10₹30,745.10₹23,813.85₹22,385.33
Net Current Asset₹16,361.50₹5,007.40₹2,257.50-₹2,238.24
Non-Current Liabilities₹72,489.00₹49,391.80₹41,531.98₹29,510.07
Equity Capital₹9,306.80₹1,931.90-₹6,303.14-₹6,035.29
Total Equity & Liabilities₹115,913.90₹82,068.80₹59,042.68₹45,860.11
* All values are in INR Crore
Qty
Bid
0
0
0
0
0
0
0
0
0
0
Ask
Qty
5426.5
12
0
0
0
0
0
0
0
0
Bid Total: 0
Ask Total: 12
Buy orders: 0%
Sell orders: 100%
Bearish
3
Neutral
3
Bullish
2
Slightly Bearish
by SEBI experts
Expert Pick
EXPPICK
Stop-loss
Entry price
Target
Indicator
Value
Verdict

RSI (14)
72.39
Bullish

ATR (14)
129.26
Neutral

STOCH(9,6)
90.58
Bearish

STOCH RSI (14)
54.09
Neutral

ADX(9)
64.47
Bearish

UO(9)
68.4
Neutral

ROC(12)
12.12
Bullish

WillR(14)
-7.5
Bearish
Period
Simple value
Exponential vaue

5D
5390.62
5380.11

10D
5261.43
5260.25

20D
4967.03
5052.8

50D
4632.35
4779.17

100D
4593.33
4750.52

About Interglobe Aviation

Interglobe Aviation logo
ISIN
INE646L01027
Sector Market Cap
₹ 2,10,622 Cr

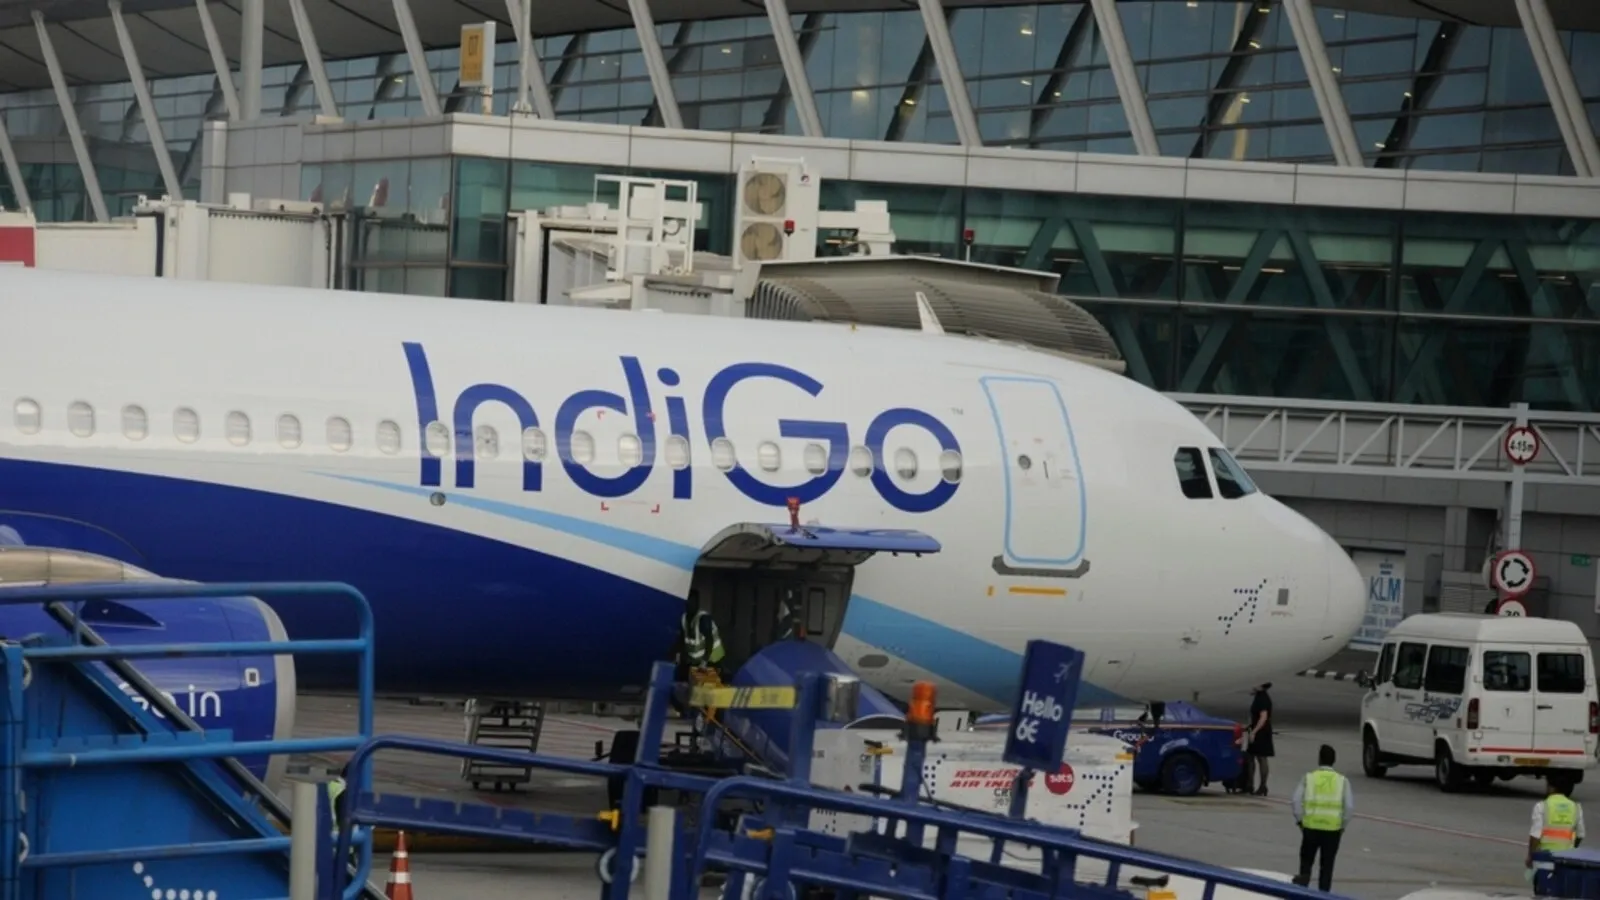
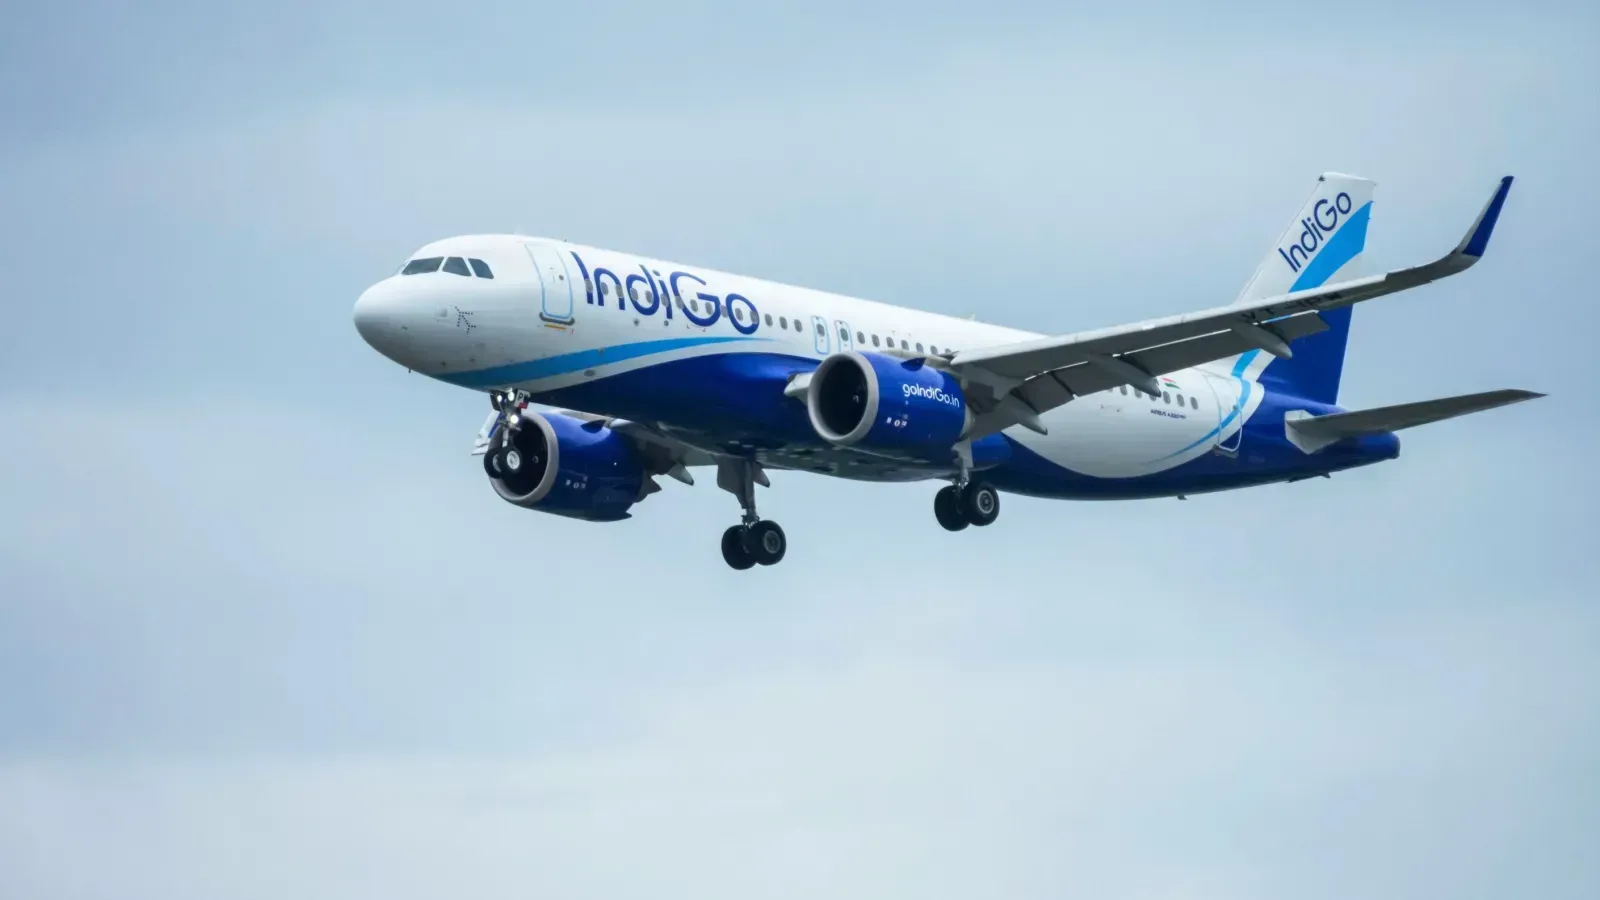
InterGlobe Aviation is one of India's leading airlines, offering passenger and cargo services on the domestic and international air travel market. The company operates its flight services under the brand name IndiGo. It is the largest airline in India with over 1,950 daily flights across 79 domestic and 32 international destinations. The company holds a 63.4% domestic market share as of September 2023. The company was originally incorporated as InterGlobe Aviation Private Limited in 2004 before becoming a public entity in 2006. IndiGo launched domestic operations in August 2006 and crossed the one million passenger mark in less than a year of operation.

Business operations

IndiGo began its international operation in 2011 and also secured its position as the largest domestic carrier in India by market share. By 2012, the airline crossed the milestone of 50 million passengers and in another two years it breached the 75 million passenger mark. The company acquired its 100th aircraft in 2014. The next year, the airlines placed an order of 250 A320neo aircraft with Airbus with deliveries to be completed by March 2017. The new aircraft powered by Pratt and Whitney's fuel-efficient geared turbofan engines would help the airline structurally reduce its cost of operations.

The company began air traffic control (ATC) operations in Hyderabad in 2017 and announced 90 new flights. IndiGo became the first Indian carrier to operate over 100 flights a day.

IndiGo’s grip over the domestic market grew stronger thanks to its aggressive pricing, making air travel affordable to a new range of customers. IndiGo’s fleet size grew to nearly 220 aircraft by the end of FY 2018-19. The company focused on having the fuel-efficient A320neos in its fleet, helping it to bring its operational cost marginally. The aircraft offered a higher seating capacity and lower unit costs.

The airline began operations on 28 new international routes, coming out of the image of being just a domestic carrier.

During FY 2019-20, IndiGo inducted 45 planes to the fleet of which 42 were fuel-efficient A320 A321NEO family aircraft. The company added 10 new domestic and 8 new international destinations.

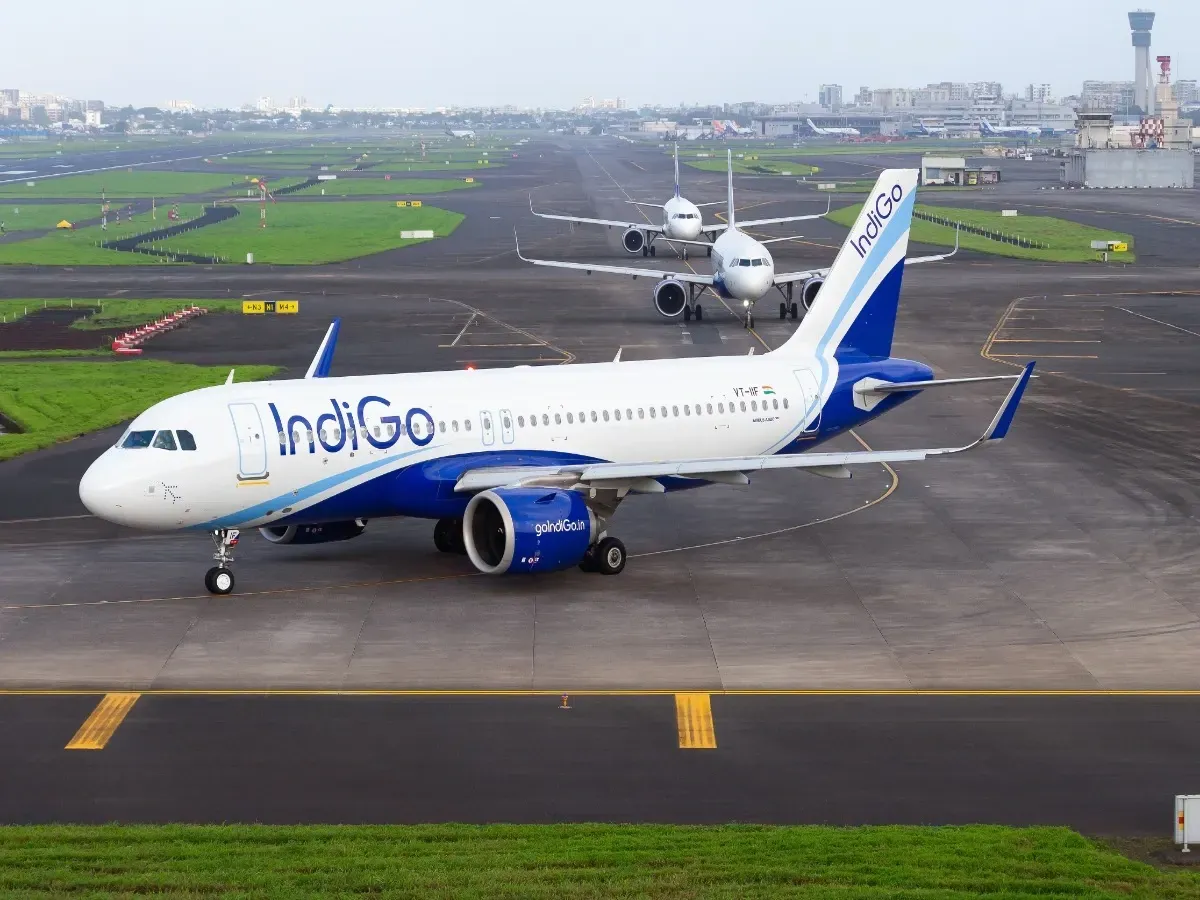
IndiGo’s fleet as of December 2023 consisted of 176 A320 neo, 93 A321 neo, 41 ATR aircraft and 1 B777 (damp lease).

The market capitalisation of IndiGo’s parent company InterGlobe Aviation stood at over ₹1.14 lakh crore as of December 30, 2023. IndiGo's share price has grown over 75% in the last three years.

Interglobe Aviation Financial Highlights

  • Revenue: Interglobe Aviation reported revenue of ₹89,513.40 crore in FY26 vs ₹84,098.20 crore in FY25. It showed an increase of 6.44% on a yearly basis.
  • Operating Profit: Interglobe Aviation reported an operating loss of ₹1,960.50 crore in FY26 vs ₹7,593.40 crore in FY25. It showed a decrease of 125.82% on a year-on-year basis.
  • Net Profit: Interglobe Aviation reported a net loss of ₹2,393.60 crore in FY26 vs ₹7,258.40 crore in FY25. It showed a decrease of 132.98% on a yearly basis.

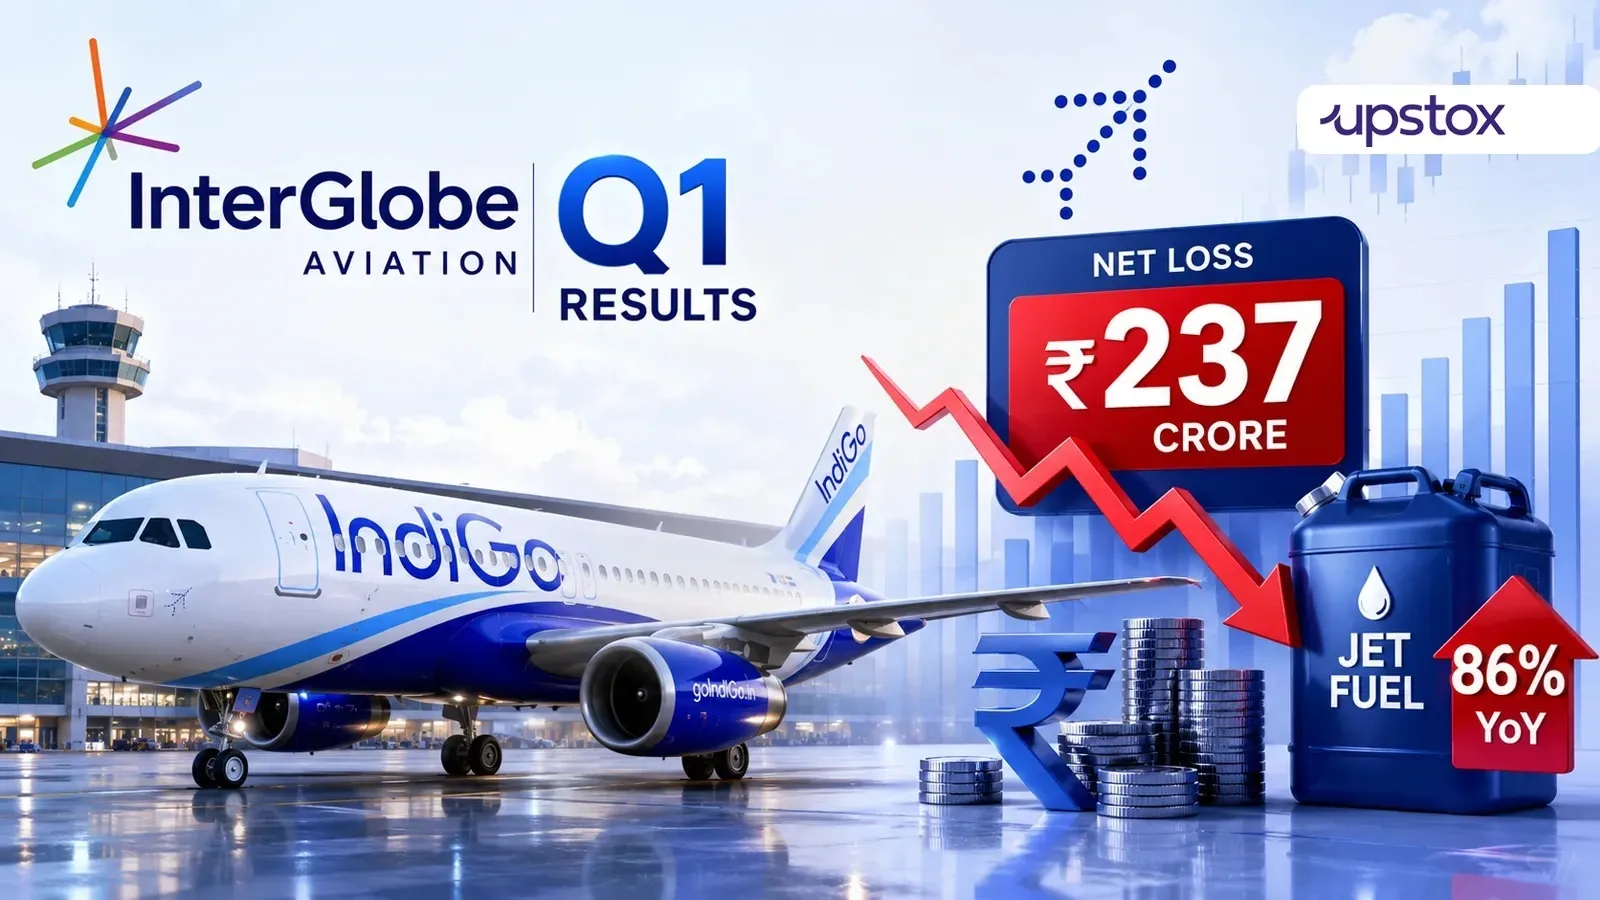
Interglobe Aviation Quarterly Result Highlights

  • Interglobe Aviation reported revenue of ₹23,830.70 crore in Mar 2026, compared with ₹24,540.60 crore in Dec 2025, representing a decrease of 2.89% on a quarter-on-quarter (QoQ) basis.
  • Interglobe Aviation reported an operating loss of ₹2,351.70 crore in Mar 2026, compared with ₹562.20 crore in Dec 2025, representing a decrease of 518.30% on a quarter-on-quarter (QoQ) basis.
  • Interglobe Aviation reported a loss of ₹2,536.90 crore in Mar 2026, compared with ₹549.10 crore in Dec 2025, reflecting a decrease of 562.01% on a QoQ basis.
  • The earnings per share (EPS) of Interglobe Aviation stood at ₹187.93 during Mar 2026.
Know more
Promoters
41.57%
FII
21.64%
Other DII
7.17%
Retail and other
5.60%
Mutual funds
24.01%
Foreign institutions - FII
Compare against other stocks
Interglobe Aviation logo
Interglobe Aviation
Airlines
Add Stock
Add Another

FAQs on Interglobe Aviation Share Price