Exide Industries Share Price

Exide Industries Share Price

NSE: EXIDEIND
|
Batteries
|
S Cap
₹ 476.10
-₹9.40 (-1.94%)
1D
Last updated 14 Aug, 2026, 15:56 IST

Exide Industries Share Price Today

As of 15 Aug 2026, Exide Industries share price is ₹476.10. The stock opened at ₹484.50, compared to its previous close of ₹485.50. During today's trading session, Exide Industries share price moved in the range of ₹475.20 to ₹486.90, with an average price of ₹481.05 for the day. Looking at its last 52-week, the stock has touched a low of ₹287.00 and a high of ₹496.40. On the performance front, Exide Industries share price has increased by 41.36% over the last six months and is up 27.15% on a year-on-year basis.


₹475.20
1.94% down today
₹486.90
1D LOW
1D HIGH

Exide Industries Returns Calculator


Circuit
L
H
₹388.40
₹582.60
52-week
L
H
₹287.00
₹496.40

About Exide Industries

Exide Industries Share Price
ISIN
INE302A01020
Sector Market Cap
₹ 41,233.5 Cr

Exide Industries Ltd is a significant player in battery production globally. The Kolkata headquartered company was founded in 1947. Exide is one of India's foremost storage battery companies, offering an extensive range including traditional flooded and cutting-edge VRLA (valve regulated lead acid) batteries. Beyond the domestic market, the company exports batteries that are quite popular in Southeast Asian and European markets.
The company manufactures the widest range of storage batteries catering to different industries. Exide Industries markets its products in India under the brand names of Exide, SF, Sonic and Standard Furukawa. The company is also a major supplier of batteries to car and two-wheeler manufacturers. In the international market the company’s products are sold under the Dynex, Index and Sonic brands.
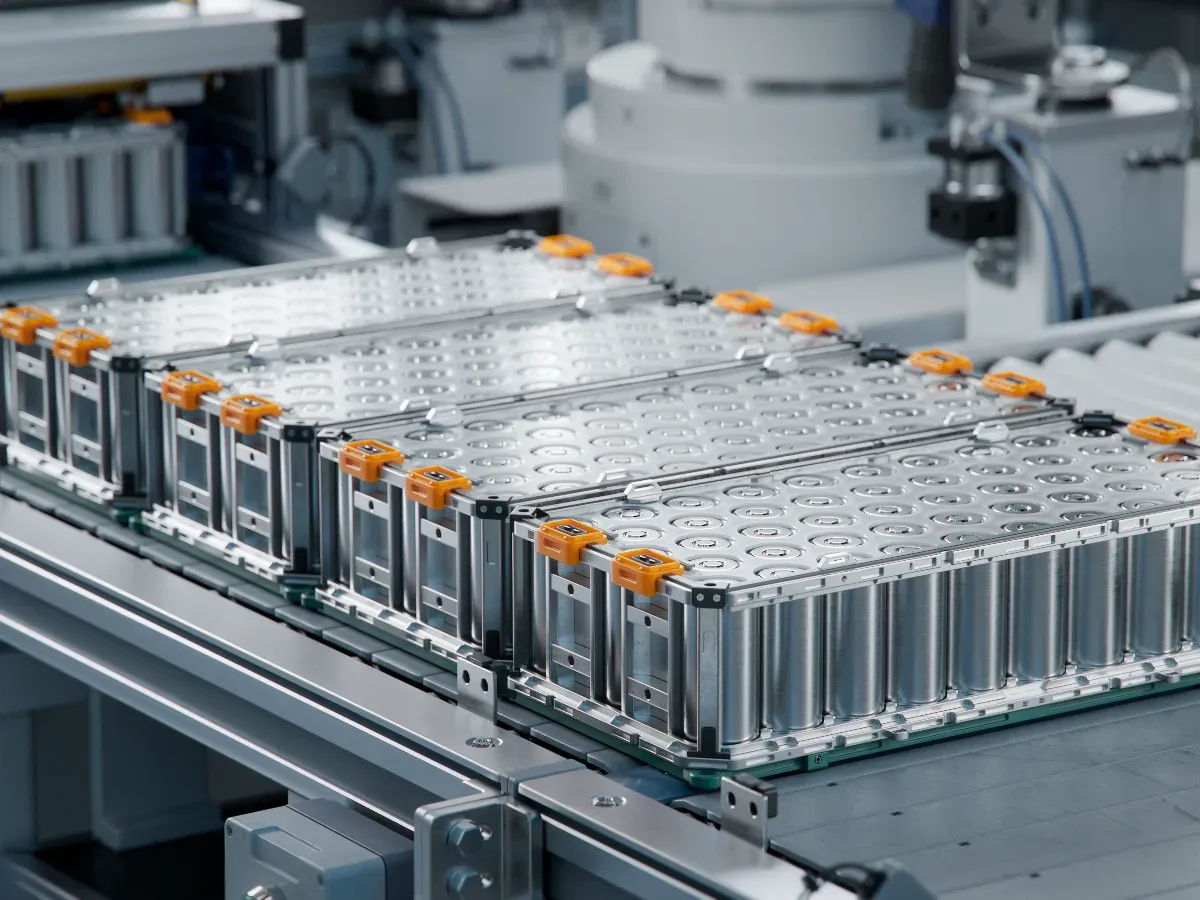
The market capitalisation of Exide Industries Ltd stood at ₹24,654 crore as of December 21, 2023. Exide Industries share price has gained 51% in the last three years.

Business operations

In its journey of over seven decades, Exide Industries has expanded its operations globally. It operates subsidiaries in the United Kingdom, Singapore and Sri Lanka. It exports products to 60 countries across 6 continents.

Exide's manufacturing operations are carried out at ten factories across India. Seven of these factories are dedicated to battery production, while the remaining two focus on home UPS systems. Together, these factories have an annual output of 54 million automotive batteries (including those for motorcycles) and over 5.8 billion Ampere-Hours of industrial power supply.

In 1976, Exide Industries established its R&D centre, which is known as a leading battery research facility globally. Exide has also acquired new technology through collaborations with leading international battery manufacturers. Exide has partnerships with Furukuwa of Japan, Oldham of the UK and East Penn Manufacturing of the US.

Exide designs, produces and markets the most extensive variety of lead acid storage batteries worldwide, ranging from 2.5Ah to 20,600Ah capacity. This diverse range caters to many sectors such as automobile, power, telecom, infrastructure projects, computer industries, railways, mining and defence sectors.

The company produces a diverse range of batteries catering to automotive industry, industrial users, submarine producers and domestic users. The company also manufactures inverter batteries, UPS systems, integrated power backup systems, solar products, batteries for gensets, e-rickshaw batteries. Its industrial batteries primarily cater to railways, telecom, power plants and solar energy projects.

Exide Industries is one among the only five companies in the world who have the capability to produce submarine batteries for Russian and German types.

Exide also provides services including equipment selection, battery sizing, optimal room layout, installation, operation and maintenance services.

The company’s subsidiaries include Chloride Metals Ltd, Exide Energy Pvt Ltd, Exide Energy Solutions Ltd, Chloride International Ltd, Chloride Batteries SE Asia Pte Ltd, ESPEX Batteries Ltd and Associated Battery Manufacturers (Ceylon) Ltd.

Exide Industries Q3 FY26 Results

In Q3 FY26, Exide Industries reported a net profit of ₹194 crore compared to ₹157 crore in Q3 FY25, up by 23.7% on a YoY basis. In the last quarter, Exide Industries’ net profit was ₹174 crore. Therefore, on a quarter-on-quarter (QoQ) basis, net profit rose by 11.49%.

During the quarter, Exide Industries recorded a strong revenue of ₹4,201 crore vs ₹4,017 crore in Q3 FY25. It reflects a revenue growth of 4.6% on a YoY basis. In Q2 FY26, the revenue was ₹4,365 crore. Therefore, on a quarter-on-quarter (QoQ) basis, revenue declined by -3.75%.

Exide Industries’ EBITDA rose by 6.5% at ₹452 crore compared to ₹425 crore in Q3 FY25. The EBITDA margin improved to 10.8%, compared with 10.6% in the same period last year.

Exide Industries Financial Highlights

  • Revenue: Exide Industries reported revenue of ₹18,096.21 crore in FY26 vs ₹17,350.65 crore in FY25. It showed an increase of 4.30% on a yearly basis.
  • Operating Profit: Exide Industries reported an operating profit of ₹1,248.81 crore in FY26 vs ₹1,175.96 crore in FY25. It showed an increase of 6.19% on a year-on-year basis.
  • Net Profit: Exide Industries reported a net profit of ₹859.92 crore in FY26 vs ₹800.50 crore in FY25. It showed an increase of 7.42% on a yearly basis.

Exide Industries Quarterly Result Highlights

  • Exide Industries reported revenue of ₹5,555.25 crore in Jun 2026, compared with ₹4,739.37 crore in Mar 2026, representing an increase of 17.21% on a quarter-on-quarter (QoQ) basis.
  • Exide Industries reported an operating profit of ₹487.03 crore in Jun 2026, compared with ₹327.45 crore in Mar 2026, representing an increase of 48.73% on a quarter-on-quarter (QoQ) basis.
  • Exide Industries reported a profit of ₹351.30 crore in Jun 2026, compared with ₹216.73 crore in Mar 2026, reflecting an increase of 62.09% on a QoQ basis.
  • The earnings per share (EPS) of Exide Industries stood at ₹10.05 during Jun 2026.
Know more
Promoters
45.99%
FII
10.63%
Other DII
11.13%
Retail and other
24.08%
Mutual funds
8.17%
Foreign institutions - FII
FII shareholding by period
Sep 202510.88%
Dec 202510.92%
Mar 202610.30%
Jun 202610.63%
Mkt Cap Cr
41,233.50

P/E
44.02

P/B
2.97

ROE
6.14%

D/E
0.03

ROCE
8.84%

Div. Yield
0.41%

EPS(TTM)
13.07
Turnover
0.94

EV/EBITDA
21.05

Net Margin
6.44%

Op. Margin
11.74%

ROA
4.41%

Quick Ratio
0.52

Curr. Ratio
1.37
Based on fundamentals, this stock's
Step 5 of 5
Performance
Excellent
Exide Inds. outperforming all market indices
Step 1 of 5
Valuation
Overvalued
Exide Inds. appears overvalued compared to its peers
Step 5 of 5
Earnings
Excellent
Exide Inds. revenue, operating profit and net profit are growing
Peer Comparison
Peer comparison — key ratios
NameMkt Cap CrP/EP/BROED/EROCEBook ValueDiv. YieldTurnoverEPS(TTM)
Samvardhana Motherson Intl1,76,681.0038.754.289.42%0.2211.36%36.540.36%0.261.70
Bosch1,38,812.0058.749.3515.83%0.0120.79%5,036.380.58%0.97939.28
Uno Minda71,779.2055.6210.5217.53%0.3318.79%100.220.21%1.5016.87
Sona BLW Precision Forgings49,572.4072.278.2810.70%0.0613.46%93.710.43%0.6510.40
Endurance Techno41,793.8043.916.1113.91%0.0115.68%351.250.39%1.7252.17
ZF Steering Gear (India)29,745.9059.588.0614.01%0.0118.65%323.040.03%0.95267.13
Craftsman Automation27,135.2058.365.1611.76%0.9812.23%1,916.120.10%0.7093.92
Motherson Sumi26,831.7042.5912.4128.92%0.1133.80%3.261.43%2.600.94
Sundaram Fasteners25,831.1042.106.0413.83%0.1116.84%192.980.65%1.0827.62
Gabriel India25,658.5073.1218.7031.46%0.0336.15%75.410.28%2.1914.59

Exide Industries Financials

Full statement

Income Statement · Consolidated

Income Statement · Consolidated — all values in INR Crore
ParticularsMar 2026Mar 2025Mar 2024Mar 2023
Revenue₹17,995.35₹17,237.85₹16,769.73₹15,078.16
Other Income₹100.86₹112.80₹89.95₹124.53
Total Revenue₹18,096.21₹17,350.65₹16,859.68₹15,202.69
Total Expenses₹16,837.49₹16,175.19₹15,629.06₹14,065.38
Profit Before Tax₹1,248.81₹1,175.96₹1,231.17₹1,137.59
Tax₹388.89₹375.46₹348.35₹314.82
Profit After Tax₹859.92₹800.50₹882.82₹822.77
EPS - Basic₹10.05₹9.35₹10.31₹9.68
EPS - Diluted₹10.05₹9.35₹10.31₹9.68

Cash Flow · Consolidated

Cash Flow · Consolidated — all values in INR Crore
ParticularsMar 2026Mar 2025Mar 2024Mar 2023
Profit before tax₹1,248.81₹1,175.96₹1,231.17₹1,137.59
Income before WC changes₹1,944.61₹1,831.44₹1,834.27₹1,641.03
Change in Assets₹602.22-₹1,154.09-₹745.22-₹787.35
Change in Liabilities₹264.13₹973.22₹831.83₹244.70
Change in WC₹866.35-₹180.87₹86.61-₹542.65
Cash flow from Operations₹2,413.16₹1,272.90₹1,533.14₹768.24
Cash flow from Investing-₹1,551.20-₹1,933.92-₹1,458.27-₹798.82
Cash flow from Financing-₹804.51₹514.62₹108.10-₹30.10
Total Cash Flow₹57.45-₹146.40₹182.97-₹60.68
Cash (Start of the year)₹180.82₹322.99₹131.78₹189.11
Cash (End of the year)₹238.27₹176.59₹314.75₹128.43

Balance Sheet · Consolidated

Balance Sheet · Consolidated — all values in INR Crore
ParticularsMar 2026Mar 2025Mar 2024Mar 2023
Non-Current Assets₹14,141.41₹14,192.28₹11,898.50₹9,074.35
Current Assets₹7,078.47₹7,204.05₹6,251.52₹5,690.99
Total Assets₹21,219.88₹21,396.33₹18,150.02₹14,765.34
Current Liabilities₹5,781.42₹5,880.37₹4,447.56₹3,024.22
Net Current Asset₹1,297.05₹1,323.68₹1,803.96₹2,666.77
Non-Current Liabilities₹1,507.24₹1,581.84₹800.96₹599.82
Equity Capital₹13,931.22₹13,934.12₹12,901.50₹11,141.30
Total Equity & Liabilities₹21,219.88₹21,396.33₹18,150.02₹14,765.34

Income Statement · Standalone

Income Statement · Standalone — all values in INR Crore
ParticularsMar 2026Mar 2025Mar 2024Mar 2023
Revenue₹17,268.92₹16,588.11₹16,029.19₹14,591.93
Other Income₹93.07₹96.16₹84.54₹132.39
Total Revenue₹17,361.99₹16,684.27₹16,113.73₹14,724.32
Total Expenses₹15,861.88₹15,242.79₹14,703.85₹13,509.23
Profit Before Tax₹1,491.07₹1,441.48₹1,409.88₹1,215.09
Tax₹379.74₹364.55₹356.92₹311.46
Profit After Tax₹1,111.33₹1,076.93₹1,052.96₹903.63
EPS - Basic₹13.07₹12.67₹12.39₹10.63
EPS - Diluted₹13.07₹12.67₹12.39₹10.63

Cash Flow · Standalone

Cash Flow · Standalone — all values in INR Crore
ParticularsMar 2026Mar 2025Mar 2024Mar 2023
Profit before tax₹1,491.07₹1,441.48₹1,409.88₹1,215.09
Income before WC changes₹1,980.88₹1,934.26₹1,879.79₹1,623.35
Change in Assets₹427.05-₹921.34-₹265.03-₹574.73
Change in Liabilities₹212.97₹657.64₹752.42₹120.96
Change in WC₹640.02-₹263.70₹487.39-₹453.77
Cash flow from Operations₹2,231.15₹1,297.92₹1,996.52₹848.37
Cash flow from Investing-₹1,962.56-₹1,180.25-₹1,617.15-₹887.79
Cash flow from Financing-₹215.24-₹223.85-₹230.05-₹46.08
Total Cash Flow₹53.35-₹106.18₹149.32-₹85.50
Cash (Start of the year)₹111.26₹217.44₹68.12₹153.62
Cash (End of the year)₹164.61₹111.26₹217.44₹68.12

Balance Sheet · Standalone

Balance Sheet · Standalone — all values in INR Crore
ParticularsMar 2026Mar 2025Mar 2024Mar 2023
Non-Current Assets₹13,610.74₹12,904.67₹11,564.82₹8,966.02
Current Assets₹5,645.90₹5,914.42₹5,301.52₹5,085.02
Total Assets₹19,256.64₹18,819.09₹16,866.34₹14,051.04
Current Liabilities₹4,128.44₹3,901.95₹3,259.21₹2,499.17
Net Current Asset₹1,517.46₹2,012.47₹2,042.31₹2,585.85
Non-Current Liabilities₹454.62₹474.80₹469.89₹342.12
Equity Capital₹14,673.58₹14,442.34₹13,137.24₹11,209.75
Total Equity & Liabilities₹19,256.64₹18,819.09₹16,866.34₹14,051.04
* All values are in INR Crore
Qty
Bid
0
0
0
0
0
0
0
0
0
0
Ask
Qty
476.1
1210
0
0
0
0
0
0
0
0
Bid Total: 0
Ask Total: 1210
Buy orders: 0%
Sell orders: 100%
Bearish
3
Neutral
4
Bullish
1
Slightly Bearish
by SEBI experts
Expert Pick
EXPPICK
Stop-loss
Entry price
Target
Indicator
Value
Verdict

RSI (14)
69.25
Neutral

ATR (14)
18.15
Neutral

STOCH(9,6)
80.67
Bearish

STOCH RSI (14)
70.97
Neutral

ADX(9)
49.46
Bearish

UO(9)
51.88
Neutral

ROC(12)
14.67
Bullish

WillR(14)
-14.33
Bearish
Period
Simple value
Exponential vaue

5D
484.2
480.97

10D
475.53
474.51

20D
457.73
460.38

50D
424.08
429.71

100D
382.42
401.55
Volume trend — traded volume by day
14 Aug15L
13 Aug18L
12 Aug45L
11 Aug42L
10 Aug32L
Average30L
Compare against other stocks
Exide Industries Share Price
Exide Industries
Batteries
Add Stock
Add Another

Exide Industries Share Price FAQs