- home/
- option chain
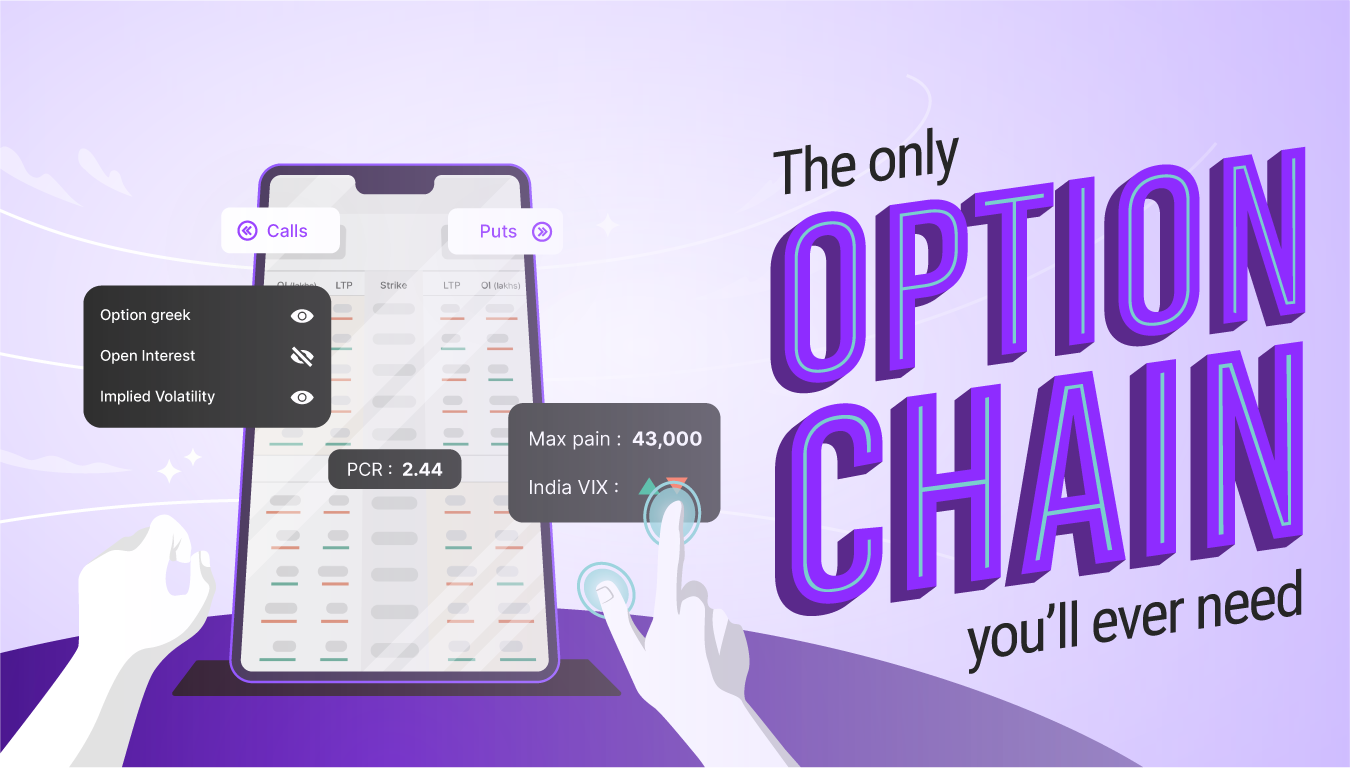
The only Option Chain you’ll ever need
Power-packed with 10+ data points to analyse trends, spot trading opportunities and place trades
By signing up you agree to our Terms and Conditions
Analyse trends easily
With key data points - Option Greeks, Max Pain, OI Analysis, PCR, India VIX
Make Option Chain your own
Reorder and edit data points as per your choice
Compare option contracts
Enjoy unique colour differentiation between OTM, ITM, ATM, Calls & Puts
Save time, place faster trades
Trade directly from Option Chain
Getting Started With Option Chains
A guide on what is Option Chain, how to use it, its benefits and more
Want to read instead?
Getting Started With Option Chains
A guide on what is Option Chain, how to use it, its benefits and more
Read Market BlogTop traded options with Upstox
Frequently Asked Questions
What is an Option Chain?

Option chain is a list of all available option contracts for a stock or an index. It shows all call and put options contracts with details such as expiration, strike price, volume and price in a single frame. The strike price is at the centre and all data pertaining to calls and puts on the same strike are presented next to each other. Normally, the calls are on the left side of the option chain and the puts are on the right side of the option chain.
Traders use the option chain to understand the dynamics and the direction of price movements. It also helps to identify which options contracts are liquid and which are illiquid. Normally it helps the traders to evaluate the depth and liquidity of specific strikes. An option chain helps a trader with the following information and data.
- Last Traded price
- Bid price
- Ask price
- Ask quantity
- Bid quantity
- Implied Volatility
- Open Interest
- Change in Open Interest
- Volume
How to read data on an Option Chain?

Option Chain is a table that contains the most critical information you need to buy and sell options. An option chain lists data on calls and puts, underlying prices, strike prices, expiration, and moneyness.
- Call option data is listed to the left of the table.
- Put option data is listed to the right of the table.
- Strike prices are listed on rows in the centre of the table.
- Option chains may also have data on last traded price, open interest, volatility and Greeks.
- Last Traded Price (LTP), Change in LTP: The last traded price is for the respective call option and put option. During market hours, this could change by the second. For strike prices that are deep out-of-the-money and thinly traded, this data may be stale. Often quoted with the LTP is the change in last traded price. This is the difference between the prior day’s closing price and the current price.
- Open Interest (OI), Change in OI: The open interest is updated throughout the day as options are bought and sold to open, as well as bought and sold to close. The change in open interest for the day may be listed as well. The change in OI is based on the difference between the closing open interest value for the day before and the current value.
- Volume: The volume represents the number of transactions for a particular call or put option contract. It is specific to the day. This value is updated throughout the day in real-time.
- Implied Volatility: There is an implied volatility value associated with each call and put option. So, for each row of strike prices and each expiration date, there will be an implied volatility. We will cover implied volatility in depth in this chapter but this value is derived from the last traded price of the option. If an option hasn’t traded for the day- perhaps because it is deep out-of-the-money- there won’t be an implied volatility value for that particular option.
- Option Greeks: There are several option Greeks including Delta, Gamma, Theta, Vega, and Rho. These values inform the trader how much the price of the option will change based upon another value changing. For example, delta tells the trader how much the option price will change if the underlying price changes and theta gives the value for how much the option price will change based on the passage of time. We will go into Greeks in more detail in later chapters
What is Option Chain analysis?

What is volume in Option Chain?

The volume represents the number of transactions for a particular call or put option contract. It is specific to the day. This value is updated throughout the day in real-time.
How is the Upstox Option Chain better?
It is the only Option Chain you’ll need!
- It’s power-packed with 10+ data points like PCR, Max Pain, OI Analysis, India VIX
- You can make Option Chain your own by reordering or editing them as per your choice
- Save time, place faster trades directly from Option Chain
Can we use the Option chain through the app?
Yes, Option Chain is available on the Upstox app. Click on any stock or index and go to the ‘Option Chain’ tab.
How to get old Option Chain data?
You can get historical F&O Contract data from the Exchange website.
How is the Option Chain price calculated?
Data on the Last Traded Price on Option Chain is taken from the Exchanges.
