Upstox Originals
Revenue gains and slippage pains: A Q2 FY25 recap for private banks
.png)
7 min read | Updated on October 24, 2024, 18:25 IST
SUMMARY
Some of the largest private banks have already announced their Q2FY25 earnings and results are mixed. Profit growth has underperformed revenue growth, highlighting concerns about cost pressures. On an encouraging note, slippages and NPAs broadly remain under control. While most management have highlighted a positive outlook, investors have reasons to tread with caution.
Stock list

Private banks NPAs have remained stable so far in Q2FY25
Private banks in India have shown a mixed bag of results in Q2 FY25, reflecting both strengths and challenges. While some banks enjoyed healthy revenue growth, others faced rising slippages, especially in unsecured loan segments.
In the table below, we look at the broad trend in revenue growth of the major private banks that have announced their results. Overall, revenue has grown ~16% YoY, driven by improved liquidity, credit growth, and healthy growth in fee income, among others.
Private banks: Trend in revenue performance
| Revenue (in ₹ Cr) | Revenue (in ₹ Cr) | Revenue (in ₹ Cr) | Growth (%) | Growth (%) | |
|---|---|---|---|---|---|
| Banks | Q2FY24 | Q1FY25 | Q2FY25 | YoY | QoQ |
| HDFC | 1,07,567 | 1,16,996 | 1,21,457 | 12.9% | 3.8% |
| Axis | 33,122 | 37,796 | 39,204 | 18.4% | 3.7% |
| Kotak Mahindra | 21,560 | 25,076 | 26,880 | 24.7% | 7.2% |
| RBL | 3,721 | 4,272 | 4,459 | 19.8% | 4.4% |
| Total | 1,65,970 | 1,84,140 | 1,92,000 | 15.7% | 4.3% |
Source: Tijori finance; Aside from the banks discussed above, the Q2FY25 results for other banks have not yet been released at the time of writing.
Next, we move to profitability. Net Interest Margin (NIM), shows how much a bank earns from loans compared to what it pays on deposits.
It's calculated by subtracting the interest paid from the interest earned, and then dividing it by the bank’s total earning assets. A higher margin means the bank is more profitable from its lending activities.
From the table below, NIM margins have broadly been flat. That said, profitability growth has been slower than overall revenue growth, implying that cost pressures are impacting overall profitability.
Private banks: Trend in profitability
| NIM % (in ₹ Cr) | NIM % (in ₹ Cr) | NIM % (in ₹ Cr) | PAT | PAT | PAT | PAT growth (%) | PAT growth (%) | |
|---|---|---|---|---|---|---|---|---|
| Companies | Q2FY24 | Q1FY25 | Q2FY25 | Q2FY24 | Q1FY25 | Q2FY25 | YoY | QoQ |
| HDFC | 3.6% | 3.7% | 3.5% | 17,312 | 17,188 | 18,627 | 7.6% | 8.4% |
| Axis | 4.1% | 4.1% | 4.1% | 6,493 | 6,450 | 7,409 | 14.1% | 14.9% |
| Kotak Mahindra | 5.2% | 5.0% | 4.9% | 4,423 | 7,399 | 4,998 | 13.0% | -32.5% |
| RBL | 4.9% | 5.7% | 5.0% | 331 | 351 | 223 | -32.6% | -36.5% |
| Total | 3.9% | 4.0% | 3.9% | 28,559 | 31,388 | 31,257 | 9.4% | -0.4% |
Source: Tijori finance
Let’s look at some key metrics
CASA ratio
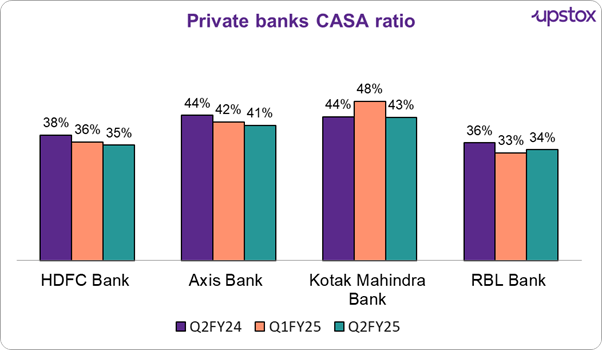
The CASA ratio shows the percentage of low-cost current and savings accounts in a bank's total deposits, helping reduce funding costs. Overall, the CASA ratios in the chart below for private banks are showing a downward trend, indicating these banks might be facing challenges in maintaining low-cost deposits. To a certain extent, this explains why rising funding costs are impacting overall profitability, leading to slower PAT growth

Source: Company reports.
Slippage ratio
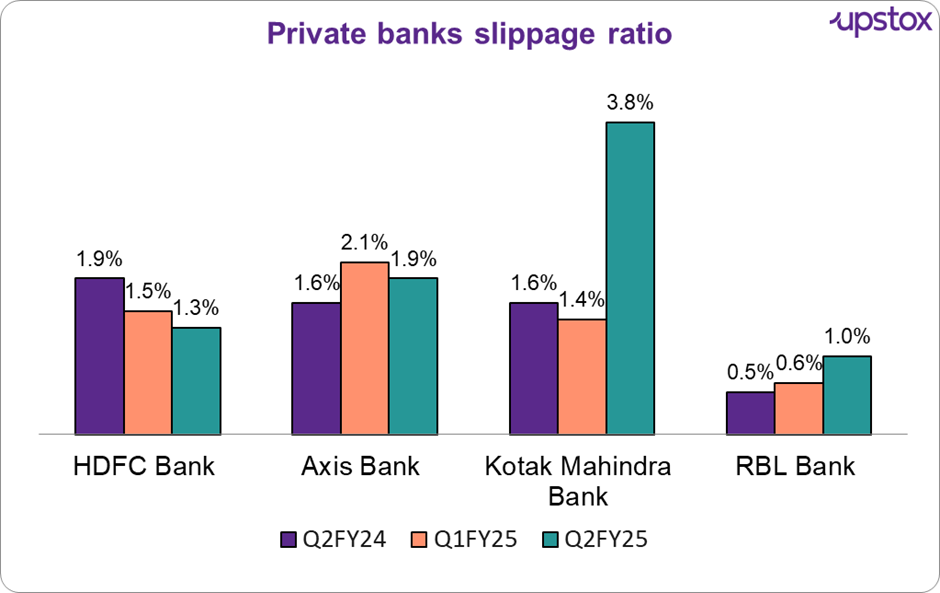
Slippage refers to loans that have newly turned bad or become non-performing within a given period. It measures fresh additions to a bank's pool of bad loans. The slippage ratio tells us how many loans have gone bad and turned into non-performing assets (NPAs) over a certain period. It’s like a health check for a bank’s loan quality.
Even though the CASA ratio shows some stress, but on a positive note, slippages provide some encouragement.
While overall slippages seem to be reducing, two key exceptions.
- RBL Bank: Has elevated slippages in Q2FY25, largely due to internal changes and issues in the microfinance sector where borrowers are over-leveraged
- Kotak Mahindra Bank: Slippages have increased due to the rising credit costs of legacy credit card accounts. This increase was compounded by regulatory restrictions, like the RBI ban on onboarding new digital customers, which has added pressure to the bank’s asset quality

Source: Company reports.
Non-performing assets (NPA)
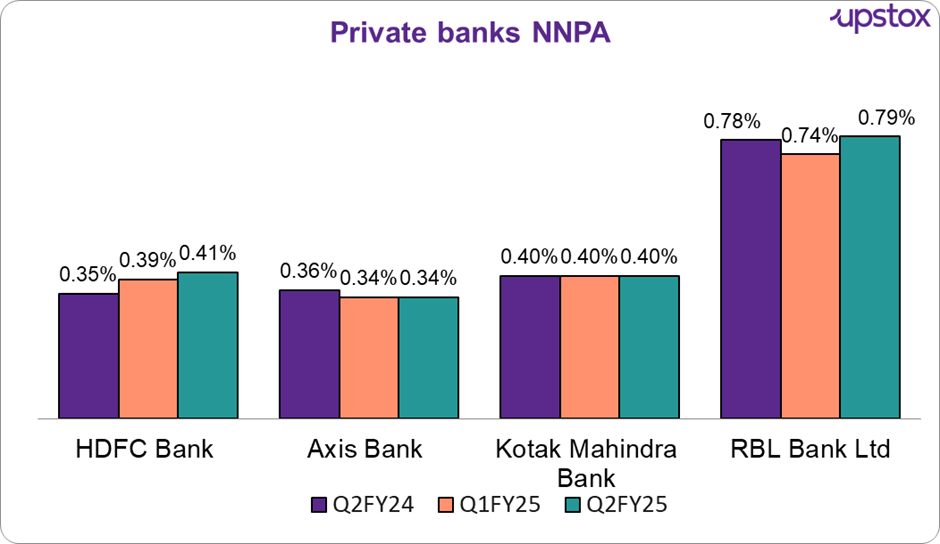
Versus slippage, NPAs (Non-Performing Asset), represent loans that have already been classified as bad and remain unpaid for a significant period, typically 90 days. NPA is a broader measure of a bank's existing bad loans, while slippage tracks new ones.
While there are minor changes to the banks, overall Net NPAs (NNPAs) still remain under control.

Source: Company reports
What are the challenges this sector can face?
As per statements given by managements of Kotak Bank, Axis Bank, HDFC Bank, the following are challenges they expect in the banking sector
-
Loan spread pressure: Wholesale loan spreads are under pressure, particularly for banks like HDFC.
-
Interest rate uncertainty: Banks, including HDFC and Axis, are adopting a "wait-and-see" approach to interest rates due to market uncertainty.
-
Rising retail stress: Stress in the unsecured lending segment, particularly in retail (Axis Bank) and credit cards (Kotak Bank), is increasing.
-
Microfinance segment strain: Banks have highlighted slow growth and strain in the microfinance segment.
-
Regulatory and technological compliance: Banks are cautious about the potential regulatory impact, including RBI orders on technology infrastructure (Kotak Bank) and LCR guidelines.
Management commentary (select banks)
HDFC Bank
-
Improving liquidity: Liquidity has been improving over the past few months, while deposit rates remain stable.
-
Strong credit growth: Credit growth across the system continues to outpace expectations.
-
Future outlook: While growth might be slower initially, it’s expected to align with the system soon. Overall, stable with cautious optimism.
Axis Bank
-
Upbeat perspective: Management is upbeat about the banking industry’s health.
-
Robust credit growth: Strong growth, especially in retail and rural sectors.
-
Future opportunities: Overall, they see a healthy, growing industry with plenty of opportunities.
-
The table below summarises the performance of the top 10 banks (by market capitalisation) in the sector over the past 3 years.
| # | Name | Market Cap ₹ Cr. | P/B ratio | ROE (%) | 3-Year Stock Return % (2019-2024) | 3-Year Profit Growth % (2019-2024) |
|---|---|---|---|---|---|---|
| 1 | HDFC Bank | 13,07,916 | 2.9 | 17.1 | 0.7 | 30.2 |
| 2 | ICICI Bank | 8,93,185 | 3.4 | 18.8 | 18.6 | 21.4 |
| 3 | Axis Bank | 3,63,665 | 2.3 | 18.4 | 12.9 | 20.5 |
| 4 | Kotak Mah. Bank | 3,50,544 | 2.7 | 15.1 | -6.7 | 19.7 |
| 5 | IndusInd Bank | 99,520 | 1.6 | 15.3 | 2.1 | 16.4 |
| 6 | IDBI Bank | 83,318 | 1.7 | 11.8 | 13.1 | 9.8 |
| 7 | Yes Bank | 62,851 | 1.4 | 3.2 | 13.4 | 11.3 |
| 8 | IDFC First Bank | 51,115 | 1.5 | 10.1 | 11 | 23.8 |
| 9 | AU Small Finance | 47,423 | 3.4 | 13.1 | 1.7 | 28.7 |
| 10 | Federal Bank | 46,425 | 1.6 | 14.8 | 22.1 | 18.1 |
| Average | 3,30,596 | 2.3 | 13.7 | 8.9 | 19.9 |
Source: Screener
Conclusion
It is difficult to make any definitive assessments from the results of just a few banks. Broadly speaking, the sector remains poised for growth, but effective risk management and strategic focus on balancing credit costs will be crucial for long-term stability. As more results roll in, a clearer picture of the sector’s overall health will emerge, highlighting both resilience and areas needing attention
By signing up you agree to Upstox’s Terms & Conditions
About The Author
Next Story
