Market News
SBI to announce Q3 results today: Check earnings preview and technicals
.png)
4 min read | Updated on February 06, 2025, 10:55 IST


SUMMARY
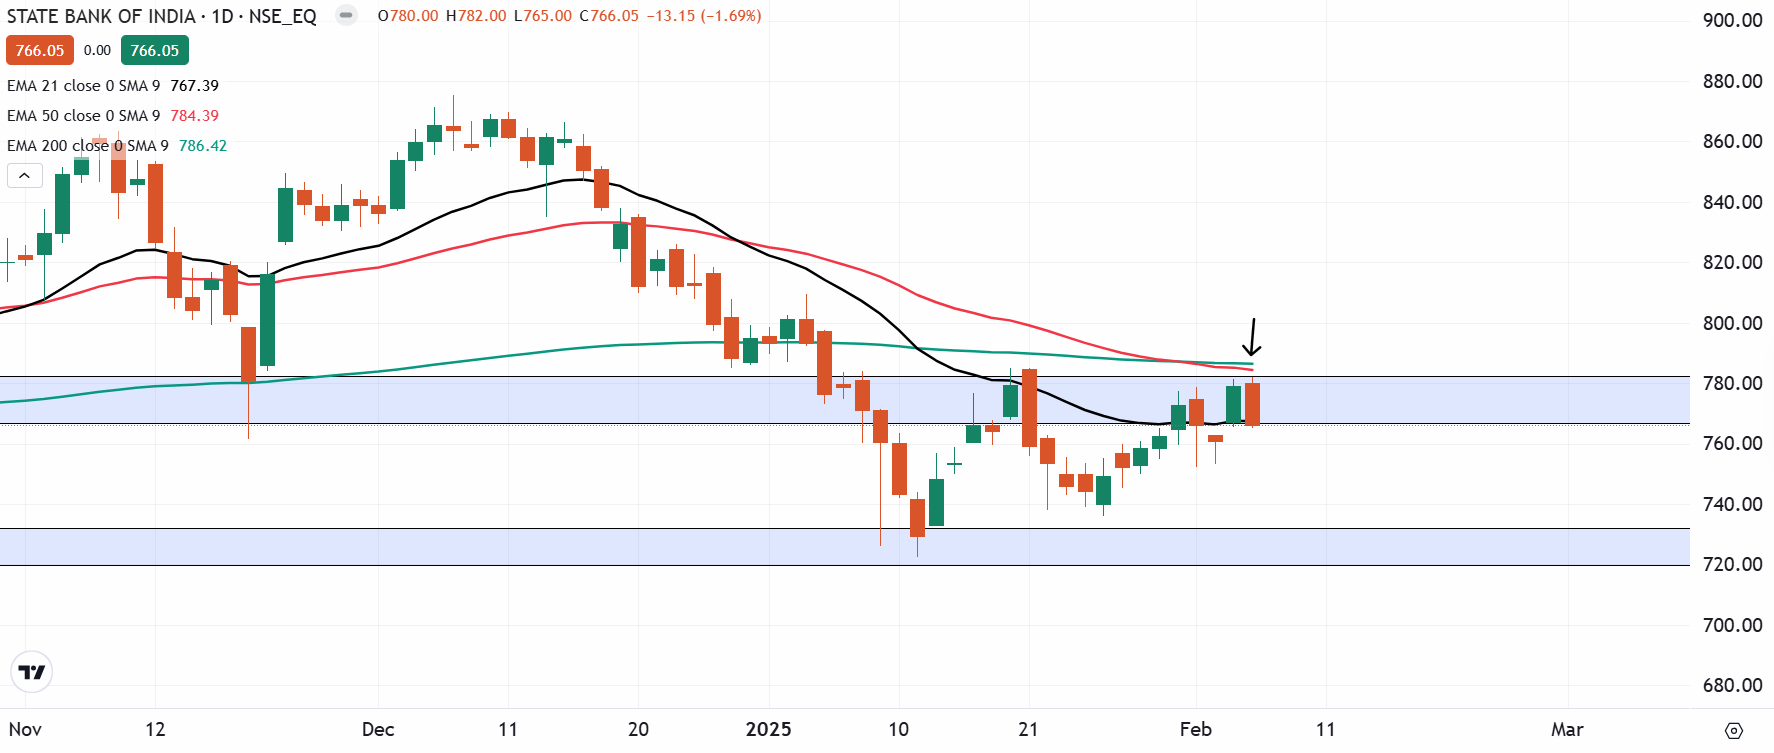
Shares of SBI are currently trading below the 21, 50, and 200 EMAs, forming a bearish engulfing candle on the daily chart. This indicates that the breadth remains weak. Meanwhile, it is important to note that ahead of its third-quarter results, the options market is implying a ±6.1% move ahead of its February expiry.
Stock list
SBI is expected to report strong double-digit growth in net profit for the December quarter. | Image: Shutterstock
According to market experts, SBI’s standalone net profit is projected to rise 58-65% year-on-year (YoY) to ₹14,500–₹15,250 crore. This surge in profitability is likely driven by loan and deposit growth along with stable asset quality.
However, net profit may see a sequential decline, as SBI reported a higher net profit of ₹18,331 crore in the previous quarter. Meanwhile, net interest income (NII) is expected to grow 4-6% YoY, reaching ₹41,600–42,440 crore. Analysts also anticipate healthy double-digit growth in the bank’s loan book and deposits.
During the results announcement, investors will closely watch management’s commentary on credit growth trends within the industry, along with key financial indicators such as loan and deposit growth, net interest margin (NIM) and gross and net non-performing assets (NPAs).
Ahead of the Q3 results, SBI shares closed at ₹766, down 1.6% on February 5.
Technical view
Shares of SBI are currently trading below all of its key exponential moving averages (EMAs) like 21, 50 and 200. Additionally, it formed a bearish engulfing candle on the daily chart, indicating weakness. However, it is important to note that the bearish engulfing is a bearish reversal pattern and gets confirmed if the close of the subsequent candle is below the low of the reversal pattern.
Options outlook
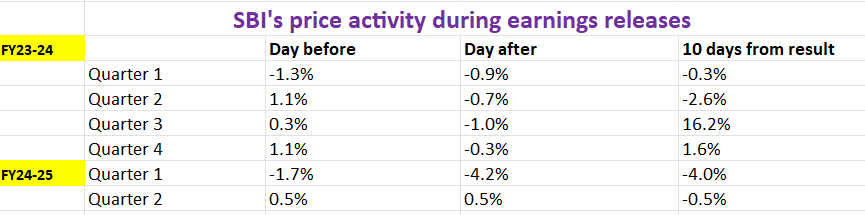
For further understanding, let’s take a look at the historical price behaviour of SBI around its earnings announcement.
Options strategy for State Bank of India
The options data for SBI's February 27 expiry shows a potential price movement of ±6.1%, providing strategic opportunities for traders based on their volatility expectations.
Strategies based on volatility expectations:
-
Expectation of increased volatility: Traders who expect that the volatility in SBI may rise can consider a Long Straddle strategy. This involves buying both an ATM call and an ATM put option with the same strike price and expiry date. This approach will benefit if the price of SBI moves significantly beyond the range of ±6.1% in either direction.
-
Expectation of lower volatility: Traders who expect volatility will remain low, a Short Straddle may be more suitable. This strategy involves selling both an ATM call and an ATM put option with the same strike price and expiry, and profiting if the price of SBI stays within ±6.1%.
Traders anticipating price movement, whether bullish or bearish, might consider directional spreads as a more strategic approach than simply buying options.
-
For a bullish outlook, traders can consider a bull call spread. This strategy involves buying a call option and simultaneously selling another call option with a higher strike price of the same expiry. This approach lowers the initial cost but also limits potential profits.
-
On the other hand, traders expecting a drop in price can initiate a bear put spread. It involves buying a put option while selling a lower strike put, creating a strategy that balances risk and reward.
About The Author
Next Story


