Volume: What is a trading volume and how you can use it as a beginner
Written by Mariyam Sara
Published on October 17, 2025 | 3 min read
Technical analysis is the study of price on charts, but a skilled trader knows that price alone cannot help you spot a profitable trade. You need other parameters to identify successful trading opportunities, and volume is at the top of that list.
Volume is the salt of technical analysis, it may not be the primary ingredient, but when added, it definitely enhances your trading quality. In this blog, you will learn what volume is and how you can use it in trading.
What is volume?
In simple language, volume is the number of shares changing hands in the stock market within a specific period of time. It is an important tool used by skilled traders to identify trend strength, patterns, and predict future price movements. Studying price along with its volume can help you spot good trading opportunities.
How to use volume in trading
When you insert the trading volume feature, green and red bars will appear at the bottom of the price chart. These bars represent the rise and fall in trading volume, with red bars indicating a decline and green bars representing an increase in trading volume.
Low trading volume
When observing the price movements on a stock chart, add the trading indicator to identify the strength of the price trend. If the stock price is rising with low trading volume, that is a weak uptrend. Similarly, if stock prices are falling with low trading volume, it signifies a weak downtrend.
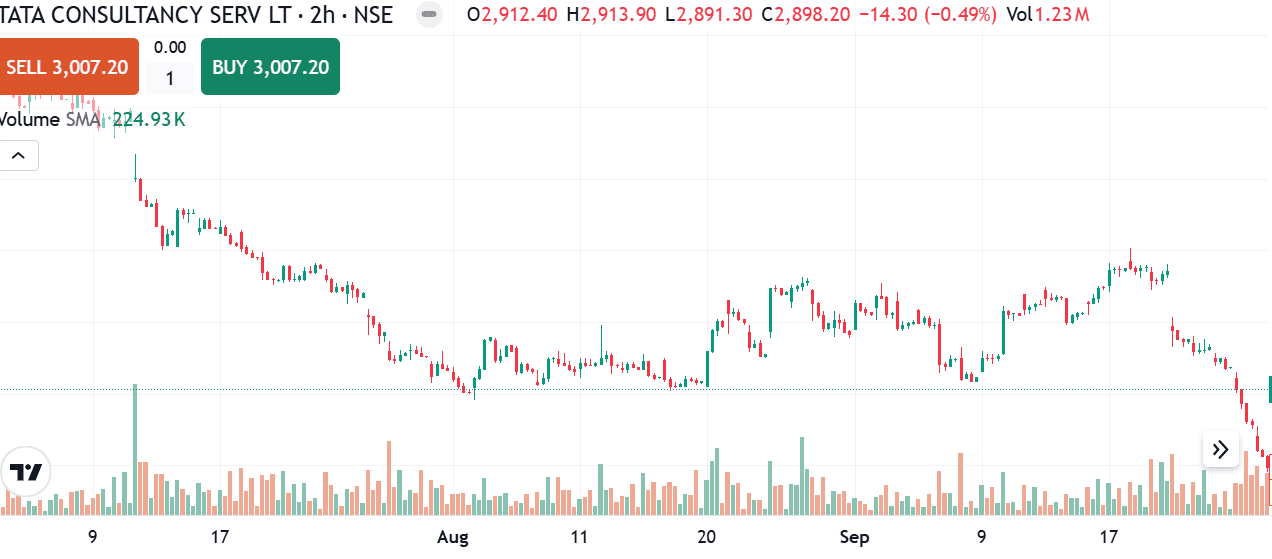
In the above TCS stock chart, you can see the price rising, which shows a bullish trend. But the trading volume is falling, making multiple red bars, meaning fewer buyers are buying, causing this uptrend. This shows that the uptrend you see is weak and not worth entering.
In the same share price chart, the price is falling, but trading volume is decreasing, meaning few sellers are selling. Red bars show a low number of sellers pushing down the stock price, causing a downtrend. This confirms the downtrend we see is a weak bearish trend.
High trading volume
A high trading volume means a high number of stocks are exchanging hands in the stock market. A high trading volume confirms the strength of a trend.

In the above price chart, you can observe that the price is rising, with the majority of green candlesticks making higher highs. If you notice the training volume, more green volume bars are formed, confirming that it’s a strong bullish trend.
In the price chart, you see the majority of red candlesticks being formed, making lower highs and the majority of green bars signalling high numbers of shares changing hands. The red candlestick, coupled with green volume bars, confirms a strong bearish trend.
Important Points to Remember When Observing Trading Volume
| Stock Price Movement | Trading Volume | Trend Strength |
|---|---|---|
| Rises | High | Strong bullish trend |
| Rises | Low | Weak bullish trend |
| Falls | High | Strong bearish trend |
| Falls | Low | Weak bearish trend |
You might have heard the phrase, “knowledge is power”, but here at Upstox, we believe Knowledge is power only when applied. So log onto TV.Upstox and practice analysing trend strength using the trading volume feature.
If you want to transform yourself from novice to a smart trader, sign up on Uplearn by Upstox and start your trading journey today!
About Author
Mariyam Sara
Sub-Editor
holds an MBA in Finance and is a true Finance Fanatic. She writes extensively on all things finance whether it’s stock trading, personal finance, or insurance, chances are she’s covered it. When she’s not writing, she’s busy pursuing NISM certifications, experimenting with new baking recipes.
Read more from MariyamUpstox is a leading Indian financial services company that offers online trading and investment services in stocks, commodities, currencies, mutual funds, and more. Founded in 2009 and headquartered in Mumbai, Upstox is backed by prominent investors including Ratan Tata, Tiger Global, and Kalaari Capital. It operates under RKSV Securities and is registered with SEBI, NSE, BSE, and other regulatory bodies, ensuring secure and compliant trading experiences.


